
ABSTRACT
Background. Geometric changes are frequent during the course of treatment of lung cancer patients. This may potentially result in deviations between the planned and actual delivered dose. Electronic portal imaging device (EPID)-based integrated transit planar portal dosimetry (ITPD) is a fast method for absolute in-treatment dose verification. The aim of this study was to investigate if ITPD could detect geometric changes in lung cancer patients.
Materials and methods. A total of 460 patients treated with volumetric modulated arc therapy (VMAT) following daily cone beam computed tomography (CT)-based setup were visually inspected for geometrical changes on a daily basis. Forty-six patients were subject to changes and had a re-CT and an adaptive treatment plan. The reasons for adaptation were: change in atelectasis (n = 18), tumor regression (n = 9), change in pleural effusion (n = 8) or other causes (n = 11). The ITPDs were calculated on both the initial planning CT and the re-CT and compared with a global gamma (γ) evaluation (criteria: 3%\3mm). A treatment fraction failed when the percentage of pixels failing in the radiation fields exceeded 10%. Dose-volume histograms (DVHs) were compared between the initial plan versus the plan re-calculated on the re-CT.
Results. The ITPD threshold method detected 76% of the changes in atelectasis, while only 50% of the tumor regression cases and 42% of the pleural effusion cases were detected. Only 10% of the cases adapted for other reasons were detected with ITPD. The method has a 17% false-positive rate. No significant correlations were found between changes in DVH metrics and γ fail-rates.
Conclusions. This study showed that most cases with geometric changes caused by atelectasis could be captured by ITPD, however for other causes ITPD is not sensitive enough to detect the clinically relevant changes and no predictive power of ITPD was found.
Anatomical changes occur in around 23% of lung cancer patients during a course of radiotherapy [Citation1]. Several anatomical changes may occur in the lung, i.e. disappearing or developing atelectasis or pleural effusion, tumor shrinkage, shifts of the tumor and/or metastatic lymph nodes. These anatomical changes can result in significant changes between the planned and delivered dose [Citation1–5]. With the introduction of complex treatment delivery techniques of external beam radiotherapy (EBRT) such as volumetric modulated arc therapy (VMAT), radiation dose can be delivered with high conformality, reducing dose to the organs at risk (OARs) [Citation6–8]. VMAT delivers its dose by using many degrees of freedom during the dose optimization such as gantry angle, field shape, dose per segment and dose rate. The high occurrence rate of anatomical changes happening through the treatment and the highly dynamic delivery makes in-treatment verification of the dose essential for ensuring the treatment delivery quality to the patient. The electronic portal imaging device (EPID) has been demonstrated to be an accurate tool for in-treatment dose verification [Citation9,Citation10]. Several methods for EPID dose verification have been demonstrated, e.g. planar dose verification with integrated and, more recently, also time-resolved verification, or three-dimensional (3D) EPID dose verification [Citation11–13].
Several groups have investigated the predictive power of planar dosimetry. Nijsten et al. [Citation14] showed that it was possible to predict changes in the dose volume histogram (DVH) for conformal radiotherapy of breast cancer. Others have shown that per-beam planar dosimetry of intensity modulated radiotherapy (IMRT) show little or no correlation to clinically relevant dose changes [Citation15,Citation16]. Especially for VMAT the predictive power of integrated transit planar dosimetry (ITPD) may be questionable as Mans et al. [Citation9] reported a very low frequency of treatments needing adaptation, based on planar dosimetry. Conversely, it has been shown in a clinical study that at least 12% of lung cancer patients suffering from changes due to atelectasis, pleural effusion or pneumonia may benefit from an adaptive radiotherapy strategy to ensure target coverage or to avoid normal tissue complications [Citation1]. The actual number of patients needing adaptation is higher when deviations in, e.g. tumor and lymph node positions are concerned [Citation1].
The aim of this study was therefore to investigate whether ITPD for VMAT has added value in detecting dose differences caused by anatomical changes throughout the treatment in a large cohort of lung cancer patients.
Material and methods
Patient cohort and treatment adaptation
In this retrospective study we assessed the entire population (460 patients) of non-small cell lung cancer (NSCLC) and small cell lung cancer (SCLC) patients radically treated at our department between January 2013 and September 2014. All patients were treated using VMAT, applying the dose in one or two (semi-) arcs, using 10 MV photon beam quality, delivered with a Varian True Beam linear accelerator (Varian Medical Systems, Palo Alto, CA, USA). Treatment planning was performed using Varian's treatment planning system Eclipse version 11 and the Acuros dose calculation algorithm. From this database, we analyzed in depth the identified 46 NSCLC/SCLC patients for whom treatment was adapted during their course of (chemo)radiotherapy (). The decision to adapt treatment was taken in clinical practice and was based on anatomical discrepancies seen in the daily kV cone beam computed tomography (CBCT), e.g. on CBCT the CTV shifted outside the planning target volume (PTV) on CTp, or pleural effusion caused a reduction in dose to the PTV. After visual signaling, the dose was re-calculated on the CBCT and in a patient board, it was decided in consensus by the radiation oncologist and medical physicist whether a plan needed adaptation. In this study, differences were categorized as either: 1) change in atelectasis [a collapse or closure of (parts of the) the lung, resulting in a reduced or absent gas exchange] (n = 18); 2) tumor regression (n = 9); 3) change in pleural effusion (fluid accumulated in the pleural cavity) (n = 8); 4) other changes (n = 11), e.g. patient positioning. When relevant geometrical differences were observed in the daily CBCT images compared to the original planning CT (CTp), it was decided to acquire a new planning-CT (CTr). On this CTr contours were re-delineated from scratch and it was used for treatment adaptation. For this study, the 3D dose for each adapted case was analyzed in the treatment planning system by first rigidly registering CTp with CTr on bony anatomy and then copying the original treatment plan on the CTr resulting in simulated delivered dose Dd, which was then compared to the originally planned dose DP based on the CTp.
Table I. Patient and tumor characteristics. (The cT and cN refer to the 7th edition of the UICC-TNM staging for lung cancer).
Integrated transit planar dosimetry (ITPD)
ITPD was used to compare planned versus delivered dose at the level of the EPID (DEPID) with the patient in the beam. A validated prediction model was used to simulate both the planned and delivered ITPD dose (DEPID_p and DEPID_d) using the patient geometries described by CTp and CTr [Citation17]. DEPID_p and DEPID_d were then compared with a global gamma (γ) evaluation with dose-difference (DD) and distance to agreement (DTA) criteria of 3%/3mm [Citation18,Citation19]. For each field the percentage pixels exceeding unity (P(|γ|> 1)) inside the whole field was extracted. A dose delivery difference was flagged (i.e. considered significant) when our current clinical action level was exceeded, which was when one of the arcs of the plan exhibits a P(|γ|> 1) of at least 10% of the pixels. Supplementary Figure 1 (available online at http://informahealthcare.com/doi/abs/10.3109/0284186X.2015.1061213) shows a schematic overview of the calculation of the ITPD.
3D dose analysis
To quantify dose changes the DVHs for the planned dose Dp and the delivered dose Dd were compared. The clinical target volume (CTV), the PTV and the mediastinum as OAR were subject to investigation. During treatment planning the mediastinum constraint was the hardest to meet and therefore the mediastinum was part of the 3D dose analysis. Dp and Dd distributions for the two CT scans were converted to DVHs. For the CTV of the primary tumor and the CTV of the lymph nodes, dose to 98% of the volume (D98%), the dose to 95% of the volume (D95%) and the dose to 5% of the volume (D5%) were extracted from both Dp and Dd. Furthermore, a relative difference for each metric was calculated, i.e. ΔDx = (Dp,x–Dd,x)/Dp,x*100 with x = 98%, 95%, 5% extracting the ΔD98%, ΔD95%, ΔD5% for the CTVs. For the PTV the same relative differences was calculated but for the mean dose (ΔDmean), ΔD95% and ΔD5%. Finally, for the mediastinum the maximum dose (Dmax), the dose to 2%, of the volume (D2%) and the dose to 0.5 cm3, of the volume (D0.5cm3) were calculated, resulting in a ΔDmax, ΔD2%, ΔD0.5cm3. A DVH was considered to be deviating significantly (DVH+) when one of the metrics showed a difference of more than 4%. Otherwise, it was considered DVH negative (DVH-). The 4% threshold to define DVH+ cases was based on the dose precision requirements as defined by Brahme et al. [Citation20]. For the DVH analysis compared to the visual decision-making the positive predictive value (PPV) and the false discovery rate (FDR) were calculated to analyze the performance of the DVH analysis. The PPV was calculated as PPV = number of true positives/number of DVH+ cases and the FDR was calculated as FDR = number of false positives/number of DVH+ cases. For comparison of the DVH to the ITPD method, the sensitivity (number of true positives ITPD/number of DVH positive cases) and specificity (number of true negative ITPD/number of DVH negative cases) were calculated. A regression analysis was performed between the DVH metrics and the maximum P(|γ|> 1) over all arcs of the treatment plan, determining the correlation coefficients (R2).
Results
From the patients that were detected as needing adaptation, ITPD in total detected 49% with the criterion of P(|γ|> 1)> 10%. For the dose differences caused by atelectasis the detection rate against the DVH+ cases was 76%, for tumor regression 50%, for pleural effusion 42% and for differences caused by patient positioning and other causes a 10% detection rate was achieved. For the DVH detection versus the visual decision-making the PPV was 87% while the FDR was 13%.
For pleural effusion, weak correlations for the ΔD5% for the CTV lymph nodes (R2 = 0.23) and for the ΔD2% of the mediastinum (R2 = 0.51) were found (). For the latter, also weak correlations for the CTV of the lymph nodes for the ΔD5% (R2 = 0.65) and ΔD95% of the CTV of the primary tumor (R2 = 0.38) were calculated (). No other significant correlations were found ().
Table II. R2 values for different DVH metrics correlated to the γ fail-rate, for the different structures, the CTV of the primary tumor, the CTV of the lymph nodes, the PTV and the mediastinum.
Across the group, 40 patients were DVH+ and six were DVH-. From the 40 DVH+ cases, 20 were flagged with ITPD while from the DVH-cases only one was flagged positive, resulting in a sensitivity of 0.50 and specificity of 0.83 between the DVH status and ITPD. and Supplementary Figure 2 (available online at http://informahealthcare.com/doi/abs/10.3109/0284186X.2015.1061213) depict examples of patients that were flagged or not flagged by ITPD, respectively.
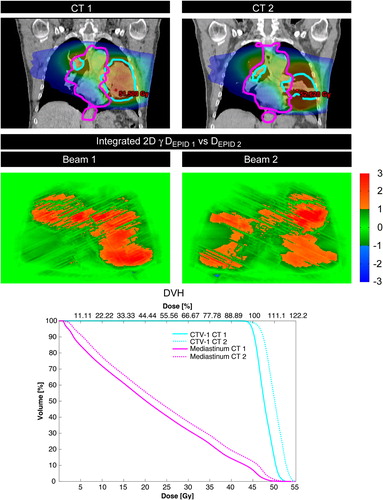
Figure 1. An example of tumor regression which is accurately flagged by ITPD with high P(|γ|> 1) for each arc (28% and 29%, respectively). The ITPD shows predominantly red areas indicating that the planar dose difference found in the γ calculation shows a positive dose difference, however, it should be noted that this could also be interpreted as a shift with a small positive DD. The DVH also shows an over-dosage of the CTV (sky blue) and to the mediastinum (magenta), which could confirm that in this case the red areas are caused by a dose difference and not a shift.
Discussion
In this study we have investigated the predictive power of in-treatment ITPD for detecting dose differences caused by anatomic changes in NSCLC and SCLC patients undergoing VMAT. For lung cancer it has been shown that approximately 23% of the patients show anatomical changes throughout the course of treatment, while approximately 12% needs adaptive actions to ensure treatment quality [Citation1]. Considering the volume of > 400 lung cancer patients at our clinic per year, > 44 of these patients each year may benefit from adaptive strategies. However, with ITPD we found no significant correlations between γ fail-rates and DVH metrics for in-treatment geometrical changes. Due to the lack of correlation between γ fail-rates and DVH metrics, different clinical action levels, other then P(|γ|> 1) of at least 10% of the pixels are not expected to influence the results significantly. For patients exhibiting tumor regression, a very weak correlation was found between the CTV DVH metrics and γ fail-rates. A possible explanation for the weak correlation may be that when a tumor shrinks, lower densities around the target (CTV) are observed, resulting in less beam attenuation and therefore in a higher dose to the smaller target volume (see the DVH in ). The lower densities around the CTV may result in a higher DEPID_d due to reduced attenuation. The higher dose captured in the ITPD might result in γ fail-rates with a positive sign of the dose difference (see the red areas in the ITPD γ images in ), which weakly correlate to the changes in the DVH. Another explanation for the weak correlation may be that the geometrical difference in our study was always the same (shrinkage) and that it always occurred in the high dose volume. Notably, it should be mentioned that the tumor shrinkage sub-group was small (n = 8).
Several groups studied the predictive value of γ metrics and relevant changes in the 3D dose or DVH. The studies can be roughly divided into two groups: 1) pre-treatment, and 2) in-treatment, studying either: a) planar dosimetry, or b) 3D dosimetry. For in-treatment planar dosimetry the positive predictive values of γ metrics has been shown for breast cancer patients while another report presented it as a method to detect dose differences over all treatment sites [Citation9,Citation14]. For 3D in-treatment portal dosimetry a study for head and neck cancer patients showed a positive correlation between γ metrics and changes in the DVH [Citation3]. All pre-treatment studies either using planar or 3D portal dosimetry report weak to no predictive value of γ metrics for changes in the 3D dose or DVH [Citation9,Citation10,Citation14,Citation15]. In general for the pre-treatment studies weak to no correlations have been found while for the in-treatment studies some positive correlations have been found.
Most previous studies have investigated pre-treatment dosimetry either planar or 3D [Citation15, Citation16,Citation21,Citation22]. The difference between our work and most previous studies is that in-treatment planar dosimetry for VMAT was used for lung cancer patients. The studies of Rozendaal et al. [Citation3] and Nijsten et al. [Citation13] have also looked at in-treatment portal dosimetry for head and neck and breast cases, respectively. The latter study also used in-treatment planar dosimetry. This study showed that patient-setup differences and relevant DVH changes can be predicted for conformal radiotherapy (CRT) for breast cancer patients. CRT ITPDs are very different from VMAT ITPDs because of the absence of dose gradients caused by the delivery properties of VMAT. The other in-treatment portal dosimetry study of Rozendaal et al. [Citation3] looked at VMAT for head-and-neck cancer patients and found a positive predictive value for γ metrics and DVH metrics. However, they used 3D portal dosimetry, which is not comparable to planar portal dosimetry.
The large scale study of Mans et al. [Citation9] using ITPD showed a very low number of patient errors detected with ITPD. Only 17 of more than 4000 patients were flagged of which only seven were attributed to geometrical changes and the other cases were ascribed to technical beam delivery failures. No quantitative detection criteria were mentioned in this study. From the sub-group of lung cancer patients (454), two cases with dose differences were identified (0.4%). This appears to be a very small fraction compared to the present study where 20 cases (4.3%) of 460 where detected by ITPD with a sensitivity of only 0.50.
ITPD seems to hide certain dose delivery changes, which is reflected in the low sensitivity of 0.50. This may have several causes. IMRT and especially VMAT are highly dynamic treatment delivery techniques utilizing many degrees of freedom to deliver a single treatment beam in many small sub-beams/control points. When all control points/timing information are integrated in an ITPD this results in a high amount of dose gradients. It has been shown in simulations for planar dosimetry that using a γ evaluation on ITPDs the detection-rate depends on the fraction of gradients in the dose distributions [Citation15].
The combined findings of previous and the present work indicate that more advanced dose verification techniques are necessary to verify VMAT dose distributions, which should be able to capture the dynamic/timed nature of advanced delivery techniques. A time-resolved verification method may be essential to verify these dynamic treatments. The applicability of time-resolved EPID dosimetry has been demonstrated recently for pre-treatment verification of VMAT treatments [Citation11,Citation23,Citation24]. Our group modified the γ evaluation in such a way to extend the search space of the algorithm into the time-domain [Citation19]. Supplementary Figure 3 (available online at http://informahealthcare.com/doi/abs/10.3109/0284186X.2015.1061213) demonstrates an example where ITPD results in a false negative, and where a dose difference caused by a geometrical change is negated in the ITPD. It depicts a spherical target moving in the horizontal direction in such a way that it is no longer completely encompassed by the rotating beam with a fixed square field size. As a result the time-resolved EPID images show large discrepancies (red and blue regions) at certain times, in particular when the beams are perpendicular to the horizontal plane that contains the motion direction (Supplementary Figure 3 available online at http://informahealthcare.com/doi/abs/10.3109/0284186X.2015.1061213). However, the time-integrated ITPD image shows zero failure due to exact cancelling of the time-resolved discrepancies. Another advantage of time-resolved methods, when applied online, is that gross delivery changes due to geometrical changes could be detected and treatment could be interrupted during the treatment [Citation25].
In conclusion, time-integrated EPID dosimetry in the form of ITPD has little to no predictive power in detecting dose delivery changes due to anatomical changes in lung cancer patients undergoing VMAT. A low sensitivity and no significant correlations between changes in DVH metrics and γ fail-rates render ITPD unsuitable in detecting a large fraction of the relevant dose discrepancies. More advanced in-treatment dose verifications methods may be necessary to verify these types of dynamic treatments. Time-resolved planar EPID dosimetry TRTPD may be a good candidate for such a method.
Supplementary material available online
Supplementary Figure 1–3 available online at http://informahealthcare.com/doi/abs/10.3109/0284186X.2015.1061213
ionc_a_1061213_sm0854.zip
Download Zip (294 KB)Acknowledgments
The authors would like to thank Dr. Stefan Scheib and Dr. Christof Baltes from Varian Medical Systems for their expertise and advice. This project was partially funded by Varian Medical Systems (project: TimePort-II).
Declaration of interest: The authors report no conflicts of interest. The authors alone are responsible for the content and writing of the paper.
References
- Møller DS, Khalil AA, Knap MM, Hoffmann L. Adaptive radiotherapy of lung cancer patients with pleural effusion or atelectasis. Radiother Oncol 2014;110:517–22.
- Persoon LCGG, Egelmeer AGTM, Öllers MC, Nijsten SMJJG, Troost EGC, Verhaegen F. First clinical results of adaptive radiotherapy based on 3D portal dosimetry for lung cancer patients with atelectasis treated with volumetric-modulated arc therapy (VMAT). Acta Oncol 2013;52:1484–9.
- Rozendaal RA, Mijnheer BJ, van Herk M, Mans A. In vivo portal dosimetry for head-and-neck VMAT and lung IMRT: Linking γ-analysis with differences in dose-volume histograms of the PTV. Radiother Oncol 2014;112:396–401.
- Senthi S, Dahele M, Slotman BJ, Senan S. Investigating strategies to reduce toxicity in stereotactic ablative radiotherapy for central lung tumors. Acta Oncol 2014;53: 330–5.
- Lens E, van der Horst A, Kroon PS, van Hooft JE, Dávila Fajardo R, Fockens P, et al. Differences in respiratory- induced pancreatic tumor motion between 4D treatment planning CT and daily cone beam CT, measured using intratumoral fiducials. Acta Oncol 2014;53:1257–64.
- Weiss E, Robertson SP, Mukhopadhyay N, Hugo GD. Tumor, lymph node, and lymph node-to-tumor displacements over a radiotherapy series: Analysis of interfraction and intrafraction variations using active breathing control (ABC) in lung cancer. Int J Radiat Oncol Biol Phys 2012; 82:e639–45.
- Schmidt ML, Hoffmann L, Kandi M, Møller DS, Poulsen PR. Dosimetric impact of respiratory motion, interfraction baseline shifts, and anatomical changes in radiotherapy of non-small cell lung cancer. Acta Oncol 2013;52:1490–6.
- Britton KR, Starkschall G, Liu H, Chang JY, Bilton S, Ezhil M, et al. Consequences of anatomic changes and respiratory motion on radiation dose distributions in conformal radiotherapy for locally advanced non-small-cell lung cancer. Int J Radiat Oncol Biol Phys 2009;73:94–102.
- Mans A, Wendling M, McDermott LN, Sonke JJ, Tielenburg R, Vijlbrief R, et al. Catching errors with in vivo EPID dosimetry. Med Phys 2010;37:2638.
- Nijsten SMJJG, Mijnheer BJ, Dekker ALAJ, Lambin P, Minken AWH. Routine individualised patient dosimetry using electronic portal imaging devices. Radiother Oncol 2007;83:65–75.
- Podesta M, Nijsten SMJJG, Persoon LCGG, Scheib SG, Baltes C, Verhaegen F. Time dependent pre-treatment EPID dosimetry for standard and FFF VMAT. Phys Med Biol 2014;59:4749–68.
- Mans A, Remeijer P, Olaciregui-Ruiz I, Wendling M, Sonke J-J, Mijnheer B, et al. 3D Dosimetric verification of volumetric-modulated arc therapy by portal dosimetry. Radiother Oncol 2010;94:181–7.
- Nijsten SMJJG, van Elmpt WJC, Jacobs M, Mijnheer BJ, Dekker ALAJ, Lambin P, et al. A global calibration model for a-Si EPIDs used for transit dosimetry. Med Phys 2007;34:3872.
- Nijsten SMJJG, van Elmpt WJC, Mijnheer BJ, Minken AWH, Persoon LCGG, Lambin P, et al. Prediction of DVH parameter changes due to setup errors for breast cancer treatment based on 2D portal dosimetry. Med Phys 2009;36:83.
- Nelms BE, Zhen H, Tomé WA. Per-beam, planar IMRT QA passing rates do not predict clinically relevant patient dose errors. Med Phys 2011;38:1037.
- Kruse JJ. On the insensitivity of single field planar dosimetry to IMRT inaccuracies. Med Phys 2010;37:2516.
- van Elmpt WJC, Nijsten SMJJG, Mijnheer BJ, Minken AWH. Experimental verification of a portal dose prediction model. Med Phys 2005;32:2805.
- Low DA, Dempsey JF. Evaluation of the gamma dose distribution comparison method. Med Phys 2003;30:2455–64.
- Podesta M, Persoon LCGG, Verhaegen F. A novel time dependent gamma evaluation function for dynamic 2D and 3D dose distributions. Phys Med Biol 2014;59:5973–85.
- Brahme A. Dosimetric precision requirements in radiation therapy. Acta Radiol Oncol 1984;23:379–91.
- Carrasco P, Jornet N, Latorre A, Eudaldo T, Ruiz A, Ribas M. 3D DVH-based metric analysis versus per-beam planar analysis in IMRT pretreatment verification. Med Phys 2012; 39:5040.
- Zhen H, Nelms BE, Tomé WA. Moving from gamma passing rates to patient DVH-based QA metrics in pretreatment dose QA. Med Phys 2011;38:5477.
- Woodruff HC, Fuangrod T, Rowshanfarzad P, McCurdy BMC, Greer PB. Gantry-angle resolved VMAT pretreatment verification using EPID image prediction. Med Phys 2013;40:081715.
- Ravkilde T, Keall PJ, Grau C, Høyer M, Poulsen PR. Time-resolved dose reconstruction by motion encoding of volumetric modulated arc therapy fields delivered with and without dynamic multi-leaf collimator tracking. Acta Oncol 2013;52:1497–503.
- Fuangrod T, Woodruff HC, van Uytven E, McCurdy BMC, Kuncic Z, O’Connor DJ, et al. A system for EPID-based real-time treatment delivery verification during dynamic IMRT treatment. Med Phys 2013;40:091907.