
ABSTRACT
Background. Oropharyngeal squamous cell carcinoma (OPSCC) is one of the fastest growing disease sites of head and neck cancers. A recently described radiomic signature, based exclusively on pre-treatment computed tomography (CT) imaging of the primary tumor volume, was found to be prognostic in independent cohorts of lung and head and neck cancer patients treated in the Netherlands. Here, we further validate this signature in a large and independent North American cohort of OPSCC patients, also considering CT artifacts.
Methods. A total of 542 OPSCC patients were included for which we determined the prognostic index (PI) of the radiomic signature. We tested the signature model fit in a Cox regression and assessed model discrimination with Harrell's c-index. Kaplan-Meier survival curves between high and low signature predictions were compared with a log-rank test. Validation was performed in the complete cohort (PMH1) and in the subset of patients without (PMH2) and with (PMH3) visible CT artifacts within the delineated tumor region.
Results. We identified 267 (49%) patients without and 275 (51%) with visible CT artifacts. The calibration slope (β) on the PI in a Cox proportional hazards model was 1.27 (H0: β = 1, p = 0.152) in the PMH1 (n = 542), 0.855 (H0: β = 1, p = 0.524) in the PMH2 (n = 267) and 1.99 (H0: β = 1, p = 0.002) in the PMH3 (n = 275) cohort. Harrell's c-index was 0.628 (p = 2.72e-9), 0.634 (p = 2.7e-6) and 0.647 (p = 5.35e-6) for the PMH1, PMH2 and PMH3 cohort, respectively. Kaplan-Meier survival curves were significantly different (p < 0.05) between high and low radiomic signature model predictions for all cohorts.
Conclusion. Overall, the signature validated well using all CT images as-is, demonstrating a good model fit and preservation of discrimination. Even though CT artifacts were shown to be of influence, the signature had significant prognostic power regardless if patients with CT artifacts were included.
Accounting for approximately half a million cases annually worldwide, head and neck squamous cell carcinoma (HNSCC) is a considerable cause of mortality and morbidity, with the majority of patients having locally advanced, unresectable disease [Citation1]. Oropharyngeal squamous cell carcinoma (OPSCC) has been one of the fastest growing disease sites for HNSCC [Citation2].
Known prognostic factors of locally advanced HNSCC include tumor category, nodal category and human papilloma virus (HPV) status, the latter in particular related to overall survival for OPSCC patients [Citation3–6]. Other potential prognostic factors are obtained by molecular characterization of the tumor, mostly requiring tissue extraction [Citation7–9]. The inherent limitations of biopsies are however their invasiveness and probability of misrepresenting the entire tumor due to intra-tumor heterogeneity, as they only characterize a small portion of the tumor [Citation10]. In contrast, medical imaging is non-invasive and able to capture the entire tumor volume, including intra-tumor heterogeneity, which could provide additional information to supplement traditional tissue biopsy [Citation11]. Nowadays, imaging is used routinely throughout the course of treatment and therefore there is ready access to this useful information.
Radiomics is a high-throughput approach to translate medical images into mineable data by extracting a large number of quantitative features describing tumor intensity, shape, and texture [Citation12–14]. The hypothesis being that a comprehensive and robust [Citation15–19] quantification of imaging phenotypes provides complementary and clinically relevant information, which may lead to imaging biomarkers [Citation20]. As shown in recent studies, quantitative imaging features have prognostic value and potential in predicting clinical outcomes or treatment monitoring in different cancer types [Citation21–26].
Here, we focus on a recently described prognostic radiomic signature, which is based exclusively on pre-treatment CT imaging of the primary tumor volume [Citation27]. This signature was derived from non-small cell lung cancer (NSCLC) patients and independently validated to be not only prognostic in NSCLC, but as well in two HNSCC patient cohorts, of which all patients were treated in the Netherlands. In this study we aim to further validate the prognostic value of this radiomic signature in a large and independent North American cohort of OPSCC patients (n = 542), also considering the presence of CT artifacts [Citation28].
Materials and methods
Patients and CT imaging
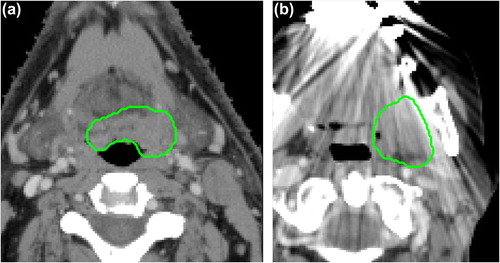
Institutional research ethics board approval was obtained and the need for written consent was waived for this retrospective study. A total of 542 patients with OPSCC, treated with curative intent at the Princess Margaret Cancer Center (PMH) between 2005 and 2010 were included in this study. Treatment consisted of radiotherapy or concurrent chemoradiotherapy, with standard fractionated IMRT up to 70 Gy. All patients underwent pre-treatment CT imaging of the head and neck on one of available CT scanners (General Electric Discovery ST; General Electric Lightspeed Plus; Toshiba Medical Systems Aquillion ONE). CT scans were acquired in helical mode with a slice thickness of 2.5 mm (General Electric) or 2 mm (Toshiba), at 120 kVp and 300 mAs tube current (variable tube current for Toshiba scans). The gross primary tumor volume (GTV) was manually delineated for each patient for treatment planning purposes (). Images were visually assessed for the presence of CT artifacts (e.g. streak artifacts due to dental fillings) within the GTV ().
Figure 1. Representative images of OPSCC patients from the validation cohort, without (a) and with (b) visible CT artifacts. The GTV delineation is shown in green.
Radiomic signature
The radiomic signature we aim to validate consists of the following four features, derived from the GTV: 1) “First order statistics: Energy”, describing the overall density of the tumor volume; 2) “Shape: Compactness”, quantifying the compactness of the tumor volume relative to that of a sphere (i.e. the most compact shape); 3) “Gray level run length: Gray level non-uniformity”, a measure of intra- tumor heterogeneity; and 4) Wavelet (HLH) “Gray level run length: Gray level non-uniformity”, also describing intra-tumor heterogeneity, but now after wavelet decomposition of the original CT image. A detailed mathematical description of the aforementioned features, as described by Aerts et al. [Citation27], can be found in the Supplementary Appendix, to be found online at http://informahealthcare.com/doi/abs/10.3109/0284186X.2015.1061214. Features were extracted using software developed in-house, in Matlab R2012b.
The radiomic signature was based on a Cox proportional hazards model and the weights (β) for each individual feature (x) in the signature are given in . The prognostic index (PI) for the radiomic signature, to be used for validation, is then defined as:
Table I. Description and Cox proportional hazard weights of each feature in the radiomic signature.
Signature validation
To validate the radiomic signature we applied several methods, as described by Royston and Altman [Citation29]. We first determined the model calibration slope (i.e. regression coefficient) on the PI in a Cox regression in the validation cohort and performed a likelihood ratio test of this slope being equal to 1. If the slope equals 1, the relative risk model is valid, otherwise there is a need for recalibration. We formally tested the coefficients (i.e. weights) of the individual variables of the PI, by performing a Cox regression on the individual features of the signature in the validation cohort, offsetting by the original PI (i.e. the coefficient of the PI is 1) and performing a joint test that all coefficients are 0. As a measure of model discrimination in the validation cohort, we determined Harrell's c-index, where a c-index of 1 indicates perfect discrimination. Finally, we compared Kaplan-Meier survival curves between patients with a high and low signature prediction, based on a median threshold that was derived from the MAASTRO “Lung1” cohort by Aerts et al. [Citation27]. A log-rank test was applied to test for significant differences between survival curves.
We validated the radiomic signature in the complete patient cohort (PMH1), in the subset of patients for which there were no visible CT artifacts within the delineated tumor region (PMH2) and in the subset of patients that did have visible CT artifacts (PMH3). All statistical analysis was performed in R (version 3.1.0).
Results
By visual assessment, we identified all scans with CT artifacts inside the GTV, which resulted in a subset of 275 (51%) patients. In we summarized patient characteristic in the complete PMH validation cohort (PMH1), the patient subgroups without (PMH2) and with (PMH3) CT artifacts and, for comparison, the patient characteristics of the MAASTRO “H&N1” and VUmc “H&N2” cohorts originally used for validation of the radiomic signature by Aerts et al.
Table II. Patient characteristics of the PMH validation cohort (PMH1), the subset of patients with no visible CT artifacts within the GTV (PMH2), the subset of patients with visible CT artifacts (PMH3), the MAASTRO “H&N1” cohort and the VUmc “H&N2” cohort [Citation27]. #HPV status only for oropharyngeal patients.
In the complete PMH validation cohort (PMH1; n = 542), the calibration slope on the PI in a Cox proportional hazards model was found to be 1.27 (SE = 0.175). The slope was slightly above 1, but not significantly different from 1 (p = 0.152), indicating a valid relative risk model and preservation of the discriminative value of the radiomic signature in the validation cohort. The joint test of all the predictors in the model with the PI offset was significant (χ42 = 21.87, p = 2.13e-4). Harrell's c-index for the PI was found to be 0.628 (p = 2.72e-9). Survival curves were significantly different (p = 1.93e-5) between patients with high and low radiomic signature model predictions ().
Figure 2. Survival curves based on model predictions of the radiomic signature, split by a median prediction threshold derived by Aerts et al. from the MAASTRO “Lung1” cohort [Citation27]. (a) Survival curves for the PMH validation cohort for all patients (log-rank test p = 1.93e-5) and for the subset of patients without (log-rank test p = 4.89e-5) and with (log-rank test p = 0.004) visible CT artifacts within the GTV. (b) Survival curves for the MAASTRO “H&N1” (log-rank test p = 8.48e-05) and VUmc “H&N2” (log-rank test p = 0.030) cohorts as reported by Aerts et al.
![Figure 2. Survival curves based on model predictions of the radiomic signature, split by a median prediction threshold derived by Aerts et al. from the MAASTRO “Lung1” cohort [Citation27]. (a) Survival curves for the PMH validation cohort for all patients (log-rank test p = 1.93e-5) and for the subset of patients without (log-rank test p = 4.89e-5) and with (log-rank test p = 0.004) visible CT artifacts within the GTV. (b) Survival curves for the MAASTRO “H&N1” (log-rank test p = 8.48e-05) and VUmc “H&N2” (log-rank test p = 0.030) cohorts as reported by Aerts et al.](/cms/asset/c32500e8-b0a6-4589-a9ee-b7004b592714/ionc_a_1061214_f0002_oc.jpg)
After excluding patients with visible CT artifacts within the GTV (PMH2; n = 267), the calibration slope on the PI in a Cox proportional hazards model was found to be 0.855 (SE = 0.236) and not significantly different from 1 (p = 0.524). In the model with the PI offset, the joint test of all individual feature coefficients was significant (χ42 = 12.31, p = 0.015). Harrell's c-index for the PI was 0.634 (p = 2.7e-6) and a significant difference between survival curves was observed (p = 4.89e-5) in this subset of patients ().
Considering patients with visible CT artifacts (PMH3; n = 275), the calibration slope on the PI was 1.99 (SE = 0.273), which was significantly different from 1 (p = 0.002). The joint test of all predictors was significant (χ42 = 16.81, p = 0.002) in the model with the PI offset. The c-index was found to be 0.647 (p = 5.35e-6) and survival curves stratified by high and low signature model predictions were significantly different (p = 0.004).
Discussion
An important step towards clinically using radiomics in the context of personalized medicine [Citation14] is independent and external validation of proposed signatures [Citation3,Citation4]. Here, we evaluated the validity of a recently published CT-based radiomic signature [Citation27]. This signature was described to be prognostic in independent cohorts of both lung and head and neck cancer patients. We found that this signature validated as well in an additional large cohort of OPSCC patients.
As specified in the original publication, the radiomic features of which the signature consists were calculated from the imaging data as-is [Citation27]. CT images were therefore used as generated by the CT scanner and no pre-processing or normalization was performed before feature calculation. Even though it is known that scanner parameters (e.g. slice thickness or reconstruction kernels), which differ across and within patient cohorts, affect textural features computed from CT images [Citation30], Aerts et al. [Citation27] showed translational potential of the radiomic signature across different cohorts. This statement is further strengthened by our findings, given the good model fit and preservation of discriminative value of the signature in our validation cohort (PMH1). In comparison, Aerts et al reported c-indices of 0.686 and 0.685 in two independent head and neck cancer cohorts, whereas we found a c-index of 0.628. Furthermore, survival curves were significantly different, based on a median threshold of signature predictions, derived by Aerts et al. from the MAASTRO “Lung1” cohort. These results are in line with what has been reported by Aerts et al., for both the MAASTRO “H&N1” (p = 8.48e-05) and VUmc “H&N2” (p = 0.030) cohorts and a side-by-side comparison of survival curves is depicted in . Even though our study endorses translational potential of the radiomic signature, we believe that standardization of imaging protocols should be pursued to eliminate variability in radiomic features between institutes, which will greatly improve the potential of radiomics [Citation31,Citation32].
Another common concern in CT images of head and neck cancer are artifacts, mostly caused by metallic dental fillings or other high atomic number material implants [Citation28]. It has to be taken into consideration that the radiomic signature was derived from CT imaging of NSCLC patients, where these type of artifacts (e.g. due to pacemakers) are uncommon. As an additional step we therefore validated the radiomic signature as well on the subset of patients without (PMH2) and with (PMH3) any visible CT artifacts within the delineated tumor region. In the PMH2 cohort subset, the calibration slope deviated less from 1 than in the complete (PMH1) cohort, signifying a better fit of the relative risk model. In contrast, the relative risk model was found to be invalid in the PMH3 cohort, indicating a need for recalibration of the model. These results suggest that there is an influence of CT artifacts on the model fit. Regardless the inclusion of patients with CT artifacts, the discriminative value of the radiomic signature was however preserved in both the PMH2 and PMH3 patient subsets, supported by Harrell's c-indices of 0.634 and 0.647, respectively. A significant difference between survival curves, stratified by high and low signature model predictions, was preserved as well in both patient subsets (). The extent of CT artifacts and the impact on imaging features for head and neck cancer will vary between patients. Promising techniques for metal artifact reduction in CT have been reported [Citation33]. As radiomics relies on extracting meaningful information from medical images, techniques like these should however be thoroughly evaluated (i.e. they should not modify or introduce artificial texture). Besides the influence of the presence of CT artifacts, we also found evidence (joint tests of all the predictors in the model with the PI offset) that the fit of the radiomic signature model in our validation could be improved by adjusting the original weights of the predictors in the PI, regardless of the validity of the relative risk model.
Here we focused on the prognostic value of a radiomic signature, which only contains information derived from standard medical imaging. While our validation study provides further evidence for the concept of radiomics, we do believe that proven prognostic factors like HPV status and other clinical parameters [Citation3–6] should as well be carefully considered in addition to radiomic information. Indeed, Aerts et al. already pointed out that HPV screening for instance provides complementary information to the radiomic signature [Citation27]. Deriving a novel and disease-specific signature for head and neck cancer [Citation34], combining radiomic and clinical information, is therefore warranted for future research – a process that should again be followed by independent validation.
Conclusion
We externally validated a previously described CT-based prognostic radiomic signature in a large OPSCC cohort. Overall, the signature validated well using all CT images as-is, demonstrating a good model fit and preservation of discrimination. Our results showed that CT artifacts are of influence. However, the signature had significant prognostic power regardless if patients with CT artifacts were included. Besides CT artifacts, proven prognostic factors like HPV status should as well be carefully considered, and deriving a novel and disease-specific signature is warranted.
Supplementary material available online
Supplementary Appendix and Figure 1, to be found online at http://informahealthcare.com/doi/abs/10.3109/0284186X.2015.1061214.
ionc_a_1061214_sm2635.pdf
Download PDF (245.3 KB)Acknowledgments
We acknowledge financial support from the QuIC–ConCePT project, which is partly funded by EFPIA companies and the Innovative Medicine Initiative Joint Undertaking (IMI JU) under Grant Agreement No. 115151. This research is also supported by the Dutch technology Foundation STW (grant No. 10696 DuCAT), which is the applied science division of NWO, and the Technology Programme of the Ministry of Economic Affairs. We also acknowledge financial support from the National Institute of Health (NIH-USA U01 CA 143062-01, and NIH-USA U01 CA 190234-01), EU 7th framework program (EURECA, ARTFORCE), Kankeronderzoekfonds Limburg from the Health Foundation Limburg and the Dutch Cancer Society (KWF UM 2011 – 5020, KWF UM 2009 – 4454), and Alpe d’HuZes-KWF (DESIGN).
Declaration of interest: The authors report no conflicts of interest. The authors alone are responsible for the content and writing of the paper.
References
- Jemal A, Bray F, Center MM, Ferlay J, Ward E, Forman D. Global cancer statistics. CA Cancer J Clin 2011;61:69–90.
- Pytynia KB, Dahlstrom KR, Sturgis EM. Epidemiology of HPV-associated oropharyngeal cancer. Oral Oncol 2014;50:380–6.
- Rietbergen MM, Witte BI, Velazquez ER, Snijders PJ, Bloemena E, Speel EJ, et al. Different prognostic models for different patient populations: Validation of a new prognostic model for patients with oropharyngeal cancer in Western Europe. Br J Cancer 2015;112:1733–6.
- Rios Velazquez E, Hoebers F, Aerts HJ, Rietbergen MM, Brakenhoff RH, Leemans RC, et al. Externally validated HPV-based prognostic nomogram for oropharyngeal carcinoma patients yields more accurate predictions than TNM staging. Radiother Oncol 2014;113:324–30.
- Bentzen J, Toustrup K, Eriksen JG, Primdahl H, Andersen LJ, Overgaard J. Locally advanced head and neck cancer treated with accelerated radiotherapy, the hypoxic modifier nimorazole and weekly cisplatin. Results from the DAHANCA 18 phase II study. Acta Oncol 2015;54:1001–7.
- Ampil F, Chaudhery S, Devarakonda S, Mills G. Extended survival after chemotherapy and conservative radiotherapy for HPV-16 positive stage IVB oropharyngeal carcinoma. Acta Oncol 2013;52:1236–7.
- Hoeben BA, Starmans MH, Leijenaar RT, Dubois LJ, van der Kogel AJ, Kaanders JH, et al. Systematic analysis of 18F-FDG PET and metabolism, proliferation and hypoxia markers for classification of head and neck tumors. BMC Cancer 2014;14:130.
- Szentkuti G, Danos K, Brauswetter D, Kiszner G, Krenacs T, Csako L, et al. Correlations between prognosis and regional biomarker profiles in head and neck squamous cell carcinomas. Pathol Oncol Res 2015;21:643–50.
- De Ruyck K, Duprez F, Ferdinande L, Mbah C, Rios-Velazquez E, Hoebers F, et al. A let-7 microRNA polymorphism in the KRAS 3’-UTR is prognostic in oropharyngeal cancer. Cancer Epidemiol 2014;38:591–8.
- Gerlinger M, Rowan AJ, Horswell S, Larkin J, Endesfelder D, Gronroos E, et al. Intratumor heterogeneity and branched evolution revealed by multiregion sequencing. New Engl J Med 2012;366:883–92.
- Panth KM, Leijenaar RT, Carvalho S, Lieuwes NG, Yaromina A, Dubois L, et al. Is there a causal relationship between genetic changes and radiomics-based image features? An in vivo preclinical experiment with doxycycline inducible GADD34 tumor cells.. Radiother Oncol 2015. Available online 7 July 2015. DOI: 10.1016/j.radonc.2015.06.013
- Lambin P, Rios-Velazquez E, Leijenaar R, Carvalho S, van Stiphout RG, Granton P, et al. Radiomics: Extracting more information from medical images using advanced feature analysis. Eur J Cancer 2012;48:441–6.
- Kumar V, Gu Y, Basu S, Berglund A, Eschrich SA, Schabath MB, et al. Radiomics: The process and the challenges. Magn Reson Imaging 2012;30:1234–48.
- Lambin P, van Stiphout RG, Starmans MH, Rios-Velazquez E, Nalbantov G, Aerts HJ, et al. Predicting outcomes in radiation oncology – multifactorial decision support systems. Nat Rev Clin Oncol 2013;10:27–40.
- Rios Velazquez E, Aerts HJ, Gu Y, Goldgof DB, De Ruysscher D, Dekker A, et al. A semiautomatic CT-based ensemble segmentation of lung tumors: Comparison with oncologists’ delineations and with the surgical specimen. Radiother Oncol 2012;105:167–73.
- Parmar C, Rios Velazquez E, Leijenaar R, Jermoumi M, Carvalho S, Mak RH, et al. Robust radiomics feature quantification using semiautomatic volumetric segmentation. PLoS One 2014;9:e102107.
- Leijenaar RTH, Carvalho S, Velazquez ER, van Elmpt WJC, Parmar C, Hoekstra OS, et al. Stability of FDG-PET Radiomics features: An integrated analysis of test-retest and inter-observer variability. Acta Oncol 2013;52:1391–7.
- Balagurunathan Y, Kumar V, Gu Y, Kim J, Wang H, Liu Y, et al. Test-retest reproducibility analysis of lung CT image features. J Digit Imaging 2014;27:805–23.
- Galavis PE, Hollensen C, Jallow N, Paliwal B, Jeraj R. Variability of textural features in FDG PET images due to different acquisition modes and reconstruction parameters. Acta Oncol 2010;49:1012–6.
- Lambin P, Roelofs E, Reymen B, Velazquez ER, Buijsen J, Zegers CM, et al. ‘Rapid Learning health care in oncology’ – An approach towards decision support systems enabling customised radiotherapy’. Radiother Oncol 2013; 109:159–64.
- Rao SX, Lambregts DM, Schnerr RS, van Ommen W, van Nijnatten TJ, Martens MH, et al. Whole-liver CT texture analysis in colorectal cancer: Does the presence of liver metastases affect the texture of the remaining liver? United Eur Gastroenterol J 2014;2:530–8.
- Coroller TP, Grossmann P, Hou Y, Rios Velazquez E, Leijenaar RT, Hermann G, et al. CT-based radiomic signature predicts distant metastasis in lung adenocarcinoma. Radiother Oncol 2015;114:345–50.
- Balagurunathan Y, Gu Y, Wang H, Kumar V, Grove O, Hawkins S, et al. Reproducibility and prognosis of quantitative features extracted from CT images. Transl Oncol 2014;7:72–87.
- Fried DV, Tucker SL, Zhou S, Liao Z, Mawlawi O, Ibbott G, et al. Prognostic value and reproducibility of pretreatment CT texture features in stage III non-small cell lung cancer. Int J Radiat Oncol Biol Phys 2014;90:834–42.
- Ganeshan B, Panayiotou E, Burnand K, Dizdarevic S, Miles K. Tumour heterogeneity in non-small cell lung carcinoma assessed by CT texture analysis: A potential marker of survival. Eur Radiol 2012;22:796–802.
- Zhang H, Graham CM, Elci O, Griswold ME, Zhang X, Khan MA, et al. Locally advanced squamous cell carcinoma of the head and neck: CT texture and histogram analysis allow independent prediction of overall survival in patients treated with induction chemotherapy. Radiology 2013;269:801–9.
- Aerts HJWL, Velazquez ER, Leijenaar RTH, Parmar C, Grossmann P, Cavalho S, et al. Decoding tumour phenotype by noninvasive imaging using a quantitative radiomics approach. Nat Commun 2014;5:4006.
- Purohit BS, Ailianou A, Dulguerov N, Becker CD, Ratib O, Becker M. FDG-PET/CT pitfalls in oncological head and neck imaging. Insights Imaging 2014;5: 585–602.
- Royston P, Altman D. External validation of a Cox prognostic model: Principles and methods. BMC Med Res Methodol 2013;13:33.
- Zhao B, Tan Y, Tsai WY, Schwartz LH, Lu L. Exploring variability in CT characterization of tumors: A preliminary phantom study. Transl Oncol 2014;7:88–93.
- Buckler AJ, Bresolin L, Dunnick N R, Sullivan DC. A collaborative enterprise for multi-stakeholder participation in the advancement of quantitative imaging. Radiology 2011;258:906–14.
- Kurland BF, Gerstner ER, Mountz JM, Schwartz LH, Ryan CW, Graham MM, et al. Promise and pitfalls of quantitative imaging in oncology clinical trials. Magn Reson Imaging 2012;30:1301–12.
- Boas FE, Fleischmann D. CT artifacts: Causes and reduction techniques. Imaging Med 2012;4:229–40.
- Parmar C, Leijenaar RTH, Grossmann P, Rios Velazquez E, Bussink J, Rietveld D, et al. Radiomic feature clusters and Prognostic Signatures specific for Lung and Head & Neck cancer. Scientific reports 2015;5:11044; DOI: 10.1038/srep11044.