
ABSTRACT
Background. Dose painting by numbers (DPBN) is a method to deliver an inhomogeneous tumor dose voxel-by-voxel with a prescription based on biological medical images. However, planning of DPBN is not supported by commercial treatment planning systems (TPS) today. Here, a straightforward method for DPBN with a standard TPS is presented.
Material and methods. DPBN tumor dose prescription maps were generated from 18F-FDG-PET images applying a linear relationship between image voxel value and dose. An inverted DPBN prescription map was created and imported into a standard TPS where it was defined as a mock pre-treated dose. Using inverse optimization for the summed dose, a planned DPBN dose distribution was created. The procedure was tested in standard TPS for three different tumor cases; cervix, lung and head and neck. The treatment plans were compared to the prescribed DPBN dose distribution by three-dimensional (3D) gamma analysis and quality factors (QFs). Delivery of the DPBN plans was assessed with portal dosimetry (PD).
Results. Maximum tumor doses of 149%, 140% and 151% relative to the minimum tumor dose were prescribed for the cervix, lung and head and neck case, respectively. DPBN distributions were well achieved within the tumor whilst normal tissue doses were within constraints. Generally, high gamma pass rates (> 89% at 2%/2 mm) and low QFs (< 2.6%) were found. PD showed that all DPBN plans could be successfully delivered.
Conclusions. The presented methodology enables the use of currently available TPSs for DPBN planning and delivery and may therefore pave the way for clinical implementation.
Dose painting relies on the use of medical images that reflects radiobiological tumor properties [Citation1]. These images are used to prescribe an inhomogeneous tumor dose in order to increase the local control compared to conventional radiotherapy (RT) with a homogenous tumor dose. Two dose painting approaches exist: dose painting by contours (DPBC) and dose painting by numbers (DPBN) [Citation2,Citation3]. In DPBC the most aggressive sub-volume within the tumor is delineated and subsequently dose escalated to a homogenous dose, while in DPBN each tumor voxel is given a dose according to the voxel value in the corresponding biological image.
Several imaging modalities may provide the image basis for dose painting [Citation4–6], where 18F-FDG-PET is most relevant for several types of cancers. Studies show that high FDG uptake in the tumor prior to RT is associated with reduced survival for patients with lung cancer, head and neck cancer and locally advanced cervix cancer, among others [Citation7–10]. Furthermore, residual FDG uptake in the tumor after RT may be a negative prognostic factor. Moreover, in-field tumor recurrences typically occur in regions showing high FDG uptake prior to RT [Citation11,Citation12]. Finally, regions within the tumor with high FDG uptake appear to be spatially stable [Citation12]. These findings indicate that tumor regions with high FDG uptake are attractive targets for dose escalation.
It has been more than a decade since the concept of dose painting was first introduced. In spite of great interest, the approach has not gained widespread use clinically. One possible reason could be that the implementation of dose painting is technically complex, particularly for DPBN. To our knowledge, planning of true DPBN is not offered in standard versions of any commercial treatment planning system (TPS) today. The need for in-house developed planning systems or modifications in TPS research versions may be an obstacle for clinical implementation of DPBN. This issue is addressed in the present study by the introduction of a new method for DPBN planning in a standard TPS. The method is based on 18F-FDG PET images for dose prescription and the treatment plan summation option of standard TPS employing intensity modulation. It is shown that DPBN can be delivered in accordance with the FDG dose prescription for different cancer patient cases.
Material and methods
Patient and image data
To develop a method for DPBN, image data from three anatomically different cases with FDG-PET positive tumors were utilized. In all three cases, the patient had previously received treatment according to standard practice for their disease. Patient characteristics were as follows; one 64-year-old female with locally advanced cervical cancer FIGO stage 3b, a 67-year-old male with head and neck cancer of the tongue stage T4aN1M0 and a 64-year-old female with stage IV non-small cell lung cancer (NSCLC). As part of standard treatment planning, the primary tumor [gross tumor volume (GTV)], elective target areas and organs at risk (OARs) had been delineated by oncologists and nuclear medicine specialists. Primary tumor volumes were 80 cm3, 19 cm3, 101 cm3 for the cervix, head and neck and lung case, respectively. Pre-treatment 18F-FGD-PET images (Biograph, Siemens, Germany) were available with pixel size of 2.7 mm, 1.8 mm and 4.1 mm and slice thickness of 2.0 mm, 2.0 mm and 3.0 mm for the cervix, head and neck and lung case, respectively.
DPBN prescription and inverted dose maps
PET images, GTV contour and a standard TPS calculated DICOM dose file were imported into Interactive Data Language (IDL v8.2, ITT Visual Information Solutions, Boulder, CO, USA) for generation of 18F-FDG-based DPBN tumor prescription maps. The PET image slices were interpolated to a 2.0 mm pixel size to match the resolution of the TPS dose files.
A linear relationship between prescribed voxel dose Dv and PET image voxel value Iv was applied within the tumor defined by the GTV contour, similar to Vanderstraeten et al. [Citation13]:
Ilow and Ihigh were defined from the 2nd and 98th percentile of the FDG uptake in the tumor, respectively. This makes the DPBN prescription more robust against noise in the PET images. The maximum prescribed dose Dhigh, was adjusted to produce a fixed mean tumor dose Dmean, given a defined minimum dose, Dlow. In the current work, Dlow was equal to the planning target volume (PTV) dose prescription. Dmean was set to 120% of Dlow. By definition, Dlow and Dhigh will be prescribed to the 2% least and most intense PET voxels, respectively.
A three-dimensional (3D) dose prescription matrix was generated in IDL based on the framework outlined above. An inverted dose map was created by subtracting the original prescription matrix from the Dhigh. As a result, the inverted dose map values ranged from zero in voxels originally prescribed Dhigh to (Dhigh–Dlow) in voxels intended for the minimum dose, Dlow. Using the TPS DICOM dose file as a template, two dose files were created with appropriate patient-specific DICOM information, one containing the DPBN prescription and one the inverted prescription map. The inverted DPBN prescription file was to be used during VMAT optimization, while the dose prescription file was to be employed as a benchmark during planning.
Treatment planning
The inverted dose map was imported into Eclipse TPS (v.11, Varian Medical Systems, Palo Alto, CA, USA) and assigned to a mock treatment plan. The actual DPBN plan was created as volumetric modulated arc therapy (VMAT) using two 6 MV arcs from a Varian Clinac iX with a Millenium MLC. The inverse optimization was performed in dose summation mode, with the mock plan containing the inverted DPBN prescription defined as a pre-treated plan. Thus, by requesting a homogeneous summed dose of Dhigh to the GTV the TPS optimizer automatically strives to create the prescribed DPBN dose distribution within the tumor for the actual plan. For other target volumes and OARs, standard optimization was applied with normal treatment margins and dose-volume histogram (DVH) constraints. No additional target-derived volumes were necessary during optimization.
In this study, PTV doses of 45, 46 and 66 Gy were prescribed for the cervix, head and neck and lung case, respectively. For the head and neck case, sequential treatment was considered with the first series including both elective and primary areas while the second series includes the primary area alone. Here, dose painting was performed only in the first series. OARs considered during optimization were rectum, sigmoid, bladder, bowel and cauda equina for the cervix case, parotid glands, submandibular glands (SMG) and spinal cord for the head and neck case and left and right lung, spinal cord, esophagus, and trachea in the lung case.
Plan evaluation
The DPBN prescription map was compared to the corresponding planned DPBN tumor dose by 3D gamma analysis using the 3DVH® software (Sun Nuclear corporation, Melbourne, FL, USA). The software enabled direct dose comparisons within the GTV, with gamma acceptance criteria set to 2%/2 mm and 3%/3 mm.
In evaluation of the obtained DPBN tumor dose the quality factor (QF) [Citation14] was calculated. In computation of the QF, the quality index (Qi), is calculated for all tumor voxels i, as the ratio of the planned dose Dplan to the prescribed dose Dpres:
The treatment plans were delivered on a Varian Clinac iX and the generated fluence recorded by an electronic portal imaging device (EPID). Gamma analysis, comparing the delivered and planned fluence distribution using portal dosimetry (PD) verification (Varian Medical Systems) was performed. Again, 2%/2 mm and 3%/3 mm were selected as acceptance criteria in the gamma analysis.
Results
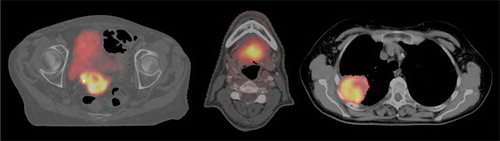
shows PET/CT images, illustrating patient anatomy and tumor FDG uptake for the three different cases. The standardized uptake value (SUV) were calculated for all voxels inside the GTV contour, and values (SUVmin, SUVmedian, SUVmax) of (1.2, 6.5, 16.3), (2.5, 7.1, 16.0) and (0.9, 9.7, 19.9) were found for the cervix, head and neck and lung case, respectively. The resulting PET voxel values (Ilow, Ihigh) relative to the max value was (13%, 86%), (20%, 90%) and (9%, 85%) in the DPBN prescription for the cervix, head and neck and lung case, respectively. The relative distribution of FDG uptake within the tumor then determined the maximum prescribed tumor dose Dhigh. For a Dmean fixed at 120% of Dlow, Dhigh values of 149%, 151% and 140% were prescribed in the cervix, head and neck and lung case, respectively.
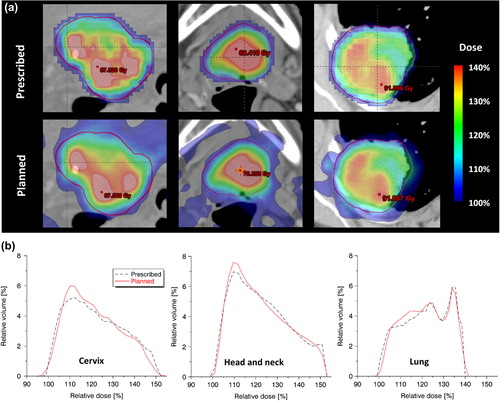
Implementation of the methodology and subsequent DPBN planning using a standard TPS was straightforward. For all three cases, the prescribed DPBN distribution was well obtained within the tumor. A visual comparison between the prescribed and planned tumor dose distribution is shown in . Differential DVHs also show good agreement between prescribed and planned dose distribution (). A slightly lower correspondence for the cervix case was observed compared to the two others.
Results from plan evaluation using 3D gamma analysis and computation of QF are presented in . In general, good agreement between the prescribed and planned dose distribution was found with QF values around 2% and gamma pass rates above 97% in all cases for the 3%/3 mm criteria. In line with what was qualitatively visible in , the cervix plan did not score as good as the two other cases. Results from PD verification comparing delivered to planned fluence, are listed in . According to this test, all DPBN plans could be successfully delivered.
Table I. (a) Comparison of prescribed and planned tumor dose distribution by 3D gamma analysis and the QF. (b) Comparison of planned to delivered dose using portal dosimetry (PD) verification, mean values for the two VMAT arcs presented.
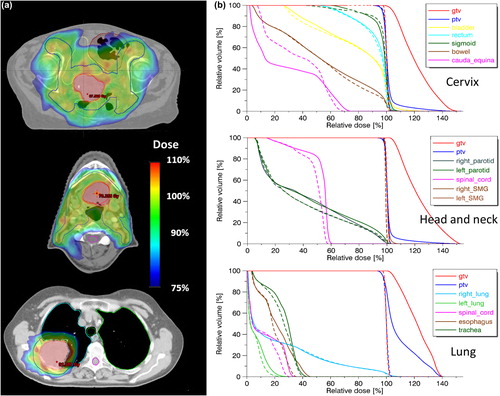
Whilst striving for a DPBN dose distribution within the GTV, adequate PTV coverage and OAR sparing was also crucial. Images showing examples of the overall dose distribution are displayed in . Sufficient PTV coverage with D98% > 95% was achieved in all three cases. OAR doses were assessed by comparison to standard homogeneous plans (). In general small differences in OAR doses were seen between the DPBN and standard plans, however, there were some dissimilarity. In the cervix case, bladder D2cc increased from 45.9 Gy to 50.4 Gy with DPBN. Also, bowel dose increased moderately for DPBN with a V45Gy of 130 cm3 compared to 101 cm3 in the standard plan. For the head and neck case, doses to the parotid glands differed slightly with mean doses being about 1.5 Gy higher in the DPBN plan. Also, Dmax for the spinal cord increased from 26.8 Gy to 28.6 Gy using DPBN. In the lung case, Dmax to esophagus increased from 23.8 Gy in the standard plan to 30.7 Gy in the DPBN plan. Lung doses however were very similar with the ipsilateral lung having a V20Gy of 21.0% in both plans.
Discussion
In this work, a new method for DPBN treatment planning was introduced. The methodology was tested in three cases with different anatomy and OARs for proof of principle. By importing inverted dose maps into a standard TPS, straightforward DPBN planning is possible without any modifications of the TPS. Implementation of the methodology was feasible and for all patient cases, prescribed, planned and delivered doses were highly similar.
Incorporation of the biological information from medical images into the plan optimization on the voxel level has been a practical challenge in DPBN and different approaches have been used. At Ghent University Hospital, modifications were made in the optimization tool and objective function in their in-house developed TPS to incorporate biological voxel-wise optimization [Citation14]. This solution was used in the clinical implementation of DPBN treatment [Citation15]. Similarly, the group at the University Hospital in Tübingen has utilized their HYPERION system for planning of hypoxia dose painting [Citation16]. Another approach has been to alter the objective function in the optimizer of the research version of a commercial TPS [Citation17,Citation18]. In a fourth approach, DPBC has been implemented with standard TPSs by creating several image based sub-volumes within the tumor, each with a separate dose prescription [Citation19,Citation20]. The methodology presented here, differs from previous methods as it enables users to perform true DPBN optimization in a standard version of a commercial TPS. The use of inverted dose maps and summed optimization drives the standard optimizer to minimize the quadratic difference between the planned and prescribed dose in each voxel. In our opinion, this solution overcomes some of the difficulties currently associated with planning of DPBN. However, the presented method for DPBN requires preparatory steps in separate software to create dose prescription and inverted dose map. Yet again, this should ensure compatibility with all planning systems supporting inverse optimization on summed plans. In addition to the Eclipse TPS, the method was verified in an Oncentra TPS (Version 4.3, Nucletron, an Elekta company, Veenendaal) (data not shown).
Since the concept of dose painting was introduced, most of the clinical implementation has been with the DPBC approach [Citation21]. In contrast to DPBN, DPBC can be implemented in a standard TPS as planning of dose escalation to biological target volume(s). In principle, this is similar to a normal simultaneously integrated boost. It may however be argued that the gradual dose escalation pursued in DPBN is a better approach than the discrete dose steps prescribed in DPBC. Plan studies comparing PET based DPBC to DPBN have also found that the latter allows for higher doses to the tumor with better fulfillment of the dose prescription [Citation16,Citation17]. Furthermore, DPBN is less sensitive to PET reconstruction parameters than a contour-based approach [Citation22].
The voxel-based DPBN dose distribution from medical images is generated without regard to physical, technical or anatomical constraints. The achievable tumor dose distribution will therefore be restricted by photon beam properties in addition to technical treatment unit specifications, such as MLC resolution [Citation19,Citation23]. In addition to technically limiting factors, patient-specific limitations, such as the anatomy and FDG uptake in the tumor, also plays a role. If the high-uptake tumor voxels are located close to critical organs, it may be difficult to achieve the prescribed tumor doses. Of the cases tested here, the cervix patient proved most challenging and performed not as good as the two others in the 3D gamma and QF evaluation. This may be explained by the location of the primary tumor close to the bladder () and by a spatially more heterogeneous FDG uptake leading to a dose prescription with steep dose gradients (). Regarding doses to OARs, dose painted treatment plans must be evaluated according to the same criteria as for traditional treatment plans.
We have in this study demonstrated the feasibility of a new method for DPBN planning and verified the delivery of the plans with PD. Clinical implementation of DPBN does however introduce further challenges from daily set up variations and anatomical and functional tumor changes during the course of treatment. If not accounted for, such variations will affect the dose distribution reducing the Qi and the intended additional tumor effect compared to a standard homogeneous tumor dose [Citation19,Citation23]. However, traditional treatment margins are not suited to ensure robustness to geometric uncertainties in voxel-by-voxel DPBN. Different strategies have been investigated to address this issue, one being the introduction of confidence-based probabilistic optimization [Citation18]. Another approach relies on dilation and deconvolution of the tumor dose prescription to account for systematic and random errors, respectively [Citation24]. The latter approach is compatible with the planning method introduced in this study and can be included to further develop the procedure.
The strategies discussed in the previous section might together with daily in-room imaging, deal with geometric setup errors also for DPBN. They will however, not solve the issue of varying patient anatomy and possible volumetric and functional tumor changes found during the course of treatment. In order to account for such effects, adaptation based upon biological imaging obtained during treatment is needed. 18F-FDG-PET-based adaptive dose painting have been tested in silico for NSCLC [Citation25] and implemented clinically for head and neck cancer. In the ARTFORCE phase II trial for treatment of head and neck cancer [Citation26], adaptive DPBC is conducted applying re-planning after two weeks of treatment. In Ghent, several adaptive DPBN strategies have been conducted for patients with head and neck cancer. In the first approach, two DPBN plans based on FDG-PET images acquired prior to and during RT and one standard IMRT plan were delivered sequentially during the six-week treatment course [Citation15]. Then, in their second approach, three-phase adaptive DPBN was carried out over the entire treatment [Citation27]. These adaptive treatment studies illustrates an increasing effort put into treatment planning in order to fully exploit the potential of dose painting, which motivates development of more efficient planning methods.
In conclusion, a straightforward method for planning of DPBN in a standard TPS has been presented in this study. The methodology reduces the complexity associated with implementation of DPBN with the potential of being valuable for further exploration and clinical implementation of this treatment concept.
Acknowledgments
This work was supported by a grant from the South-Eastern Norway Regional Health Authority.
Declaration of interest: The authors report no conflicts of interest. The authors alone are responsible for the content and writing of the paper.
References
- Ling CC, Humm J, Larson S, Amols H, Fuks Z, Leibel S, et al. Towards multidimensional radiotherapy (MD-CRT): Biological imaging and biological conformality. Int J Radiat Oncol Biol Phys 2000;47:551–60.
- Bentzen SM. Theragnostic imaging for radiation oncology: Dose-painting by numbers. Lancet Oncol 2005;6:112–7.
- Alber M, Paulsen F, Eschmann SM, Machulla HJ. On biologically conformal boost dose optimization. Phys Med Biol 2003;48:N31–5.
- Bentzen SM, Gregoire V. Molecular imaging-based dose painting: A novel paradigm for radiation therapy prescription. Semin Radiat Oncol 2011;21:101–10.
- Sovik A, Malinen E, Olsen DR. Strategies for biologic image-guided dose escalation: A review. Int J Radiat Oncol Biol Phys 2009;73:650–8.
- Thorwarth D, Geets X, Paiusco M. Physical radiotherapy treatment planning based on functional PET/CT data. Radiother Oncol 2010;96:317–24.
- Grigsby PW. The prognostic value of PET and PET/CT in cervical cancer. Cancer Imaging 2008;8:146–55.
- Borst GR, Belderbos JSA, Boellaard R, Comans EFI, De Jaeger K, Lammertsma AA, et al. Standardised FDG uptake: A prognostic factor for inoperable non-small cell lung cancer. Eur J Cancer 2005;41:1533–41.
- Allal AS, Slosman DO, Kebdani T, Allaoua M, Lehmann W, Dulguerov P. Prediction of outcome in head-and-neck cancer patients using the standardized uptake value of 2- F-18 fluoro-2-deoxy-D-glucose. Int J Radiat Oncol Biol Phys 2004;59:1295–300.
- Carvalho S, Leijenaar RTH, Velazquez ER, Oberije C, Parmar C, Van Elmpt W, et al. Prognostic value of metabolic metrics extracted from baseline positron emission tomography images in non-small cell lung cancer. Acta Oncol 2013;52:1398–404.
- Due AK, Vogelius IR, Aznar MC, Bentzen SM, Berthelsen AK, Korreman SS, et al. Recurrences after intensity modulated radiotherapy for head and neck squamous cell carcinoma more likely to originate from regions with high baseline 18F-FDG uptake. Radiother Oncol 2014;111:360–5.
- Aerts H, van Baardwijk AAW, Petit SF, Offermann C, van Loon J, Houben R, et al. Identification of residual metabolic-active areas within individual NSCLC tumours using a pre-radiotherapy (18)Fluorodeoxyglucose-PET-CT scan. Radiother Oncol 2009;91:386–92.
- Vanderstraeten B, Duthoy W, De Gersem W, De Neve W, Thierens H. F-18 fluoro-deoxy-glucose positron emission tomography (F-18 FDG-PET) voxel intensity-based intensity-modulated radiation therapy (IMRT) for head and neck cancer. Radiother Oncol 2006;79:249–58.
- Vanderstraeten B, De Gersem W, Duthoy W, De Neve W, Thierens H. Implementation of biologically conformal radiation therapy (BCRT) in an algorithmic segmentation-based inverse planning approach. Phys Med Biol 2006;51: N277–86.
- Duprez F, De Neve W, De Gersem W, Coghe M, Madani I. Adaptive dose painting by numbers for head-and-neck cancer. Int J Radiat Oncol Biol Phys 2011;80:1045–55.
- Thorwarth D, Eschmann SM, Paulsen F, Alber M. Hypoxia dose painting by numbers: A planning study. Int J Radiat Oncol Biol Phys 2007;68:291–300.
- Meijer G, Steenhuijsen J, Bal M, De Jaeger K, Schuring D, Theuws J. Dose painting by contours versus dose painting by numbers for stage II/III lung cancer: Practical implications of using a broad or sharp brush. Radiother Oncol 2011;100: 396–401.
- Witte M, Shakirin G, Houweling A, Peulen H, van Herk M. Dealing with geometric uncertainties in dose painting by numbers: Introducing the Delta VH. Radiother Oncol 2011;100:402–6.
- Korreman SS, Ulrich S, Bowen S, Deveau M, Bentzen SM, Jeraj R. Feasibility of dose painting using volumetric modulated arc optimization and delivery. Acta Oncol 2010;49: 964–71.
- Deveau MA, Bowen SR, Westerly DC, Jeraj R. Feasibility and sensitivity study of helical tomotherapy for dose painting plans. Acta Oncol. 2010;49:991–6.
- Shi XR, Meng X, Sun XD, Xing LG, Yu JM. PET/CT imaging-guided dose painting in radiation therapy. Cancer Lett 2014;355:169–75.
- Knudtsen IS, van Elmpt W, Ollers M, Malinen E. Impact of PET reconstruction algorithm and threshold on dose painting of non-small cell lung cancer. Radiother Oncol 2014;113:210–4.
- Rodal J, Sovik A, Malinen E. Influence of MLC leaf width on biologically adapted IMRT plans. Acta Oncol 2010;49:1116–23.
- Sterpin E, Differding S, Jansses G, Geets X, Gregoire V, Lee JA. Generation of prescriptions robust against geometric uncertainties in dose painting by numbers. Acta Oncol 2015;54:253–60.
- Feng M, Kong FM, Gross M, Fernando S, Hayman JA, Ten Haken RK. Using fluorodeoxyglucose positron emission tomography to assess tumor volume during radiotherapy for non-small-cell lung cancer and its potential impact on adaptive dose escalation and normal tissue sparing. Int J Radiat Oncol Biol Phys 2009;73:1228–34.
- Heukelom J, Hamming O, Bartelink H, Hoebers F, Giralt J, Herlestam T, et al. Adaptive and innovative Radiation Treatment FOR improving Cancer treatment outcomE (ARTFORCE); a randomized controlled phase II trial for individualized treatment of head and neck cancer. BMC Cancer 2013;13:84.
- Berwouts D, Olteanu LAM, Duprez F, Vercauteren T, De Gersem W, De Neve W, et al. Three-phase adaptive dose-painting-by-numbers for head-and-neck cancer: Initial results of the phase I clinical trial. Radiother Oncol 2013;107:310–6.