
ABSTRACT
Background. We investigated the possibility to early identify non-responding patients based on FDG-PET positive lymph nodes (PNs) volume variation assessed with in-room images.
Material and methods. Twenty-seven head and neck cancer patients with at least one pre-treatment PNs were retrospectively analyzed; they received 54 Gy, 66 Gy, 69 Gy in 30 fractions on precautionary lymph nodal (N), primary (T) and PET positive (BTV) planning target volumes (PTVs), respectively with Helical TomoTherapy (SIB approach). PNs volume changes during treatment were assessed based on megavoltage computed tomography (MVCT) used for image guidance as ratio between volumes at fractions 10/20/30 and at first fraction. Data on T, N and M relapses (rT, rN, rM) were collected for all patients. The difference of PNs volume changes, during treatment, between patients with versus without relapses was tested (Mann-Whitney test). The impact of shrinkage on the corresponding survival curves (Cox proportional-hazard regression), dividing between no/moderate versus large shrinkage (based on ROC curve best cut-off value) was also investigated.
Results. Median follow-up was 27.4 m (3.7–108.9). The numbers for rT, rN, rM were 5, 4, 6, respectively. Differences in PNs shrinkage were found between patients with and without rT/rN at all considered timing [fr 20, rT: 0.56 vs. 1.07 (median), p = 0.06; rN: 0.57 vs. 1.25, p = 0.07]. Differences were lower for rM. Survival curves provide high hazard ratios (HR) between PNs changes and rT/rN at all considered timing [fr 20, rT: best cut-off = 0.58, HR 5.1 (95% CI 0.5–49.4), p = 0.12; rN: best cut-off = 0.98, HR 14.9 (1.6–142.9), p = 0.01].
Conclusion. A limited shrinkage of PNs during treatment is associated with poorer outcome in terms of T/N relapses. The early variation of PNs observed on in-room images may provide useful information about the individual response with potential application in guiding an early adaptation of the treatment.
For locally advanced head and neck cancer (HNC) patients, improvement in (chemo) radiotherapy (RT) treatment techniques allowed to increase disease control without increasing toxicity [Citation1]. Nevertheless, the risk of loco-regional relapse is still a major cause of failure in HNC patients treated with radical RT with/without chemotherapy [Citation2]. Thanks to an earlier detection of tumor and to the improved therapeutic approaches, the increased life expectancy focused the importance of long-term treatment outcome also in terms of recurrences. Therefore the possibility to early detect patients with more resistant diseases would give a great advantage in cancer management [Citation3].
Meanwhile, the progress of functional imaging continuously improved over years increasing the possibility of individually assessing a number of tumor characteristics and to selectively detect specific tumor subvolume regions [Citation4]. For instance, a larger pre-RT 18FDG-PET positive subvolume regions [gross tumor volume positron emission tomography (GTV PET)] was demonstrated to be associated to a higher probability of local relapse, suggesting that a dose escalation on GTV PET could have a positive impact [Citation5,Citation6]. Taking advantage of highly tailored dose distributions to different target shapes achievable with image-guided Helical TomoTherapy (Accuray Inc., Sunnyvale, CA, USA), a simultaneous integrated boost (SIB) protocol incorporating a concomitant boost on GTV PET was activated in 2005 [Citation7].
It is also well known that large neck deformations are observed during the treatment, also involving the tumor and the positive lymph nodes (PNs) [Citation8], underlining a potential risk of missing the target and suggesting the potential benefit of adaptive replanning. However, we characterized PNs volume variations in a previous study and concluded that treatment adaptation to avoid the missing of PNs is rarely justified when a 5 mm PTV margin is used [Citation9].
In-room images daily acquired for image-guidance may also provide continuous information of patient-specific treatment response. In this prospective, image-guided radiotherapy (IGRT) are a promising tool providing biomarkers that may help to identify patients with higher risk of relapse and, based on this information, allowing adaptive strategies [Citation10,Citation11]. However, the use of IGRT-extracted biological features into clinical workflows is immature and the development of robust strategies incorporating individual image-based information into clinically suitable approaches is still required [Citation12].
Few examples have been reported up to date, such as the recent demonstration of the possibility to predict treatment outcome in non-small cell lung cancer based on tumor volume reduction observed on in-room cone beam computed tomography (CBCT) images acquired during RT [Citation13]. For HNC treated with intensity-modulated radiation therapy (IMRT), the predictive power of changes in PET-positive areas assessed during (chemo)RT treatment was reported in both animal [Citation14] and human [Citation15] studies. In the specific case of PNs changes, megavoltage computed tomography (MVCT) were found to have sufficient quality to quantify their shrinkage that could be used as a direct measurement of the response of the tumor cells to radiation [Citation9,Citation16]; from here the idea to search if any correlation exists between PNs shrinkage assessed by MVCT and the clinical outcome of a group of patients submitted to our GTV PET dose escalation protocol [Citation7].
Aims of current study were therefore:
to investigate the correlation between PNs variation during treatment at different timing point, in order to be able to early identify patients with higher failure risk;
to evaluate the impact on relapse-free survival curves, in order to use this information to guide an adaptation of treatment in the future.
Material and methods
Data of 37 HNC patients treated with IMRT ± chemotherapy between 2006 and 2013 were retrospectively analyzed. Each patient signed-in an informed consent for treatment agreement and anonymous publication of disease-related information for scientific investigations. Disease staging was performed based on American Joint Committee on Cancer (AJCC) criteria guidelines [Citation17].
Eligibility criteria study inclusion were: no previous surgery, pre-RT 18FDG-PET imaging available with at least one PN, N2/N3 staging [Citation18], availability of daily MVCT images, outcome data available with a minimum follow-up of three months after the end of RT.
Seven patients were excluded because PNs were small and poorly visible on MVCTs (volume ≤ 0.5 cm3); three patients were excluded because of death during (one patient) or early after (two patients, one month after) RT end. Therefore, a total of 27 patients were available for the analysis.
Regarding planning CT, all images were acquired on a PET-CT scanner (Discovery STE scanner, General Electric Medical Systems, Milwaukee, WI, USA), with the patients immobilized in RT treatment position using a thermoplastic mask including shoulders. CT images were acquired in helical mode, with 3 mm slice thickness and without contrast agent injection. FDG-PET 3D images were acquired with 2.5 min for each bed position, and a scatter and noise correction was introduced. CT map was also used as an attenuation correction.
Primary tumor (T) and precautionary lymph node region (N) were delineated on planning PET-CT based on RTOG guidelines [Citation19], while PET positive volume was delineated by two expert nuclear medicine physicians based on SUV map using the 40%-SUVmax threshold [Citation20] defining T and PN PET positive subvolumes. Corresponding PTVs were generated with a 5 mm expansion from CTV volumes, in accordance with our clinical protocol [Citation21].
All patients were treated with Helical TomoTherapy (HiArt 2, Accuray Inc.). Taking advantage of the characteristics of the TomoTherapy machine and based on the rationale that HN FDG-positive volumes could represent the most resistant/active part of the tumor [Citation5,Citation16], a boost approach on GTV PET was followed in our treatment protocols [Citation21]. All patients were treated with a SIB approach delivering 54 Gy (1.8 Gy/fr), 66 Gy (2.2 Gy/fr) and 69 Gy (2.3 Gy/fr) in 30 fractions on PTV-N, PTV-T and GTV PET volumes, respectively. All patients but two completed the treatment; one ended at the 27th fraction, and another at the 28th. Nine patients had short interruptions during treatment of maximum 10 days for toxicity problems (range 2–10). summarizes the main patient's characteristics.
Table I. Main patient and tumor characteristics.
PNs were delineated on planning CT (pl_CT) and MVCTs acquired for IGRT guidance (4 mm slice thickness, normal mode); MVCTs at fraction 1, 10, 20, 30 were considered. Rigid registration was performed between pl_CT and all MVCTs based first on bony anatomy and then with manual adjustments maximizing the agreement between planning and treatment images within the volume where T was located (mimicking the clinical procedure for matching pl_CT and MVCT). All registrations and delineation were performed in Eclipse system using the mutual information algorithm (v.8.6, Varian, Palo Alto, CA, USA). For each patient, all PNs were delineated by the same radiation oncologist, in order to avoid any inter-observer variability. A total of 36 PNs were delineated: one PN for 20 patients, two PNs for five patients and three PNs for two patients.
PN variation during treatment was assessed as ratio between volume at different timing (fr 10, 20 and end of treatment) and the volume at the beginning of treatment (fr 1). Absolute volume variation was also investigated, as difference between volume at different timing minus volume at fraction 1. The volume variation at the end of therapy was named, for simplicity, fraction 30 (although two patients ended before fr 30). When > 1 PNs were delineated for a single patient, the mean value of volume variation was considered.
Follow-up information was recorded for all patients after treatment ending. All information regarding disease-specific status (i.e. relapses) were recorded for all patients but one.
The correlation between PNs changes and T, N and metastatic relapses (rT, rN, rM) was investigated.
First, the difference of volume at the beginning of treatment between patients with versus without relapses was tested (Mann-Whitney test). The difference of volume variation between groups of patients with versus without relapse (rT, rN, rM) was tested at different timing (i.e. fr 10, 20, 30; Mann-Whitney test).
Then, the impact of shrinkage on the corresponding survival curves was investigated. Receiver operating characteristic (ROC) curves were used to assess the best cut-off value of PNs variation ad different timing during treatment (i.e. fr 10,20, 30) for different end-points (i.e. rT, rN and rM): this procedure assessed the boundary between no/moderate versus largely shrinking PNs that better discriminates patients with versus without relapse. The impact of the best cut-off values of PNs shrinkage on outcome was then tested by a Cox proportional-hazard regression.
For all statistical analysis, p-values were considered significant if < 0.05; due to the limited number of patients, the results of borderline p-value significance (p-value between 0.05 and 0.10) were also reported.
Results
Median follow-up was 27.4 months (3.7–108.9). Relapse T, N and M was observed for 5/26 (19%), 4/26 (15%) and 6/26 patients (23%), respectively.
The volume at the beginning of treatment (fr 1) results were not significantly different between patients with versus without T and M relapses, with only a border line p-value for N relapse [rN: 3.61 (1.66–4.98) vs. 0.86 (0.60–1.45) (median volume (interquartile range), p-value 0.08, Mann-Whitney test)]. Interestingly, the patients experiencing relapse showed smaller volumes than the ones without relapse.
PNs volume variation at fraction 10 and 20 resulted to be roughly doubled in those patients who underwent T or N relapses compared to patients that did not [fr 20–rT: 0.56 (0.43–0.74) vs. 1.07 (0.58–1.52) (median normalized volume (interquartile range)); rN: 0.57 (0.43–0.72) vs. 1.25 (0.75–1.60)] (, Mann-Whitney test). The differences were smaller when considering volumes at the end of therapy. A lower significance level was found when considering absolute volume variations (Mann-Whitney test, data not shown).
Table II. Difference of PET positive volume variation between patient without (group 1) versus with (group 2) relapses in primary tumor (T), lymph node (N) or metastatic (M) location at different timing during treatment (i.e. fraction 10, 20, end of treatment). Mann-Whitney test (*p < 0.10) was used and volumes at different timing were normalized to volume at beginning of treatment (i.e. 1st fraction).
Frequency distribution of PNs volumes at different timing shows the increase of relapses for patients with no/moderate, or even increasing PNs (). ROC curves were used in order to derive best cut-off values for different end-points at all considered timing (). At fraction 10 and 20, higher hazard ratios (HR) were found for rT and rN (, ): patients with PNs shrinkage at the beginning or mid-treatment (i.e. fr 10 and 20) showed a much lower risk to experience rT or rN compared to patients with no/moderate PNs reduction (HR 6.0 and 6.8, respectively, at fr 10; HR 5.2 and 14.9, respectively, at fr 20, p-values ranging between 0.01 and 0.12). The impact of the shrinkage on rM was smaller (p ≥ 0.16).
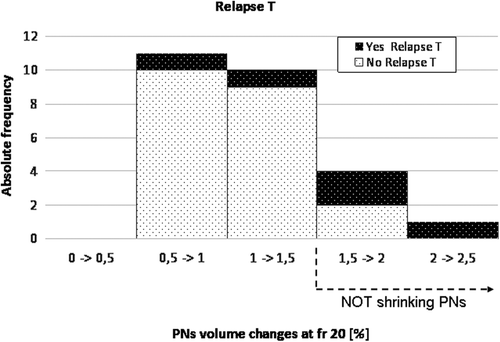
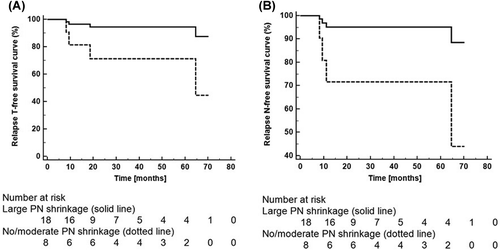
Table III. Actuarial analysis of primary tumor (T), lymph node (N) and metastatic (M) recurrences at different timing during treatment (i.e. fraction 10, 20, end of treatment). Patients were divided based on ROC curve best cut-off values evaluated for all different recurrences and timing. Hazard ratios (HR, 95% confidential interval) and p-value (*p < 0.10; **p < 0.05) of Cox proportional actuarial analysis are also reported.
The impact of PNs variation at the end of treatment on relapse-free survival curves was significant for all considered end-points [rT: HZ 6.5 (95% CI 0.7–61.3, p = 0.08; rN: HZ 19.6 (2.0–191.0), p = 0.01; rM: HZ 11.9 (1.7–84.4), p = 0.01].
Discussion
The difference of volume at the beginning of treatment between patients with versus without T, N and M relapse resulted to be not significant. However, a limited PNs shrinkage during treatment (or its absence) was mostly observed in patients that experienced a T and/or N failure; patients undergoing rT or rN experienced a reduced/no PNs shrinkage also during the early treatment phase (i.e. fr 10 and 20). Higher HRs were obtained by dividing patients on best cut-off values of PNs volume variation, resulting in an about 5–6-fold risk to undergo a T failure for patients with shrinking PNs at fraction 10 and 20 compared to the patients under controls. Best cut-off values at fraction 10 and 20 identify patients with no shrinking or even expanding PNs as critical group with higher risk of T and N recurrence (fr 10, for rT and rN = 1.05; fr 20, rT = 0.58, rN = 0.98).
Our analysis suggests that, based on an early variation of PNs during the first 2–4 weeks, it should be possible to identify patients with higher risk to undergo treatment failure in terms of T or N relapse. The obtained results suggest that PN volume variation observed during treatment well describe the individual patient biological response to RT treatment, whereas the initial volume do not provide such information; very interestingly, there is a trend showing that patients with relapses have a smaller initial volume. The great advantage of the method is the possibility to use images already routinely acquired for RT image guidance and to be able to daily monitor the response. In a previous work [Citation9] we investigated the robustness of PNs delineation on MVCT images, in terms of inter- and intra-observer variability and demonstrated their utility in assessing the impact of PNs changes on the risk of missing them during image-guided tomotherapy.
The main weakness of current study is the limited number of patients, often resulting in p-values of borderline significance.
Another important limitation concerns the lack of information regarding the HPV status that could not be included in this retrospective analysis. HNC patients with HPV± status are known to undergo different behavior during (chemo)RT. The impact of different patterns of the shrinkage of cervical lymph nodes for HPV± patients was demonstrated to predict different treatment outcome in terms of both local control and overall survival [Citation16]. The combination of volume variation during treatment and HPV status may yield to a still higher capability to identify patients with a greater risk of treatment failure.
In addition to staging, pre-treatment T volume was also found to be a predictive factor for local control in (chemo)RT HNC patients [Citation22]. Nevertheless the observed large variance in treatment outcome among patients could not be completely described based on pre-treatment staging and volume information alone [Citation23]. The need of factors able to describe patient-specific radio sensibility is emerging, and molecular as well as genetic investigations are of paramount importance [Citation24]. Factors that have been accepted as predictive parameters for local recurrences in HNC patients (i.e. hypoxia, intrinsic radiosensitivity, repopulation rate), are still difficult to be assessed in most clinical settings, and the proposed surrogates are still lacking of predictive power [Citation24].
Pre-treatment 18FDG-PET positive areas are also reported to correlate with local control [Citation5,Citation6]. The combined information of pre-treatment T volume and 18FDG-PET positive extension may provide useful information, but do not describe the patient-specific response to treatment.
In conclusion, although on a limited sample, our study suggests that early FDG-PET PN volume variation as assessed by in-room images during RT is a good candidate to become an useful biomarker of treatment outcome; it could find important applications in the development of rational adaptive strategies based on early response to RT.
Declaration of interest: The authors report no conflicts of interest. The authors alone are responsible for the content and writing of the paper.
References
- Broggi S, Perna L, Bonsignore F, Rinaldin G, Fiorino C, Chiara A, et al. Static and rotational intensity modulated techniques for head-neck cancer radiotherapy: A planning comparison. Phys Med 2014;30:973–9.
- Daly ME, Lieskovsky Y, Pawlicki T, Yau J, Pinto H, Kaplan M, et al. Evaluation of patterns of failure and subjective salivary function in patients treated with intensity modulated radiotherapy for head and neck squamous cell carcinoma. Head Neck 2007;29:211–20.
- Aziz NM. Cancer survivorship research: State of knowledge, challenges and Opportunities. Acta Oncol 2007;46:417–32.
- Hoeben BAW, Starmans MHW, Leijenaar RTH, Dubois LJ, van der Kogel A, Kaanders JH, et al. Systematic analysis of 18F-FDG PET and metabolism, proliferation and hypoxia markers for classification of head and neck tumors. BMC Cancer 2014;14:130.
- Picchio M, Kirienko M, Mapelli P, Dell’Oca I, Villa E, Gallivanone F, et al. Predictive value of pre-therapy 18F-FDG PET/CT for the outcome of 18F-FDG PET-guided radiotherapy in patients with head and neck cancer. Eur J Nucl Med Mol Imaging 2014;41:21–31.
- Due AK, Vogelius IR, Aznar MC, Bentzen SM, Berthelsen AK, Korreman SS, et al. Recurrences after intensity modulated radiotherapy for head and neck squamous cell carcinoma more likely to originate from regions with high baseline [18F]-FDG uptake. Radiother Oncol 2014;111:360–5.
- Fiorino C, Dell’Oca I, Pierelli A, Borggi S, De Martin E, Di Muzio N, et al. Significant improvement in normal tissue sparing and target coverage for head and neck cancer by means of helical tomotherapy. Radiother Oncol 2006;78:276–82.
- Barker JL, Garden AS, Ang KK, O’Daniel JC, Wang H, Court LE, et al. Quantification of volumetric and geometric changes occurring during fractionated radiotherapy for head-and-neck cancer using an integrated CT/linear accelerator system. Int J Radiat Oncol Biol Phys 2004; 59:960–70.
- Belli ML, Zerbetto F, Raso R, Chiara A, Cattaneo GM, Di Muzio N, et al. Characterization of volume and shape modifications of PET-positive nodes during Tomotherapy for head and neck cancer as assessed by MVCTs. Radiother Oncol 2015;115:50–5.
- Salma KJ, Sinae K, Syed AH, Xiaoting X, Alson W, Sujani S, et al. Reduction in tumor volume by cone beam computed tomography predicts overall survival in non-small cell lung cancer treated with chemoradiation therapy. Int J Radiat Oncol Biol Phys 2015;92:627–33.
- Baumann M, Hölscher T, Zips D. The future of IGRT – cost benefit analysis. Acta Oncol 2008;47:1188–92.
- Grau C, Olsen DR, Overgaard J, Høyer M, Lindegaard JC, Muren LP. Biology-guided adaptive radiation therapy – presence or future? Acta Oncol 2010;49:884–7.
- Grau C, Høyer M, Alber M, Overgaard J, Lindegaard JC, Muren LP. Biology-guided adaptive radiotherapy (BiGART) – more than a vision? Acta Oncol 2013;52:1243–7.
- Rødal J, Rusten E, Søvik Å, Skogmo HK, Malinen E. Functional imaging to monitor vascular and metabolic response in canine head and neck tumors during fractionated radiotherapy. Acta Oncol 2013;52:1293–9.
- Hoeben BAW, Bussink J, Troost EGC, Oyen WJG, Kaanders JHAM. Molecular PET imaging for biology-guided adaptive radiotherapy of head and neck cancer. Acta Oncol 2013;52:1257–71.
- Huang SH, O’Sullivan B, Xu W, Zhao H, Chen D-D, Ringash J, et al. Temporal nodal regression and regional control after primary radiation therapy for N2-N3 head-and-neck cancer stratified by HPV status. Int J Radiat Oncol Biol Phys 2013;87:1078–85.
- Edge SB, Compton CC. The American Joint Committee on Cancer: The 7th edition of the AJCC cancer staging manual and the future of TNM. Ann Surg Oncol 2010;17:1471–4.
- Sobin LH, Gospodarowicz MK, Wittekind CH, editors. TNM classification of malignant tumors, 7th ed. Oxford: Wiley-Blackwell; 2009.
- Mourad WF, Hu KS, Harrison LB. Cranial nerves IX–XII contouring atlas for head and neck cancer: Cranial nerves atlas. RTOG (Radiation Therapy Oncology Group), available at link: http://www.rtog.org/CoreLab/ContouringAtlases/HNAtlases.aspx
- Lee JA. Segmentation of positron emission tomography images: Some recommendations for target delineation in radiation oncology. Radiother Oncol 2010;96:302–7.
- Fiorino C, Dell’Oca I, Pierelli A, Brogli S, Cattaneo GM, Chiara A, et al. Simultaneous integrated boost (SIB) for nasopharynx cancer with Helical Tomotherapy. Strahlenther Onkol 2007;183:497–505.
- van den Broek GB, Rasch CR, Pameijer FA, Peter E, van den Brekel MW, , et al. Pretreatment probability model for predicting outcome after intraarterial chemoradiation for advanced head and neck carcinoma. Cancer 2004;101: 1809–17.
- Nathu RM, Mancuso AA, Zhu TC, Mendenhall WM. The impact of primary tumor volume on local control for oropharyngeal squamous cell carcinoma treated with radiotherapy. Head Neck 2000;22:1–5.
- Begg AC. Predicting recurrence after radiotherapy in head and neck cancer. Semin Radiat Oncol 2012;22(2):108–18.