
ABSTRACT
Background. There is an exciting complementarity between the spatial resolution provided by molecular imaging of a single, often unspecific, biomarker on one hand and the more detailed biological profile achievable from a diagnostic biopsy using a panel of immunohistochemical (IHC) markers on the other. A number of previous studies have shown a relationship between glucose transport protein expression and 18F-Fludeoxyglucose (FDG) PET uptake. Here, FDG uptake is analyzed in relation to expression of a selected panel of IHC cancer biomarkers in head and neck squamous cell carcinomas (HNSCC).
Material and methods. IHC staining for Bcl-2, β-tubulin-1 and 2, p53, EGFR, Ki-67, glutathione-S-transferase-π and p16 was performed on formalin-fixed paraffin embedded diagnostic biopsies from 102 HNSCC cases treated at Rigshospitalet during 2005–2009. The proportion of positive cells was used for analyses, except p16, which was scored according to EORTC guidelines. In all cases, maximal FDG standardized uptake value (SUV) metrics were extracted for the primary tumor, TSUVmax. Univariate linear regression and multiple linear regression of TSUVmax versus IHC markers were performed.
Results. In univariate analyses, TSUVmax showed negative associations with Bcl-2 (p = 0.002) and p16 (p = 0.005) indices and positive association with β-tubulin-1 index (p = 0.003). On multivariate analysis, TSUVmax remained associated with β-tubulin-1 (p = 0.009), Bcl-2 (p = 0.03) and p16 (p = 0.03). All correlations had r-squared < 0.3.
Conclusion. Statistically significant correlations were observed between the expression of IHC biomarkers and maximum FDG uptake in the primary tumor.
Numerous studies have shown a relationship between glucose transport protein expression and 18F- Fludeoxyglucose (FDG) uptake on positron emission tomography (PET). However, the relationship between other cancer-related immunohistochemical (IHC) biomarkers and FDG PET uptake is an interesting research subject in itself, as the spatial information from the imaging provides an interesting complement to the in-depth, but spatially unresolved, information attained from IHC analysis of a small tumor sample. Here, functional imaging in the form of FDG uptake on PET, is studied as a function of IHC cancer biomarker expression in head and neck squamous cell carcinomas (HNSCC). Associations between biomarker expressions on IHC and functional imaging could potentially lead to spatially resolved tumor phenotyping or alternatively assist in interpreting the biological significance of the functional imaging data.
The purpose of this study is to investigate the relationship between two prognostic models, one based on FDG uptake in the tumor as measured by the maximum tumor standardized uptake value (TSUVmax) [Citation1] and one based on an IHC-profile [Citation2,Citation3] in head and neck cancer patients treated with definitive radiotherapy. These two models have similar prognostic performance.
The selection of IHC biomarkers, p53, Bcl-2, glutathione S-transferase-π, β-tubulin-1 and β- tubulin-2 is based on the work of Prof. Cullen et al. [Citation2,Citation3] and not based on a mechanistic hypothesis of FDG-uptake. We have supplemented the IHC profile created by Cullen et al by EGFR, Ki-67 and p16. The goal is to improve the prognostic models by adding data from one to the other. In the long term we hope to create a predictive model that can tell which patients are going to fail, and their most probable failure site.
IHC markers
p53 is a transcription factor that regulates cell cycle progression and apoptosis [Citation4]. p53 arrests cycling cells in the G1-phase, allowing DNA-damage repair, or if the DNA-damage is irreparable p53 may induce apoptosis [Citation5]. Functional inactivation of p53 causes cells with DNA defects to bypass repair or apoptosis steps, which will result in genetic instability and lead to accumulation of mutations [Citation6].
Bcl-2 is an antiapoptotic molecule [Citation4] that binds to two proapoptotic molecules, Bax and Bak, thereby inhibiting them. Bax and Bak are located in the outer membrane of the mitochondrion. Un-inhibited Bax and Bak will cause disruption of the mitochondrias outer membrane, causing release of proapoptotic molecules including cytochrome c. These proapoptotic molecules will cause multiple cellular changes leading to apoptosis [Citation7].
Glutathione S-transferase-π (GST-π) is a class of enzymes involved in non-enzymatic detoxification of reactive oxygen species in the cell. The enzyme is essential for cell survival and redox homeostasis [Citation8]. It plays an essential role in proliferation-, apoptosis- and inflammatory response signaling cascades [Citation9]. Elevated levels of GST-π are associated with poorly differentiated tumors in HNSCC.
Microtubules in humans are composed of eight isotypes of α-tubulin and seven isotypes of β- tubulin. The isotypes are tissue-specific [Citation10]. Six subtypes of β-tubulin are identified, class I and IVb are constitutively expressed in all tissues, class III, IVa and II are primarily expressed in the brain and at low levels in other tissues [Citation11]. Cytoplasmic expression of β-tubulin was found to be an adverse prognostic marker of by Cullen's group [2,3 and unpublished data].
p16INK4a is used as a surrogate marker of human papilloma virus (HPV) infection in oropharyngeal squamous cell carcinoma [Citation5,Citation12] and has important prognostic value. The cyclin-dependent kinase inhibitor p16 is upregulated by E7, one of several viral proteins expressed in the presence of HPV-infection. E7 inactivates the tumor suppressor gene product retinoblastoma protein (pRb), forcing the cell into the S-phase of the cell cycle, bypassing the normal regulatory functions, leading to proliferation and malignant transformation.
Ki-67 is a nuclear protein, associated with cycling cells. It is an important marker of tumor growth [Citation13].
The transmembrane tyrosine kinase receptor epidermal growth factor receptor (EGFR) is involved in an intracellular signaling cascade causing proliferation by ligation of its natural ligand, transforming growth factor-α. EGFR is highly expressed in most HNSCC and overexpression is associated with poor survival and local control in HNSCC patients [Citation14,Citation15].
Material and methods
The overall patient cohort has been described recently [Citation1,Citation16]. The patients included in the present retrospective study were a subpopulation consisting of patients diagnosed and treated at Rigshospitalet during the period January 2005–October 2009. In all cases, the maximum SUV of FDG in the primary tumor was denoted TSUVmax and extracted from a PET/computed tomography (CT) scan performed as a part of the dose planning process as described in detail in [Citation1]. The scanners had similar resolution and voxel size in the reconstructed images.
The analyzed patient population consisted of 142 consecutive patients treated with curatively intended intensity modulated radiotherapy (IMRT) for HNSCC (Supplementary Figure 1, to be found online at http://informahealthcare.com/doi/abs/10.3109/0284186X.2015.1062539). Forty patients had missing formalin-fixed paraffin embedded (FFPE) blocks or insufficient tumor material for coring. The remaining 102 FFPE-blocks were marked for tissue microarray (TMA) construction. The patient characteristics are shown in Supplementary Table I, to be found online at http://informahealthcare.com/doi/abs/10.3109/0284186X.2015.1062539). Six patients did not have data on TSUVmax. During the IHC process some cores were lost, curled up on the glass, or were completely used up cutting through the sparse tissue. Consequently, the number of patients with a specific immunostain varies as indicated in Supplementary Figure 1 to be found online at http://informahealthcare.com/doi/abs/10.3109/0284186X.2015.1062539.
A subset of 11 patients had no pathological FDG uptake, nine of these had their tumor located in the oropharynx.
The study was approved by the Capital Regional Committee on Health Research Ethics (ID: H-2-2013-122) as well as the Data Protection Authority (Journal nr. 30-1129).
IHC staining for Bcl-2, β-tubulin-1 and 2, p53, GST-π and p16 was performed on FFPE diagnostic biopsies from 102 cases from this series. Pre-treatment FFPE diagnostic tumor tissue biopsies were retrieved. Hematoxylin and eosin (H&E) stained glass slides were re-evaluated for relevant tumor tissue by one of the authors (GBR) and validated by another author (MHT). Patients with archived diagnostic FFPE-tissue blocks with sufficient tissue to allow TMA punch outs were included in this study.
TMA-blocks consisted of single 2 mm diameter cores punched out from the original diagnostic FFPE blocks by an experienced histotechnician at the department of Pathology, Rigshospitalet using an automatic TMA Master (3D Histech Kft., Budapest, Hungary). The cores were embedded in recipient paraffin blocks. For later alignment of the TMA blocks and of the immunostained slices, cores of lung and liver tissue from completely anonymized donors were embedded in the recipient block as well.
Five micrometer sections were cut from the TMA block and mounted on positively charged glass slides by an experienced histotechnician. They were set to air dry overnight. Afterwards the slides were incubated for 60 minutes (Thermo Scientific section dryer) at 60°C. The slices from the pilot run (the first produced TMA) were only dried 10 minutes at 55°C.
Automated IHC stains were performed according to routine guidelines of Department of Pathology, University of Maryland School of Medicine (UMSOM), Baltimore and Department of Pathology, Rigshospitalet (RH), Copenhagen.
TMA sections were stained for Bcl-2, p53 and p16 in the Department of Pathology, UMSOM. The first of the consecutive TMA slices from each TMA block were stained with H&E using a Tissue Tek Prism Autostainer (Sakura Finetek USA, Inc., Torrance, CA, USA) for validation.
Stains were performed on a fully automated IHC-stainer, the Leica Bond III instrument (Leica Microsystems GmbH, Wetzlar, Germany). Consecutive slides were stained for Bcl-2 (clone: bcl-2/100/D5, Leica Biosystems, Newcastle, UK), p53 (clone: DO-7, Leica Biosystems), and p16 (clone E6H4, Ventana Medical Systems, Inc. Tucson, AZ, USA) using primary antibodies, according to the manufacturers’ protocols. Relevant control tissues were stained in the same run of the machine (p53: serous cell carcinoma; Bcl-2: tonsil and spleen; p16: known p16-positive cervix). The control tissues were cut, mounted on glass and air dried. Afterwards they were stored at − 70°C. They were retrieved from the freezer and incubated at 75.2°C for 15 minutes, before being stained with the TMAs.
Deparaffinization was performed uniformly, using Bond TM dewax solution (Leica Biosystems). Afterwards, antigen retrieval procedures were performed according to the manufacturer's protocols using heat-induced epitope retrieval (HIER) with ER2 for 20 minutes (p16 and p53) and HIER with ER1 for 30 minutes (Bcl-2), respectively. The slides were counterstained with hematoxylin.
Manual immunohistochemistry was performed for the GST-π (clone LW29, Leica Biosystems) and β-tubulin-1 and β-tubulin-2 (clone JDR.3B8, Santa Cruz Biotechnology, Inc., Dallas, TX, USA) stains. According to the manufacturer, the JDR.3B8 stains both β-tubulin-1 and β-tubulin-2, which are localized in the cytoplasm and the nucleus of the cells respectively [Citation17]. The TMA sections were incubated at 60°C for 60 minutes followed by deparaffinization by submersion in xylenes, followed by hydration in consecutively lower concentrations of ethanol. Afterwards the TMA sections were treated with peroxidase- and protein blocking agents for 3 minutes and 10 minutes, respectively, with washes in phosphate buffered saline containing 0.05% Tween-20 (PBST). The sections were incubated with diluted murine antibody, (β-tubulin-1 and 2, 1:400 dilution and GST-π, 1:150 dilution) respectively for 1 hour at room temperature. After another PBST wash the reaction was visualized with BioGenex Super Sensitive multilink system (Biogenex, Fremont, CA, USA). The sections were incubated with biotinylated goat anti-rabbit/mouse-immunoglobulin for 20 minutes, washed in PBS for 4 minutes followed by 20 minutes of incubation with peroxidase-conjugated streptavidin anti-immunoglobulin and again washed for 4 minutes. Finalizing the process diaminobenzidine solution was incubated with the sections for 10 minutes at 22°C. The slides were counterstained with hematoxylin, dehydrated through submersions in consecutively higher concentrations of ethanol ending with submersion in xylenes. Coverslips were attached using Cytoseal 60.
Staining for EGFR and Ki-67 were performed at Department of Pathology, RH, Copenhagen using standard clinical protocols on a Benchmark ULTRA automated IHC-slide-staining system (Ventana Medical Systems, Inc.). Sections of the TMAs were cut at 3–4 micron thickness, mounted on Dako FLEX IHC microscope slides. For EGFR, ready-to-use Clone 5B7 (Ventana Medical Systems, Inc.) was used. Ki-67 staining used clone MIB1 (DAKO, Glostrup, Denmark) in dilution 1:100. Relevant control tissues were co-stained in the same run of the machine.
Immunostaining of p16 was scored according to EORTC/DAHANCA guidelines [Citation18], regardless of tumor location. For the other immunostained TMAs percentage of positively stained tumor cells was scored semi-quantitatively on a scale of 0–5 according to the proportion score proposed by Allred [Citation19]. The intensity of the stained cells was not included in the analyses. The immunostained sections of the TMA were scored by one of the authors (GBR), supervised by another author (MHT). In case of disagreement, the cases were discussed and consensus was reached by use of a stereo microscope. The patient's clinical and outcome data were kept unknown to authors MHT and GBR until after the scoring of the IHC stains.
Statistical analysis
Statistical analyses were performed using IBM SPSS version 19. Associations were tested using Spearman's rank correlation coefficient on the full scale (0–5) of IHC proportion scores. The functional image metrics (TSUVmax) were plotted against proportion scores as box-and-whiskers plots binned in low (0–1) intermediate (2–3) and high (4–5) IHC scores in order to have sufficient numbers in each stratum.
Univariate and multivariate linear regression was used to analyze FDG uptake as a function of IHC scores.
Additionally, the ability to predict IHC status from the FDG uptake was tested by logistic regression after dichotomizing the IHC scores that were significantly correlated with FDG in the multivariate linear regression: p16, Bcl-2 and β-tubulin-1. When dichotomizing the IHC scores, proportion scores of 0–2 (0–10% stained tumor-cells) were classified as negative, while scores of 3–5 (> 10% tumor cells stained) were considered positive. A two-tailed p < 0.05 was considered significant in all analyses.
Results
Results from the univariate linear regression and the multivariate linear regression are shown in . In univariate analyses, TSUVmax showed negative associations with Bcl-2 (p = 0.002) and p16 (p = 0.005) indices and positive association with β-tubulin-1 index (p = 0.003). The r-squared values of the found associations (shown in ) are 0.10, 0.08 and 0.09, respectively. In the multivariate linear model, TSUVmax remained associated with β-tubulin-1 (p = 0.009), Bcl-2 (p = 0.032) and p16 (p = 0.033). The r-squared value of the multivariate model is 0.26.
Spearman's rank correlation coefficients of the IHC-staining scores versus TSUVmax are shown in , with positive associations seen between TSUVmax and β-tubulin-1 (Spearman's rho: 0.34, p: 0.001) and EGFR (Spearman's rho: 0.24, p: 0.021) and negative associations between TSUVmax and Bcl-2 (Spearman's rho: -0.30, p: 0.003), p16 (Spearman's rho: -0.29, p: 0.004) and β-tubulin-2 (Spearman's rho:-0.21, p: 0.046).
Figure 1. IHC vs TSUVmax. Immunohistochemical stains versus TSUVmax. The proportion of positive cells have been binned in three groups, low expression (up to 1% positively stained cells) intermediate expression (> 1–33% positively stained cells) and high expression (> 33% positively stained cells) in order to have sufficient numbers in each stratum. p16 is scored dichotomously according to EORTCs p16 scoring guidelines [Citation18].
![Figure 1. IHC vs TSUVmax. Immunohistochemical stains versus TSUVmax. The proportion of positive cells have been binned in three groups, low expression (up to 1% positively stained cells) intermediate expression (> 1–33% positively stained cells) and high expression (> 33% positively stained cells) in order to have sufficient numbers in each stratum. p16 is scored dichotomously according to EORTCs p16 scoring guidelines [Citation18].](/cms/asset/dbc57432-f6c4-4792-90df-66ea2b8b8aac/ionc_a_1062539_f0001_b.gif)
Table I. Results of univariate and multivariate linear regression.
Associations between TSUVmax and p53 (negative tendency), GST-π (positive tendency) and Ki-67 (negative tendency) were not significant.
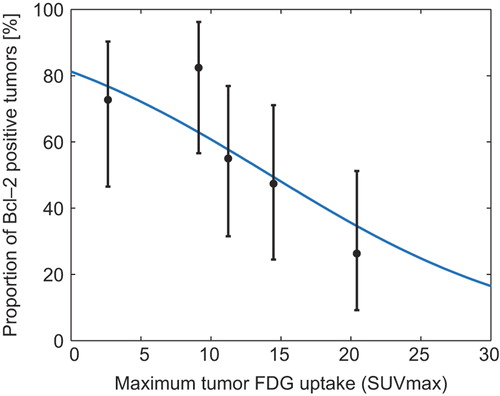
The results of the univariate logistic regression with either p16 or Bcl-2 as dependent variables are shown in and . Logistic regression of β-tubulin-1 did not come out significant (p = 0.1).
Figure 2. Proportion of p16 positive tumors. Logistic regression analysis of the probability of p16 positivity as a function of TSUVmax. Mean TSUVmax (with exact binomial confidence intervals) plotted for five 20 percentile groups based on TSUVmax. The knowledge of the TSUVmax of a tumor can be used to give a probability of the tumor being p16 positive. Logistic regression equation for p16: P = (exp(0.543+−0.108*TSUVmax))/(1 + exp(0.543+−0.108*TSUVmax)).
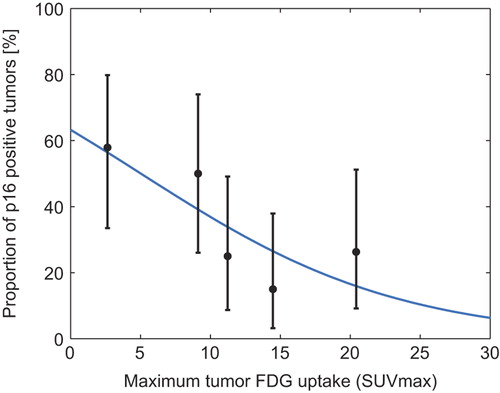
Figure 3. Proportion of Bcl-2 positive tumors. Logistic regression analysis of function with the probability of Bcl-2 positivity as a function of TSUVmax. Mean TSUVmax (with exact binomial confidence intervals) plotted for five 20 percentile groups based on TSUVmax. The knowledge of the TSUVmax of a tumor can be used to give a probability of the tumor being Bcl-2 positive. Logistic regression equation for Bcl-2: P = (exp(1.467+−0.103*TSUVmax))/(1 + exp(1.467+−0.103*TSUVmax)).
Discussion
Prognostic stratification is an essential part of managing patients with cancer. Here, we analyze relationships between TSUVmax and molecular biomarkers with the ultimate aim of improving the understanding of the disease.
FDG uptake assessed on PET/CT scans provides relatively unspecific but spatially resolved information on tumor uptake of the radio-labeled glucose. As Hoeben et al. states: overall FDG-uptake of malignancies reflect multifactorial mechanisms of increased metabolic activity and glucose utilization, performed by glucose transporters and enzymes in the glycolytic pathway, which in turn are regulated by different signaling pathways triggered by endogenous and exogenous stimulation [Citation20]. This relatively unspecific information on FDG uptake has been used to create prognostic models in HNSCC [Citation1] by our group among others.
However, IHC on diagnostic tumor biopsies provides highly specific, local information on the expression of proteins from an exact antigen-antibody reaction. Panels of IHC-markers have been shown to provide prognostic information in HNSCC by multiple groups [Citation2,Citation21]. Cullen et al. looked at IHC-expression of p53, Bcl-2, β-tubulin, GST-π in a HNSCC cohort. In univariate analysis, low expression of p53, GST-π and β-tubulin was associated with lower hazard ratios of any-cause mortality whereas low expression of Bcl-2 was associated with a poor prognosis. These results were significant or borderline significant (p-values between < 0.0001 and 0.066). A model was developed stratifying the patients on basis of number of positive biomarkers [Citation2,Citation3].
Only a few groups have looked into the combination of imaging and IHC biomarkers in HNSCC [Citation22].
IHC staining has limitations of its own even when tissue is available: there is no consensus regarding scoring systems, and the methodology and scoring of IHC stains vary between institutions. Factors like storage of FFPE-blocks, time in, and type of formalin used to fix the tissue, amount of diluted antigen used, epitope retrieval protocols, etc., all influence staining results. Similarly, quantitation of PET imaging results is subject to substantial variability [Citation23].
In our study we found a significant negative correlation between TSUVmax and Bcl-2 expression, meaning that the tumors that have low expression of Bcl-2 are the ones with a high TSUVmax. Comparing the two prognostic studies, Cullen et al. [Citation2,Citation3] finds that elevated expression of Bcl-2 is a favorable prognostic marker compared to low expression in agreement with other studies [Citation4,Citation6]. Rasmussen et al. [Citation1] finds that low SUVmax is also a favorable prognostic marker compared to high SUVmax.
We found a positive correlation with the cytoplasmic β-tubulin-1 and TSUVmax. This also is in line of both prognostic studies. Cullen et al. [Citation2] found elevated cytoplasmic β-tubulin significantly adversely associated with overall survival of the patients.
HPV status has over the last decade been proven to be a strong, independent prognostic factor for survival in oropharyngeal cancer [Citation24]. We found p16 expression to be significantly negatively correlated with TSUVmax, in agreement with studies suggesting that HPV positive oropharyngeal tumors are smaller and less FDG avid than HPV negative tumors [Citation25].
A subset of 11 patients had no pathological FDG uptake, nine of these had their tumor located in the oropharynx. A potential weakness could be that the diagnostic procedure had removed all the tumor tissue. Exclusion of the 11 patients without pathologic FDG uptake in the tumor position makes the correlation between p16 status and FDG uptake non-significant, but the remaining correlations hold.
In the studied cohort there are 17% nasopharyngeal cancers. The reason for this is that the Department of Pathology at Rigshospitalet, receives and diagnoses the diagnostic biopsies from Greenland. It might be possible to do subgroup analysis on this group of patients, but at this time there is not enough power in the population size for this.
The correlations found in this study are generally modest albeit highly significant. This means that the investigated IHC markers only explain a relatively modest part of the total variation in TSUVmax. This is reflected in both the r-squared values of the linear regressions, the Spearman's rho's as well as the logistic regression ( and ). The possible complementarity and synergy between the two classes of biomarkers is an attractive area of research. Future work of interest would be to generate a prognostic or failure-type specific model using both classes of markers, an effort that would require a larger data set than the current one.
In conclusion, we have demonstrated association between known prognostic imaging and molecular biomarkers in HNSCC. Improved understanding of HNSCC biology as well as improved prognostic and predictive models could likely result from multiplexed marker sets.
Supplementary material available online
Supplementary Figure 1 and Table I to be found online at http://informahealthcare.com/doi/abs/10.3109/0284186X.2015.1062539.
ionc_a_1062539_sm6885.pdf
Download PDF (71.4 KB)Acknowledgements
Histotechnician Pernille Frederiksen, Department of Pathology, Rigshospitalet, Copenhagen and histotechnicians accredited by the American Society of Clinical Pathology (ASCP) Kimberly Tuttle and Loretta Kendall, Dept. of Pathology, UMSOM, for their help in creating the TMAs and performing the IHC.
Residency/Fellowship Program Coordinator Kathleen Warfield, Department of Pathology, UMSOM, Department of Pathology, RH, Copenhagen, Denmark and Department of Pathology, UMSOM, Baltimore, Maryland, USA.
The work was supported by grants from “Global Excellence” from the Capital Region of Denmark, Kirsten and Freddy Johansen's Foundation, Aase and Ejnar Danielsen's Foundation, the Danish Cancer Research Foundation (Dansk Kræftforskningsfond) and the National Institute of Health (NIH) grant no: P30 CA 134274-04. Jacob H. Rasmussen is supported by the Arvid Nilsson's Foundation.
Declaration of interest: The authors report no conflicts of interest. The authors alone are responsible for the content and writing of the paper.
References
- Rasmussen JH, Vogelius IR, Fischer BM, Friborg J, Aznar MC, Persson GF, et al. Prognostic value of 18F-fludeoxyglucose uptake in 287 patients with head and neck squamous cell carcinoma. Head Neck Epub 2014 May 7.
- Cullen KJ, Schumaker L, Nikitakis N, Goloubeva O, Tan M, Sarlis NJ, et al. beta-Tubulin-II expression strongly predicts outcome in patients receiving induction chemotherapy for locally advanced squamous carcinoma of the head and neck: A companion analysis of the TAX 324 trial. J Clin Oncol 2009;27:6222–8.
- Wu Y, Posner MR, Schumaker LM, Nikitakis N, Goloubeva O, Tan M, et al. Novel biomarker panel predicts prognosis in human papillomavirus-negative oropharyngeal cancer: An analysis of the TAX 324 trial. Cancer 2012;118: 1811–7.
- Buffa FM, Bentzen SM, Daley FM, Dische S, Saunders MI, Richman PI, et al. Molecular marker profiles predict locoregional control of head and neck squamous cell carcinoma in a randomized trial of continuous hyperfractionated accelerated radiotherapy. Clin Cancer Res 2004;10: 3745–54.
- Marur S, D’Souza G, Westra WH, Forastiere AA. HPV-associated head and neck cancer: A virus-related cancer epidemic. Lancet Oncol 2010;11:781–9.
- Oliveira LR, Ribeiro-Silva A. Prognostic significance of immunohistochemical biomarkers in oral squamous cell carcinoma. Int J Oral Maxillofac Surg 2011;40:298–307.
- Hanahan D, Weinberg RA. Hallmarks of cancer: The next generation. Cell 2011;144:646–74.
- Gorrini C, Harris IS, Mak TW. Modulation of oxidative stress as an anticancer strategy. Nat Rev Drug Discov 2013;12:931–47.
- Tew KD, Manevich Y, Grek C, Xiong Y, Uys J, Townsend DM. The role of glutathione S-transferase P in signaling pathways and S-glutathionylation in cancer. Free Radic Biol Med 2011;51:299–313.
- Parker AL, Kavallaris M, McCarroll JA. Microtubules and their role in cellular stress in cancer. Front Oncol 2014;4:153.
- Ohishi Y, Oda Y, Basaki Y, Kobayashi H, Wake N, Kuwano M, et al. Expression of beta-tubulin isotypes in human primary ovarian carcinoma. Gynecol Oncol 2007;105:586–92.
- Tornesello ML, Perri F, Buonaguro L, Ionna F, Buonaguro FM, Caponigro F. HPV-related oropharyngeal cancers: From pathogenesis to new therapeutic approaches. Cancer Lett 2014;351:198–205.
- Scholzen T, Gerdes J. The Ki-67 protein: From the known and the unknown. J Cell Physiol 2000;182:311–22.
- Bentzen SM, Atasoy BM, Daley FM, Dische S, Richman PI, Saunders MI, et al. Epidermal growth factor receptor expression in pretreatment biopsies from head and neck squamous cell carcinoma as a predictive factor for a benefit from accelerated radiation therapy in a randomized controlled trial. J Clin Oncol 2005;23:5560–7.
- Ang KK, Berkey B a, Tu X, Zhang H-Z, Katz R, Hammond EH, et al. Impact of epidermal growth factor receptor expression on survival and pattern of relapse in patients with advanced head and neck carcinoma. Cancer Res 2002;62:7350–6.
- Rasmussen J, Vogelius IR, Fischer M, Aznar MC, Håkansson K, Persson GF, et al. Prognostic value of 18F-Fluorodeoxyglucose SUVmax in head-and-neck cancer depends on the gross tumor volume. Int J Radiat Oncol 2013;87:S473.
- β Tubulin (JDR.3B8): sc-58882. Datasheet n.d. [cited 2014 Sept 22]. Available from: http://datasheets.scbt.com/sc-58882.pdf.
- Lassen P. DAHANCA/EORTC guidelines for scoring and classification of p16-immunohistochemistry in HPV-related oropharyngeal cancer 2012. [cited 2015 May 10]. Available from: http://www.dahanca.dk/get_media_file.php?mediaid = 322
- Allred DC, Harvey JM, Berardo M, Clark GM. Prognostic and predictive factors in breast cancer by immunohistochemical analysis. Mod Pathol 1998;11:155–68.
- Hoeben BAW, Bussink J, Troost EGC, Oyen WJG, Kaanders JHAM. Molecular PET imaging for biology-guided adaptive radiotherapy of head and neck cancer. Acta Oncol 2013;52:1257–71.
- Baschnagel AM, Williams L, Hanna A, Chen PY, Krauss DJ, Pruetz BL, et al. C-met expression is a marker of poor prognosis in patients with locally advanced head and neck squamous cell carcinoma treated with chemoradiation. Int J Radiat Oncol Biol Phys 2014;88:701–7.
- Hoeben BAW, Starmans MHW, Leijenaar RTH, Dubois LJ, van der Kogel AJ, Kaanders JHAM, et al. Systematic analysis of 18F-FDG PET and metabolism, proliferation and hypoxia markers for classification of head and neck tumors. BMC Cancer 2014;14:130.
- Shepherd T, Teras M, Beichel RR, Boellaard R, Bruynooghe M, Dicken V, et al. Comparative study with new accuracy metrics for target volume contouring in PET image guided radiation therapy. IEEE Trans Med Imaging 2012;31:2006–24.
- Ang KK, Harris J, Wheeler R, Weber R, Rosenthal DI, Nguyen-Tân PF, et al. Human papillomavirus and survival of patients with oropharyngeal cancer. N Engl J Med 2010;363:24–35.
- Schouten CS, Hakim S, Boellaard R, Bloemena E, Doornaert PA, Witte BI, et al. Interaction of quantitative 18F-FDG-PET-CT imaging parameters and human papillomavirus status in oropharyngeal squamous cell carcinoma. Head Neck Epub 2014 Oct 19.