
ABSTRACT
Background. Diffusion-weighted magnetic resonance imaging (DW-MRI) and the derived apparent diffusion coefficient (ADC) value has potential for monitoring tumor response to radiotherapy (RT). Method used for segmentation of volumes with reduced diffusion will influence both volume size and observed distribution of ADC values. This study evaluates: 1) different segmentation methods; and 2) how they affect assessment of tumor ADC value during RT.
Material and methods. Eleven patients with locally advanced cervical cancer underwent MRI three times during their RT: prior to start of RT (PRERT), two weeks into external beam RT (WK2RT) and one week prior to brachytherapy (PREBT). Volumes on DW-MRI were segmented using three semi-automatic segmentation methods: “cluster analysis”, “relative signal intensity (SD4)” and “region growing”. Segmented volumes were compared to the gross tumor volume (GTV) identified on T2-weighted MR images using the Jaccard similarity index (JSI). ADC values from segmented volumes were compared and changes of ADC values during therapy were evaluated.
Results. Significant difference between the four volumes (GTV, DWIcluster, DWISD4 and DWIregion) was found (p < 0.01), and the volumes changed significantly during treatment (p < 0.01). There was a significant difference in JSI among segmentation methods at time of PRERT (p < 0.016) with region growing having the lowest JSIGTV (mean± sd: 0.35 ± 0.1), followed by the SD4 method (mean± sd: 0.50 ± 0.1) and clustering (mean± sd: 0.52 ± 0.3). There was no significant difference in mean ADC value compared at same treatment time. Mean tumor ADC value increased significantly (p < 0.01) for all methods across treatment time.
Conclusion. Among the three semi-automatic segmentations of hyper-intense intensities on DW-MR images implemented, cluster analysis and relative signal thresholding had the greatest similarity to the clinical tumor volume. Evaluation of mean ADC value did not depend on segmentation method.
Diffusion-weighted magnetic resonance imaging (DW-MRI) can measure diffusion of water molecules occurring at a scale of 3–30 μm [Citation1], which is of the same order as cell size. The DW-MR images thereby give information about the cellular structure of tissues in vivo, which could potentially discriminate dense tumor tissue from normal tissue. From the DW-MR images, the apparent diffusion coefficient (ADC) can be calculated [Citation1], making it possible to quantify the diffusion. These features make DW-MRI a promising imaging modality for both tumor diagnostics and for treatment response monitoring, e.g. based on the change of tumor ADC value during radiotherapy (RT) [Citation2]. DW-MR images and ADC images may be used for target definition in RT [Citation3,Citation4] providing physiology information of the tumor tissue. For assessing treatment response to RT in patients with cervical cancer the use of tumor ADC value has been investigated with promising results. Harry et al. found a positive correlation between change in ADC value and MR-based treatment response measured as change in tumor size already two weeks into therapy [Citation5]. Liu et al. found similar results reporting a correlation between change in ADC value after one month to change in MR-based tumor size reduction after two months [Citation6]. They also found that pretreatment ADC value was lower for complete responders (CR) compared to partial responders (PR) evaluated after two months. In modern brachytherapy (BT) dose planning is done based on MR images acquired with applicator in situ [Citation7,Citation8]. Tumor volumes for BT are delineated according to the GEC-ESTRO guidelines [Citation9,Citation10], where three clinical tumor volumes (CTV) are identified: the intermediate risk CTV (IR-CTV), the high-risk CTV (HR-CTV) and the gross tumor volume (GTV). The GTV is defined as the residual tumor volume present at time of BT. For BT it has been shown that the three GEC-ESTRO tumor volumes used for BT have different mean ADC values [Citation11], but that the ADC value did not change during the one week between the two BT fractions. When including the DW-MRI and ADC images for identification of tumor volume and response evaluation it is essential how the tumor is segmented and which voxels are included for calculation of the ADC values. Segmentation of the tumor at different treatment time points should be done objectively and as user-independent as possible. This would also improve comparisons of the ADC values across RT and across different institutions and scanners. This is similar to the challenge in PET imaging, where variations in the segmentation method have impact on the delineation of FDG avid volumes as well as the quantification of parameters such as mean standard uptake value (SUV) [Citation12,Citation13]. In MRI the mean tumor ADC value can be calculated based on the GTV delineated on the clinical T2-weighted (T2W) images used for treatment planning. However, the delineation of the GTV based on T2W MRI is associated with uncertainties, especially at time of BT [Citation14]. Furthermore, distortions due to DW-MRI acquisition method resulting in geometrical uncertainties may have an impact on this approach. In order to eliminate these uncertainties the DW-MRI b = 0 s/mm2 can be used for tumor segmentation [Citation15]. However, tumor volumes segmented on T2W or DW-MRI at b = 0 s/mm2 images may include necrotic tissue and voxels with high diffusion resulting in potential erroneous ADC values. To ensure segmentation of only viable tumor tissue manual segmentation of the tumor using the DW-MR images with the highest b-value can be used [Citation16]. This assures high contrast-to-noise for segmentation and high signal-to-noise at all b-values included for robust fitting of ADC values. Finally, the segmentation could be done directly on the ADC image slice showing the largest tumor extension [Citation5] or for the entire tumor volume [Citation17]. A disadvantage of this method is the poor contrast-to-noise of the ADC image and potential erroneous fitted ADC values due to poor signal-to-noise ratio of the DW-MR images.
Currently there is no consensus of the methodology to segment tumor volume for calculation of ADC values. This study evaluates three different segmentations methods for semi-automatic segmentation of the hyper-intense signal of tumor on DW images. Quantitative parameters of the tumor, such as ADC value, volume and tumor volume ratio (TVR), are evaluated and compared over time of treatment.
Material and methods
Patients
In this study 12 patients with locally advanced cervical cancer were included. One patient was excluded since no hyper-intense volume was present on DWI at b = 1000 s/mm2 at any treatment time points. Tumor stage, defined by the FIGO staging system, for the remaining 11 was 2A: 1, 2B: 9 and 3B: 1 and histology: squamous cell carcinoma: 8, adenocarcinoma: 2, adenosquamous carcinoma: 1. The patients were treated with external beam radiotherapy (EBRT) of 45–50Gy in 25–30 fractions with concomitant weekly cisplatin followed by two pulsed dose rate (PDR) BT treatments (17.5 Gy per fraction) with one week between BT treatments. EBRT was delivered as intensity-modulated radiation therapy (IMRT) or volumetric arc radiotherapy (VMAT). BT was MRI-guided with imaging, contouring, applicator reconstruction and reporting done according to GEC-ESTRO recommendations [Citation9,Citation10,Citation18]. All MR image acquisition for BT, including pre-plan BT, was done with MR compatible plastic tandem-ring applicator in-situ (GammaMed, Varian Medical Systems, Charlottesville, VA, USA). Three MRI examinations of each patient were included in this study: one prior to start of treatment (PRERT), one at Week 2 into their EBRT (WK2RT), and one MRI acquired one week prior to first BT fraction (PREBT), which is Week 4–5.
Imaging
All MRI examinations were performed using a 3T MR scanner (Philips Achieva 3T-X, Best, The Netherlands) and included DW-MRI (b-values = 0, 150, 600 and 1000 s/mm2). The DW-MRI acquisition parameters were as follows: in-plane resolution 2.5 × 2.5 mm, slice thickness 4 mm, TR/TE = 1800/70 ms, time between diffusion gradients Δ = 36.5 ms and diffusion gradient time δ = 17.7 ms.
Segmentation
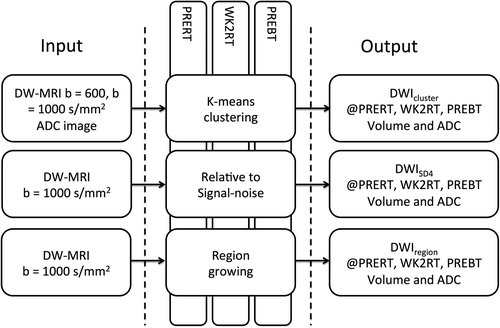
Three different user-independent semi-automatic segmentation methods were performed and evaluated for all patients and at all time points before and during treatment (PRERT, WK2RT and PREBT) ().
Figure 1. Workflow for segmentation with inputs for the three algorithms and resulting volumes and output from segmentation.
Clustering
Clustering is a method for grouping data of same similarity and can be used for many different applications [Citation19]. The k-means clustering algorithm is often chosen for image segmentation grouping voxels of same signal intensities and has also been used for classification of functional imaging data [Citation20,Citation21]. K-means clustering is an unsupervised segmentation technique that only requires a priori number of groups, clusters. The clustering strategy for the k-means clustering algorithm used is the squared Euclidian distance grouping data into three clusters. The algorithm searches to minimize the inter cluster variance of distance, Equation 1, for all clusters, ck,
where ck is the kth cluster, μk is the mean (cluster center) of the cluster (ck) and xi is a point in ck. The main steps of the algorithm are as follows, where step 2 and 3 are repeated until inter-cluster variance is minimized and the cluster centers do not change when re-calculated
Random seed points corresponding to cluster centers for the chosen numbers of clusters are placed.
Each point is assigned to the closest cluster center.
New cluster centers are calculated based on the assigned points to the cluster.
Three image sets are given as input: 1) ADC image, 2) signal intensities of voxels for DW-MRI b = 600 s/mm2 and 3) DW-MRI b = 1000 s/mm2. These are grouped into three clusters. The volume resulting from the cluster containing voxels with both lowest ADC values and highest values for both DW-MR image set is defined as the tumor volume and is in the following denoted by DWIcluster.
Relative signal intensity (SD4)
This is based on the method described and validated by Yamazoe et al. [Citation22]. The method uses the DW-MR images acquired with b = 1000 s/mm2. First a ROI encircling the entire pelvis (ROInoise) is drawn and the standard deviation (SD) of the voxels inside ROInoise is calculated. Subsequently, a second ROI is roughly drawn to delineate the cervix, uterus and the surrounding tissue (ROIcervix). The ROIcervix is drawn on each image slice. The subsequent segmentation is performed inside the ROIcervix. All voxels inside the ROIcervix with intensity larger than four times the previously calculated SD for the entire image is segmented as hyper-intense, which is then defined as tumor volume, in the following termed DWISD4.
Region growing
The region growing method segments voxels by comparing the already segmented region mean to the intensity of the neighboring voxels [Citation23]. The threshold for including new voxels is set based on the standard deviation from ROInoise, as defined above for SD4, and set as 0.2SD(ROInoise). This is done since it was found that the same threshold could not be used through all treatment time points. To begin the region growing a seed point must be placed where the region growing process begins, and the method then proceeds as listed below:
The mean intensity of the already segmented region is calculated.
The intensity of the surrounding voxels is compared to the intensity mean of the region.
If the difference in signal intensity between the voxel and the mean intensity of the region is below the preselected threshold, the voxel is added to the region, otherwise the voxel is excluded.
Step 2–4 is repeated until no more voxels can be added to the region.
A seed point was placed in a region with high signal intensity corresponding to the central part of the tumor.
Image processing and analysis
All image analysis was done using Matlab (Mathworks Inc., Natick, MA, USA). First ROInoise and a ROIcervix were drawn on the DWI b = 1000 s/mm2, as described previously. The three segmentation methods were only performed on voxels within the ROIcervix. The segmented volume and the mean ADC of the volume was calculated and compared across segmentation techniques and treatment time points. The ADC was calculated voxel-by-voxel using non-linear fit of the diffusion signal at b = 150, 600, 1000 s/mm2 [Citation24]. Histogram analysis of the ADC voxels was performed and compared over treatment time points. From the histogram analysis, the kurtosis of the distribution was calculated (note that this kurtosis is distinct from diffusion kurtosis [Citation25]). The kurtosis of a standard normal distribution is three, while a kurtosis > 3 indicate a more narrow distribution. The GTV was delineated on T2W images by an experienced radiation oncologist. The segmented DW-MRI volumes (DWIcluster, DWISD4 and DWIregion) were compared to the volume of the GTV using the Jaccard similarity index (JSI), where JSI = 1 corresponds to equal volumes, denoted later as JSIGTV. TVR for GTV was calculated as VWK2RT/VPRERT and VPREBT/VPRERT. Change in ADC during RT (ΔADC) was calculated as (ADCWK2RT – ADCPRERT) and (ADCPREBT – ADCPRERT).
Image registration
In order to compare the segmented DW-MRI volumes to the GTV, the geometrical distortion in EPI-based DW-MR images needed to be reduced. This was done by registering the DW-MR images at b = 0 s/mm2 to T2W images with similar contrast using deformable image registration as described in a previous work [Citation26].
Statistics
Volumes as well as mean ADC were statistically evaluated using two-way ANOVA with repeated measures including segmentation types (GTV, DWIcluster, DWISD4 and DWIregion) and time points as input variables. Pearson's correlation was used for evaluating correlation between TVR and ADC. A p < 0.05 was considered a significant difference.
Results
For the 11 included patients, a hyper-intense region was identified at time of both PRERT and WK2RT. For 6/11 patients, a hyper-intense region was identified at time of PREBT. Comparing the different volumes (GTV, DWIcluster, DWISD4 and DWIregion) across treatment time a significant difference was found both between volumes (p < 0.01) and between treatment times (p < 0.01) (Supplementary Figure 1, available online at http://www.informahealthcare.com/doi/abs/10.3109/0284186X.2015.1062545). All DW-MRI volumes were smaller than the GTV. The DWIcluster and DWISD4 evolved almost similar during treatment (). The JSIGTV was calculated for all three methods and for all treatment time points (). There was a significant difference for the JSIGTV comparing methods at time of PRERT (p < 0.016), with region growing having the lowest JSIGTV (mean± sd: 0.35 ± 0.1), followed by the SD4 method (mean± sd: 0.50 ± 0.1) and the clustering method (mean± sd: 0.52 ± 0.3). The percentage of DW-MRI volume inside the GTV was calculated (). This value was lowest for the region growing but not significantly lower for any of the treatment time points. In an example is shown at time point PRERT where the three methods performs similarly, whereas in at time point PREBT, the region growing method segments a larger volume, DWIregion, compared to DWIcluster and DWISD4. No significant difference was found for mean ADC for the three volumes compared at same treatment time point (). The mean tumor ADC value increased significantly (p < 0.01) when compared across treatment time points. There was a significant decrease in kurtosis of the ADC value histogram from PRERT to WK2RT for the DWISD4 (p = 0.02), but not for clustering and region growing (Supplementary Table I, available online at http://www.informahealthcare.com/doi/abs/10.3109/0284186X.2015.1062545). shows a histogram of the ADC values at all three time points including one slice of the ADC images at the three different time-points. Here it is clearly seen that the curve is shifted to the right (higher ADC values), and that the curve becomes flatter and broader, reflected by a decreasing kurtosis, going from PRERT to during WK2RT and to time prior to BT.
Figure 2. Change in mean volume size for all segmented volumes and GTV as a function of treatment time. Error bars represents standard deviation.
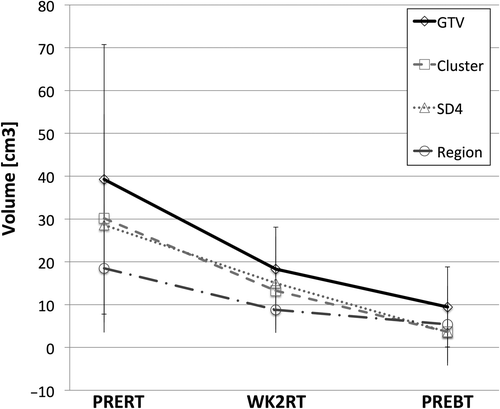
Figure 3. DW-MR images at b = 1000 s/mm2 at treatment time PRERT (a, b, c) and PREBT (d, e, f) for the three different segmentation methods: a, d: clustering, b, e: SD4 and c, f: region-growing. The yellow contour illustrates the segmented volume while the blue contour is the GTV as delineated on T2W images.
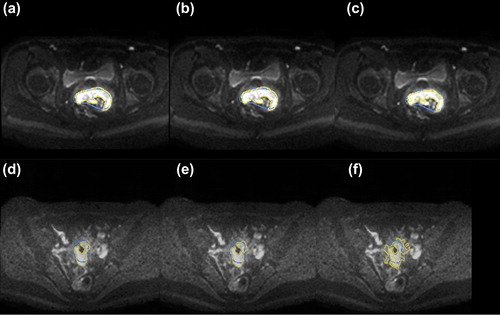
Figure 4. ADC images for one patient at the three different treatment time points: A: PRERT, B: WK2RT and C: PREBT. The yellow contour illustrates the segmented volume while the blue contour is the GTV as delineated on T2W images. In D the histogram of the ADC values for the three treatment time points is shown for PRERT (green), WK2RT (blue) and PREBT (red). The red contour shows the estimated Gaussian fit.
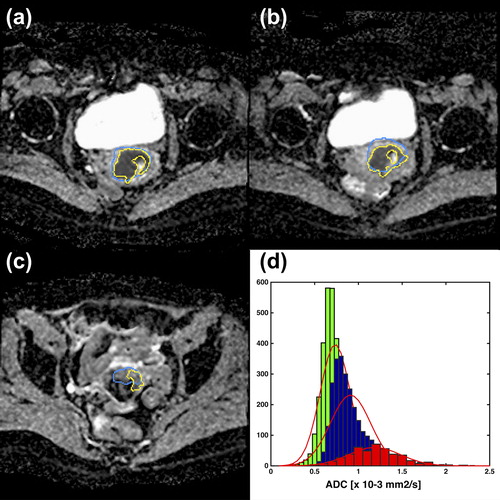
Table I. Volumes for each treatment time point. The Jaccard similarity index (JSI) is the segmented volume compared to GTV. The %DWI in GTV describes the amount of the segmented DWI volume that is located inside the GTV.
Table II. Mean ADC values for the three segmented DWI volumes at all three treatment time points. Also the change in ADC as compared to the PRE-RT ADC in percent is shown.
The mean TVR was VWK2RT/VPRERT = 0.62 ± 0.42 and VPREBT/VPRERT = 0.34 ± 0.49. There was no correlation between TVR and mean ADC value at any time points or change in ADC value.
Discussion
The cluster analysis and SD4 method performed similarly with nearly equal JSIGTV. The region growing method performed the poorest with the lowest JSI compared to GTV, and the lowest percentage of DW-MRI volume inside the GTV (non-significant). From visual evaluation, it was also evident that region growing failed in segmenting volumes, which were clearly not GTV related. The region growing method failed probably because the signal-to-noise becomes poorer at time of PREBT, resulting in a larger segmented volume at time of PREBT as compared to the other two methods. This is explained by the region growing method being more sensitive to signal-to-noise variations, and also depending on a proper seed-point and stopping criteria. There are also limitations to the SD4 method. The contrast and signal intensity of the DW-MR images depends on b-value and acquisition method used for DW-MR images and other threshold values might be used at other sites. In 5/11 patients there was no hyper-intense region at time of brachytherapy (PREBT). This indicates that the residual tumor in these patients is very small or often not any longer present due to the significant tumor shrinkage occurring during EBRT [Citation27].
Evaluating both the JSIGTV and the overlap of DW-MRI and GTV volume it is seen that both values decreases during treatment time with highest values at PRERT. There are several uncertainties present when comparing the DW-MRI volume to the GTV volume. First the GTV delineation based on T2W images at time of BT is associated with significant uncertainties [Citation14,Citation28]. Second, even though the EPI-based DW-MR images have been registered to non-EPI-based T2W images for reducing geometrical distortion, some residual geometrical uncertainty will still remain [Citation26]. Furthermore, patient motion and shifting of the cervix and uterus due to bladder filling during the time between acquisition of the T2W images and the DW-MR images will introduce uncertainties on the match between the GTV and the DWI volumes. Also the JSIGTV depends on both size, shape and position of volumes, and for small volumes a small difference between the volumes can result in a relative large decrease in JSI [Citation29], which explains the low JSIGTV at time of PREBT.
For all three segmentation methods the segmented volumes were found to be significantly smaller than the GTV volume at all treatment time points () indicating that DW-MR images holds other information of the tissue than the T2-weighted images. This might not be surprising since the image contrast of T2W and DW-MRI reflects different properties of the tumor tissue. We observed that the DW-MRI volume was mainly located inside the GTV volume and we therefore hypothesize that DW-MRI volumes represent GTV sub-volumes associated with higher density of viable tumor tissue. Zhang et al. also found for cervical cancer that the tumor volume delineated on T2W images was larger than the actual pathological tumor volume and that the size of the pathological tumor volume was similar to the tumor volume defined on PET images [Citation30]. This also indicates, that the GTV delineated on T2W images should not be considered as a golden standard for comparison to DW-MRI volumes. However GTV delineated on T2-weighted images is currently the clinical standard for identification of macroscopic pathological tissue. Any new methodology for segmentation of GTV related volumes should be compared to the current standard.
All three methods detected significant increase in ADC value of the tumor during treatment. The increase in ADC value could reflect microstructural changes in tissue structure caused by RT, where viable tumor tissue is replaced by edema and fibrosis [Citation31]. Such an association has previously been found in locally advanced cervical cancer treated by neoadjuvant chemotherapy, where a close relation between ADC value and tumor cellular density was observed [Citation32]. The histogram kurtosis of ADC value during therapy reported here might add additional information reflecting the change of tumor cellular structure during RT. Similar decrease in kurtosis during RT has been seen in other studies [Citation33,Citation34], where tumors with local control had a larger decrease in kurtosis than those with local failure. The purpose of RT is to induce tumor cell death through damage to the DNA of the cells, resulting in apoptosis, autophagy and necrosis. In RT the tumor cell survival fraction is correlated with the RT dose given to the tumor tissue. The knowledge of cellular density gained by the ADC value could be used for dose-boosting and the change in ADC value histogram during treatment could be used for assessment of treatment response.
Cluster analysis and a relative signal threshold method segmented DW-MRI volumes of comparable size, which were different from the volumes segmented by the region growing method. The segmented DWI-volumes were smaller than the GTV indicating that it holds different information about the tissue than the GTV delineated on T2W.
Supplementary material available online
Supplementary Figure 1 and Table I available online at http://www.informahealthcare.com/doi/abs/10.3109/0284186X.2015.1062545
ionc_a_1062545_sm4980.pdf
Download PDF (316.4 KB)Acknowledgments
This study has been supported by research grants from CIRRO – the Lundbeck Foundation Centre for Interventional Research in Radiation Oncology, MindLab founding from the Danish research council, the European Programme (FP7/2013-2016) under grant agreement n° [ICT-2011.5.2] (DrTherapat). The work also benefited from the use of the software packages SPM (http://www.fil.ion.ucl.ac.uk/spm/software/) and Elastix (http://elastix.isi.uu.nl/).
Declaration of interest: The authors report no conflicts of interest. The authors alone are responsible for the content and writing of the paper.
References
- Le Bihan D. Molecular diffusion, tissue microdynamics and microstructure. NMR Biomed 1995;8:375–86.
- Afaq A. Diffusion-weighted magnetic resonance imaging for tumour response assessment: Why, when and how? Cancer Imaging 2010;10:S179–88.
- Borren A, Groenendaal G, Moman MR, Boeken Kruger AE, van Diest PJ, van Vulpen M, et al. Accurate prostate tumour detection with multiparametric magnetic resonance imaging: Dependence on histological properties. Acta Oncol 2014; 53:88–95.
- Groenendaal G, Moman MR, Korporaal JG, van Diest PJ, van Vulpen M, Philippens MEP, et al. Validation of functional imaging with pathology for tumor delineation in the prostate. Radiother Oncol 2010;94:145–50.
- Harry VN, Semple SI, Gilbert FJ, Parkin DE. Diffusion-weighted magnetic resonance imaging in the early detection of response to chemoradiation in cervical cancer. Gynecol Oncol 2008;111:213–20.
- Liu Y, Bai R, Sun H, Liu H, Zhao X, Li Y. Diffusion-weighted imaging in predicting and monitoring the response of uterine cervical cancer to combined chemoradiation. Clin Radiol 2009;64:1067–74.
- Fokdal L, Tanderup K, Hokland SB, Røhl L, Pedersen EM, Nielsen SK, et al. Clinical feasibility of combined intracavitary/interstitial brachytherapy in locally advanced cervical cancer employing MRI with a tandem/ring applicator in situ and virtual preplanning of the interstitial component. Radiother Oncol 2013;107:63–8.
- Lindegaard JC, Fokdal LU, Nielsen SK, Juul-Christensen J, Tanderup K. MRI-guided adaptive radiotherapy in locally advanced cervical cancer from a Nordic perspective. Acta Oncol 2013;52:1510–9.
- Haie-Meder C, Potter R, Van Limbergen E, Briot E, De Brabandere M, Dimopoulos J, et al. Recommendations from Gynaecological (GYN) GEC-ESTRO Working Group (I): Concepts and terms in 3D image based 3D treatment planning in cervix cancer brachytherapy with emphasis on MRI assessment of GTV and CTV. Radiother Oncol 2005; 74:235–45.
- Potter R, Haie-Meder C, Limbergen EV, Barillot I, Brabandere MD, Dimopoulos J, et al. Recommendations from gynaecological (GYN) GEC ESTRO working group (II): Concepts and terms in 3D image-based treatment planning in cervix cancer brachytherapy—3D dose volume parameters and aspects of 3D image-based anatomy, radiation physics, radiobiology. Radiother Oncol 2006;78:67–77.
- Haack S, Pedersen EM, Jespersen SN, Kallehauge JF, Lindegaard JC, Tanderup K. Apparent diffusion coefficients in GEC ESTRO target volumes for image guided adaptive brachytherapy of locally advanced cervical cancer. Acta Oncol 2010;49:978–83.
- Foster B, Bagci U, Mansoor A, Xu Z, Mollura DJ. A review on segmentation of positron emission tomography images. Comput Biol Med 2014;50C:76–96.
- Skretting A, Evensen JF, Løndalen AM, Bogsrud TV, Glomset OK, Eilertsen K. A gel tumour phantom for assessment of the accuracy of manual and automatic delineation of gross tumour volume from FDG-PET/CT. Acta Oncol 2013;52:636–44.
- Petric P, Hudej R, Rogelj P, Blas M, Tanderup K, Fidarova E, et al. Uncertainties of target volume delineation in MRI guided adaptive brachytherapy of cervix cancer: A multi- institutional study. Radiother Oncol 2013;107:6–12.
- Rizzo S, Summers P, Raimondi S, Belmonte M, Maniglio M, Landoni F, et al. Diffusion-weighted MR imaging in assessing cervical tumour response to nonsurgical therapy. Radiol Med 2011;116:766–80.
- Padhani AR, Liu G, Mu-Koh D, Chenevert TL, Thoeny HC, Takahara T, et al. Diffusion-weighted magnetic resonance imaging as a cancer biomarker: Consensus and recommendations. Neoplasia 2009;11:102–25.
- Kim HS, Kim CK, Park BK, Huh SJ, Kim B. Evaluation of therapeutic response to concurrent chemoradiotherapy in patients with cervical cancer using diffusion-weighted MR imaging. J Magn Reson Imaging 2013;37:187–93.
- Dimopoulos JCA, Petrow P, Tanderup K, Petric P, Berger D, Kirisits C, et al. Recommendations from Gynaecological (GYN) GEC-ESTRO Working Group (IV): Basic principles and parameters for MR imaging within the frame of image based adaptive cervix cancer brachytherapy. Radiother Oncol 2012;103:113–22.
- Jain AK. Data clustering: 50 years beyond K-means. Pattern Recogn Lett 2010;31:651–66.
- Gong N-J, Wong C-S, Chu Y-C, Guo H, Huang B, Chan Q. Increasing the accuracy of volume and ADC delineation for heterogeneous tumor on diffusion-weighted MRI: Correlation with PET/CT. Int J Radiat Oncol Biol Phys 2013;87:407–13.
- Nielsen T, Mouridsen K, Maxwell RJ, Stødkilde-Jørgensen H, Østergaard L, Horsman MR. Segmentation of dynamic contrast enhanced magnetic resonance imaging data. Acta Oncol 2008;47:1265–70.
- Yamazoe S, Takahara T, Shimizu K, Ouchi K, Mogami T, Harada J, et al. Diffusion-weighted imaging with relative signal intensity statistical thresholding for delineating prostate cancer tumors. Magn Reson Med Sci 2012;11:1–8.
- Adams R, Bischof L. Seeded region growing. IEEE Trans Pattern Anal Mach Intell 1994;16:641–7.
- Le Bihan D, Turner R, Moonen CT, Pekar J. Imaging of diffusion and microcirculation with gradient sensitization: Design, strategy, and significance. J Magn Reson Imaging 1991;1:7–28.
- Jensen JH, Helpern JA, Ramani A, Lu H, Kaczynski K. Diffusional kurtosis imaging: The quantification of non-gaussian water diffusion by means of magnetic resonance imaging. Magn Reson Med 2005;53:1432–40.
- Haack S, Kallehauge JF, Jespersen SN, Lindegaard JC, Tanderup K, Pedersen EM. Correction of diffusion-weighted magnetic resonance imaging for brachytherapy of locally advanced cervical cancer. Acta Oncol 2014;53:1073–8.
- Mayr NA, Yuh WTC, Taoka T, Wang JZ, Wu DH, Montebello JF, et al. Serial therapy-induced changes in tumor shape in cervical cancer and their impact on assessing tumor volume and treatment response. Am J Roentgenol 2006;187:65–72.
- Hellebust TP, Tanderup K, Lervåg C, Fidarova E, Berger D, Malinen E, et al. Radiother Oncol 2013;107:13–9.
- Honeyman-Buck J, Deserno TM. Biomedical image processing: Springer-Verlag Berlin Heidelberg. J Digit Imaging 2012;25:689–91.
- Zhang Y, Hu J, Li J, Wang N, Li W, Zhou Y, et al. Comparison of imaging-based gross tumor volume and pathological volume determined by whole-mount serial sections in primary cervical cancer. Onco Targets Ther 2013:6:917–23.
- Patterson DM, Padhani AR, Collins DJ. Technology insight: Water diffusion MRI—a potential new biomarker of response to cancer therapy. Nat Clin Prac Oncol 2008;5:220–33.
- Fu C, Feng X, Bian D, Zhao Y, Fang X, Du W, et al. Simultaneous changes of magnetic resonance diffusion-weighted imaging and pathological microstructure in locally advanced cervical cancer caused by neoadjuvant chemotherapy. J Magn Reson Imaging Epub 2014 Oct 20.
- Kyriazi S, Collins DJ, Messiou C, Pennert K, Davidson RL, Giles SL, et al. Metastatic ovarian and primary peritoneal cancer: Assessing chemotherapy response with diffusion-weighted MR Imaging—value of histogram analysis of apparent diffusion coefficients. Radiology 2011;261:182–92.
- King AD, Chow K-K, Yu K-H, Mo FKF, Yeung DKW, Yuan J, et al. Head and neck squamous cell carcinoma: Diagnostic performance of diffusion-weighted MR imaging for the prediction of treatment response. Radiology 2013;266: 531–8.