
ABSTRACT
Background. Tumour hypoxia and a high tumour metabolism increase radioresistance in patients with head and neck squamous cell carcinoma (HNSCC). The aim of this study was to evaluate the correlation between hypoxia ([18F]HX4 PET) and glucose metabolism ([18F]FDG PET) molecular imaging.
Material and methods. [18F]HX4 and [18F]FDG PET/CT images of 20 HNSCC patients were acquired prior to (chemo)radiotherapy, in an immobilisation mask, with a median time interval of seven days (NCT01347281). Gross tumour volumes of the primary lesions (GTVprim) and pathological lymph nodes (GTVln) were included in the analysis. [18F]FDG PET/CT images were rigidly registered to the [18F]HX4 PET/CT images. The maximum and mean standardised uptake values (SUVmax, SUVmean) within both GTVs were determined. In addition, the overlap was compared between the [18F]HX4 high volume ([18F]HX4 HV) with a tumour-to-muscle ratio > 1.4 and the [18F]FDG high volume ([18F]FDG HV) with an SUV > 50% of the SUVmax. We report the mean± standard deviation.
Results. PET/CT scans including 20 GTVprim and 12 GTVlnwere analysed. There was a significant correlation between several [18F]FDG and [18F]HX4 parameters, the most pronounced being the correlation between [18F]FDG HV and [18F]HX4 HV (R = 0.93, p < 0.001). The fraction of the GTVprim with a high HX4 uptake (9 ± 10%) was on average smaller than the FDG high fraction (51 ± 26%; p < 0.001). In 65% (13/20) of the patients, the GTVprim was hypoxic. In four of these patients the [18F]HX4 HV was located within the [18F]FDG HV, whereas for the remaining nine GTVprim a partial mismatch was observed. In these nine tumours 25 ± 21% (range 5–64%) of the HX4 HV was located outside the FDG HV.
Conclusions. There is a correlation between [18F]HX4 and [18F]FDG uptake parameters on a global tumour level. In the majority of lesions a partial mismatch between the [18F]HX4 and [18F]FDG high uptake volumes was observed, therefore [18F]FDG PET imaging cannot be used as a surrogate for hypoxia. [18F]HX4 PET provides complementary information to [18F]FDG PET imaging.
Tumour cell hypoxia decreases the effectiveness of anti-cancer treatment (i.e. surgery, radiotherapy and systemic treatment) and increases tumour aggressiveness in a number of solid tumours [Citation1]. Tumour cell hypoxia is present in the majority of head and neck squamous cell carcinomas (HNSCC) and can be visualised and quantified using positron emission tomography (PET) imaging [Citation2,Citation3]. This non-invasive imaging technique provides the opportunity to perform repeated tumour hypoxia measurements of the entire tumour, and gives important information to predict locoregional control and survival [Citation4,Citation5].
3-[18F]fluoro-2-(4-((2-nitro-1H-imidazol-1-yl)methyl)-1H-1,2,3-triazol-1-yl)propan-1-ol ([18F]HX4) is a hypoxia PET tracer used to visualise and quantify tumour hypoxia. In previous pre-clinical studies, [18F]HX4 was validated as a hypoxia tracer and the repeatability of the tracer uptake was assessed [Citation6,Citation7]. In addition, in patients with non-small cell lung cancer (NSCLC), [18F]HX4 was found to provide additional information with respect to the metabolic PET tracer [18F]FDG [Citation8].
[18F]FDG PET imaging is the most frequently used molecular imaging modality in clinical practice to detect and stage malignancies. Subvolumes of the tumour displaying a high glucose metabolism as identified by [18F]FDG PET were shown to often be the source of a local recurrences after (chemo)radiotherapy in NSCLC and HNSCC [Citation9,Citation10].
The uptake of [18F]FDG is dependent on the rate of glycolysis and the upregulation of glucose transporters [Citation11]. In the absence of oxygen, cells undergo several biological responses. Hypoxic tumours require an increased glycolysis to survive. In addition the hypoxia-inducible-factor 1α pathway is activated, which can causes an upregulation of the glucose transporters [Citation1]. This might indicate a relationship between hypoxia and metabolism. Nevertheless, most cancer cells produce energy by a high rate of aerobic glycolysis, independent of the presence of oxygen, the ‘Warburg effect’ [Citation12]. Multiple cellular pathways can lead to the glycolytic phenotype, therefore an altered glucose metabolism can also be observed without hypoxia [Citation11].
The aim of this study was to characterise the relationship between the PET tracers [18F]FDG (glucose metabolism) and [18F]HX4 (hypoxia) in the primary tumour and metastatic lymph nodes of patients with HNSCC. We evaluate the tracer uptake on a global tumour level and assess the spatial overlap between the high uptake volumes of both PET tracers.
Material and methods
Patients
[18F]FDG and [18F]HX4 PET/CT images of 20 patients (17 male, three female) with a locally advanced HNSCC were acquired before the start of external beam (chemo)radiotherapy. The average age of the patients was 60 years (range 45–77 years). Tumour stages were; cT1-4, cN0-2b and cM0, with a stage grouping from II-IVA, located in the larynx (N = 8), oropharynx (N = 7) and hypopharynx (N = 5). The study was approved by the Ethical Review Committee of Maastricht University Medical Centre and registered on clinicaltrial.gov (NCT01347281). All patients provided written informed consent before study entry.
PET/CT imaging
[18F]HX4 was produced as described previously [Citation6,Citation13]. After intravenous administration of an average (± SD) dose of 378 ± 84 MBq [18F]HX4, PET/CT imaging was performed at four hours post-injection (p.i.) for 20 minutes in a single bed position. The injected activity of [18F]FDG was based on the patient's bodyweight according to the national guidelines [Citation14]. Patients fasted for at least six hours before the intravenous administration of [18F]FDG and blood glucose levels were measured. Imaging was performed one hour after the injection of [18F]FDG with a scan duration of five minutes per bed position.
[18F]HX4 and [18F]FDG PET/CT scans were performed in radiotherapy position, with the patient positioned on a flat table top using an immobilisation mask and a movable laser alignment system. Image acquisitions were performed on the same PET/CT scanner (Biograph 40, Siemens Healthcare, Erlangen, Germany); scatter and attenuation correction were applied; and PET images were reconstructed using OSEM 2D (Ordered Subset Expectation Maximization, four iterations, eight subsets) and a Gaussian filter of 5 mm. The median interval between both PET scans was seven days (range 4–28 days).
Image analysis
The gross tumour volume of the primary tumour (GTVprim) and involved lymph nodes (GTVln), were delineated on the [18F]FDG PET/CT, by two experienced radiation oncologists in consensus. The [18F]FDG CT was rigidly registered to the [18F]HX4 CT. The same transformation was subsequently applied to the [18F]FDG PET scan and the GTVs to co-register all images and contours.
The maximum and mean standardised uptake values (SUVmax and SUVmean), were determined within the GTVprim and GTVln on the [18F]FDG and [18F]HX4 PET scans. For the [18F]HX4 PET scans, the maximum tumour-to-muscle ratio (TMRmax) was additionally calculated, being the SUVmax in the tumour divided by the SUVmean in the trapezius muscles. The volume of interest in the trapezius muscles (left and right) were delineated on multiple slices of the CT scan. Subsequently, the [18F]HX4 high fraction ([18F]HX4 HF) and [18F]HX4 high volume ([18F]HX4 HV) were defined as the fraction/volume of the GTV with a TMR > 1.4. The [18F]FDG high fraction ([18F]FDG HF) and [18F]FDG high volume ([18F]FDG HV) were calculated using the fraction/volume of the GTV with an SUV above 50% of the SUVmax, based on the ongoing clinical trials applying an [18F]FDG PET radiation dose redistribution [Citation15,Citation16].
In addition, a voxel-wise comparison of the [18F]FDG and [18F]HX4 uptake within the GTVprim and GTVln was performed and DICE similarity coefficients were calculated using:
Statistical analysis
For all parameters mean ± 1 standard deviation (SD) are reported. To evaluate correlations between the tumour volume and [18F]HX4 and [18F]FDG imaging parameters, and to quantify the voxel-wise comparison of the [18F]HX4 and [18F]FDG uptake, linear regressions were performed and Pearson's correlation coefficients were calculated. A Wilcoxon-signed rank test was performed to evaluate a significant difference between the high uptake volumes. A p-value < 0.05 was assumed to be statistically significant.
Results
In this study we analysed the [18F]FDG and [18F]HX4 uptake in the primary tumour and lymph nodes of 20 patients with HNSCC before the start of (chemo)radiotherapy. and provide examples of included patients. We detected tumour hypoxia in 13/20 of the primary tumours and 9/12 of metastatic lymph nodes. The [18F]HX4 HV was therefore absent or smaller than the [18F]FDG HV for 18/20 primary lesions and 9/12 involved lymph nodes (p < 0.001). The average values of the GTV, [18F]FDG and [18F]HX4 parameters are shown in .
![Figure 1. Good spatial overlap between [18F]FDG and [18F]HX4 uptake in a patient with a cT3N0M0 laryngeal carcinoma prior to start of radiotherapy. The interval between both scans was 8 days.](/cms/asset/f8447600-26d8-4e08-8cb7-58631f327ada/ionc_a_1062913_f0001_oc.jpg)
![Figure 2. [18F]FDG and [18F] uptake in a patient with a cT2N2bM0 squamous cell carcinoma of the oropharynx. Even though both metastatic lymph nodes are highly [18F]FDG avid, only the lower lymph node (red arrow) also shows high [18F]HX4 PET uptake, whereas the other lymph node does not (white arrow). The interval between both scans was 5 days.](/cms/asset/503ecd92-eab7-4768-9eeb-8aee8e0e6803/ionc_a_1062913_f0002_oc.jpg)
Table I. [18F]FDG and [18F]HX4 uptake parameters (mean± SD) for the primary lesions (GTVprim) and involved lymph nodes (GTVln).
Overall correlation of [18F]FDG and [18F]HX4 parameters
Potential correlations between tumour volume, [18F]FDG and [18F]HX4 PET-based parameters were investigated (; ). Combining the parameters from both GTVprim and GTVln we observed a significant correlation between the volume of the lesion and the [18F]HX4 parameters SUVmax (R = 0.39, p = 0.03), TMRmax (R = 0.62, p < 0.001), [18F]HX4 HF (R = 0.52, p < 0.01) and [18F]HX4 HV (R = 0.87, p < 0.001). Also all [18F]FDG parameters were significantly correlated with the tumour volume. A significant correlation was observed between all [18F]HX4 parameters and the [18F]FDG SUVmean, SUVmax and [18F]FDG HV, with the most pronounced correlation between [18F]HX4 HV and [18F]FDG HV (R = 0.93, p < 0.001).
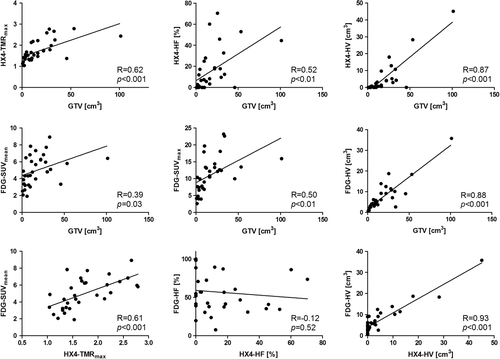
Table II. Pearson's correlation coefficient (R) and corresponding p-values of the [18F]FDG and [18F]HX4 PET parameters from both the primary lesions and involved lymph nodes.
Spatial relationship between [18F]FDG and [18F]HX4 uptake
A visual representation of the [18F]FDG and [18F]HX4 high uptake fractions for each individual patient are given in (GTVprim) and Supplementary Figure 1 (available online at http://www.informahealthcare.com/doi/abs/10.3109/0284186X.2015.1062913) (GTVln).
![Figure 4. Visual representation of the overlap of [18F]FDG high fraction (blue) and [18F]HX4 high fraction (red) of the primary tumour (black) of all patients. The range of the [18F]FDG high fraction is from 8% (patient 18), to 100% (patient 6). The range of the [18F]HX4 high fraction is from 0% (Patient 4, 5, 6, 9, 14, 19 and 20) to 33% (Patient 11).](/cms/asset/44011c79-7b25-4aee-bf6c-c03c620417de/ionc_a_1062913_f0004_oc.jpg)
Of the 20 GTVprim, seven lesions showed no tumour hypoxia. In four lesions, the [18F]HX4 HV was entirely located within the [18F]FDG HV, whereas for the remaining nine lesions a partial mismatch between the [18F]HX4 and [18F]FDG high uptake volumes was found. In these nine lesions, 25 ± 21% (range 5–64%) of the HX4 HV was located outside the FDG HV.
Of the 12 metastatic lymph nodes, three showed no tumour hypoxia, in three other lesions the [18F]HX4 HV was within the [18F]FDG HV, whereas for the other six lymph node regions a partial mismatch was observed. In these six lesions, 21 ± 11% (range 6–37%) of the HX4 HV was located outside the FDG HV.
To compare the spatial distribution of the tracer uptake, an uptake level above background is essential in both PET scans. Therefore the results of the voxel-wise comparison and DICE calculations are provided only for the lesions with observed tumour hypoxia (GTVprim; N = 13, GTVln; N = 9). The voxel-wise comparison of the [18F]HX4 and [18F]FDG uptake within the GTVs showed a large diversity for the primary lesion (R = 0.47 ± 0.31, range 0.04 to 0.85; Supplementary Figure 2, available online at http://www.informahealthcare.com/doi/abs/10.3109/0284186X.2015.1062913), whereas a good correlation was observed for the lymph nodes (0.73 ± 0.12, range 0.59–0.91). For GTVprim the average DICE similarity coefficient was 0.38 ± 0.22, with a range from 0.04 (Patient 7) to 0.78 (Patient 11; ). For GTVln the average DICE was 0.57 ± 0.32, with a range from 0.10 (Patient 11) to 0.88 (Patient 5; ). Note that the small DICE coefficients were observed due to large differences in [18F]HX4 and [18F]FDG high volumes.
For the hypoxic lesions, we observed no relationship between the interval of both scans and the voxel wise correlation coefficients for GTVprim (R = 0.11, p = 0.72) and GTVln (R = 0.46, p = 0.22). Also no correlation was observed between the time interval and the DICE of GTVprim (R = 0.17, p = 0.57) however there was a significant correlation between the time interval and the DICE coefficient of GTVln (R = −0.83, p < 0.01).
Discussion
In this study we characterised the relationship between the PET tracers [18F]FDG (glucose metabolism) and [18F]HX4 (hypoxia) in patients with HNSCC. First, the relationship between the general [18F]FDG and [18F]HX4 uptake parameters were evaluated. Second, we assessed the similarity in spatial uptake pattern between [18F]FDG and [18F]HX4 PET imaging.
On a general tumour level we observed a relationship between tumour volume, [18F]FDG and [18F]HX4 uptake parameters. These results are in agreement with the previous published research, which also observed a moderate correlation between [18F]FMISO PET and [18F]FDG PET uptake parameters [Citation17,Citation18]. Conversely, no correlation between [18F]FDG PET imaging and pO2 polarography or HIF-1α staining was reported previously [Citation17,Citation18]. Therefore, although we found a correlation between [18F]FDG and [18F]HX4 PET uptake, they both represent different biological properties of tumours, which can be useful to predict treatment response. Several studies in patients with head and neck cancer have shown that hypoxia PET imaging is superior to [18F]FDG PET imaging for the prediction of treatment response [Citation18,Citation19]. However, Thorwarth et al. [Citation20] showed that a combination of both imaging modalities has the highest potential to predict treatment success.
In our study we observed that in the majority of HNSCC patients the hypoxic volume was smaller than the high metabolic tumour volume. This is in agreement with the results we previously reported in patients with NSCLC [Citation8]. This might allow a radiotherapy dose escalation to the smaller hypoxic tumour volume. At the moment an ongoing randomised phase III clinical study ‘adaptive radiation treatment for head and neck cancer’ (ARTFORCE; NCT01504815), investigates the effect of an [18F]FDG PET-based radiation dose redistribution, on the locoregional control in patients with HNSCC. In addition, several radiotherapy planning studies have shown that it is technically feasible to perform radiotherapy dose escalation based on hypoxia PET imaging without increasing the dose to the normal tissue [Citation21–23]. Nevertheless, the most essential knowledge we need, is whether the hypoxic or metabolic volume is related to recurrences after treatment. This might indicate whether the hypoxic, metabolic or a combination of both volumes should be used in the adaptation of the radiation dose, with the aim to maximise the therapeutic ratio for each individual patient [Citation24]. Dirix et al. [Citation25] showed, for example that all recurrences after chemoradiotherapy (N = 9) were located within the high metabolic regions, however three of these recurrences were located outside the hypoxic volume. Due et al. [Citation10], however, report that only 54% of the recurrences were located within the visually defined high metabolic area, while 96% of the recurrences were located within the clinical target volume (CTV; GTV with a 1 cm margin). This literature evidence prompted us to be careful redistributing the dose within the CTV. Therefore, also alternative methods to decrease tumour hypoxia by the aid of hypoxia targeting or hypoxia-modification should be further explored. In these studies hypoxia PET imaging could be used to monitor the response to this treatment and stratify patients based on their pre-treatment hypoxic status.
This study has several limitations. First, there was a time interval between the [18F]FDG and [18F]HX4 PET/CT scans, in which changes in tumour metabolism or hypoxia may have occurred. We observed a relationship between the time interval and DICE coefficient of the GTVln, which might indicate that a shorter time interval could improve the spatial correlation between the [18F]FDG and [18F]HX4 uptake. However, this was not observed for the voxel-wise correlation coefficients. For most of the patients the time interval was small (median: seven days) and no interventions were performed between both scans. Second, small lesions were also included in the analysis. Small lesions are prone to present only a limited amount of tumour hypoxia. In addition, in these lesions the partial volume effect plays a larger role, causing an underestimation of the absolute uptake. This might influence the correlation between the tumour volume and the [18F]HX4 and [18F]FDG uptake measurements. Third, the thresholds to define a [18F]HX4 or [18F]FDG high uptake were defined based on previous literature and ongoing clinical trials, a change in this definition will influence the results. However, based on the results of our previous study in patients with NSCLC, we can state that the mismatch between high [18F]HX4 and high [18F]FDG volumes is relative stable for different thresholds [Citation8].
In conclusion, there is a positive correlation between [18F]HX4 and [18F]FDG uptake parameters on a global tumour level. On average, the [18F]HX4 HV is smaller than the [18F]FDG HV. In the majority of lesions a partial mismatch between the [18F]HX4 and [18F]FDG high uptake volumes was observed, therefore [18F]FDG PET imaging cannot be used as a surrogate for hyopxia. [18F]HX4 PET imaging provides complementary information to [18F]FDG PET imaging.
Supplementary material available online
Supplementary Figure 1 and 2 available online at http://www.informahealthcare.com/doi/abs/10.3109/0284186X.2015.1062913
ionc_a_1062913_sm4445.zip
Download Zip (266.6 KB)Acknowledgements
The authors like to thank the patients who agreed to participate to this study and the PET-CT group, data-management (Anita Botterweck) and trial-poli (Claudia Offermann and John Paulissen) of MAASTRO clinic for their contribution to the data acquisition. Authors acknowledge financial support from the QuIC-ConCePT project, which is partly funded by EFPI A companies and the Innovative Medicine Initiative Joint Undertaking (IMI JU) under Grant Agreement No. 115151. Authors also acknowledge financial support from EU 7th framework program (EURECA, ARTFORCE – no. 257144, REQUITE – no. 601826), Kankeronderzoekfonds Limburg from the Health Foundation Limburg and the Dutch Cancer Society (KWF MAC 2011-4970).
Declaration of interest: The authors report no conflicts of interest. The authors alone are responsible for the content and writing of the paper.
References
- Harris AL. Hypoxia – a key regulatory factor in tumour growth. Nat Rev Cancer 2002;2:38–47.
- Horsman MR, Mortensen LS, Petersen JB, Busk M, Overgaard J. Imaging hypoxia to improve radiotherapy outcome. Nat Rev Clin Oncol 2012;9:674–87.
- Troost EG, Schinagl DA, Bussink J, Boerman OC, van der Kogel AJ, Oyen WJ, et al. Innovations in radiotherapy planning of head and neck cancers: Role of PET. J Nucl Med 2010;51:66–76.
- Peeters SG, Zegers CM, Yaromina A, Van Elmpt W, Dubois L, Lambin P. Current preclinical and clinical applications of hypoxia PET imaging using 2-nitroimidazoles. Q J Nucl Med Mol Imaging 2015;59:39–57.
- Zips D, Zophel K, Abolmaali N, Perrin R, Abramyuk A, Haase R, et al. Exploratory prospective trial of hypoxia-specific PET imaging during radiochemotherapy in patients with locally advanced head-and-neck cancer. Radiother Oncol 2012;105:21–8.
- Dubois LJ, Lieuwes NG, Janssen MH, Peeters WJ, Windhorst AD, Walsh JC, et al. Preclinical evaluation and validation of [18F]HX4, a promising hypoxia marker for PET imaging. Proc Natl Acad Sci U S A 2011;108: 14620–5.
- Peeters SG, Zegers CM, Lieuwes NG, van Elmpt W, Eriksson J, van Dongen GA, et al. A comparative study of the hypoxia PET tracers [(18)F]HX4, [(18)F]FAZA, and [(18)F]FMISO in a preclinical tumor model. Int J Radiat Oncol Biol Phys 2015;91:351–9.
- Zegers CM, van Elmpt W, Reymen B, Even AJ, Troost EG, Ollers MC, et al. In vivo quantification of hypoxic and metabolic status of NSCLC tumors using [18F]HX4 and [18F]FDG PET/CT imaging. Clin Cancer Res 2014;20:6389–97.
- Aerts HJ, van Baardwijk AA, Petit SF, Offermann C, Loon J, Houben R, et al. Identification of residual metabolic-active areas within individual NSCLC tumours using a pre-radiotherapy (18)Fluorodeoxyglucose-PET-CT scan. Radiother Oncol 2009; 91:386–92.
- Due AK, Vogelius IR, Aznar MC, Bentzen SM, Berthelsen AK, Korreman SS et al. Recurrences after intensity modulated radiotherapy for head and neck squamous cell carcinoma more likely to originate from regions with high baseline [18F]-FDG uptake. Radiother Oncol 2014;111:360–5.
- Gatenby RA, Gillies RJ. Why do cancers have high aerobic glycolysis? Nat Rev Cancer 2004;4:891–9.
- Vander Heiden MG, Cantley LC, Thompson CB. Understanding the Warburg effect: The metabolic requirements of cell proliferation. Science 2009;324:1029–33.
- van Loon J, Janssen MH, Ollers M, Aerts HJ, Dubois L, Hochstenbag M, et al. PET imaging of hypoxia using [18F]HX4: A phase I trial. Eur J Nucl Med Mol Imaging 2010;37: 1663–8.
- Boellaard R, Oyen WJ, Hoekstra CJ, Hoekstra OS, Visser EP, Willemsen AT, et al. The Netherlands protocol for standardisation and quantification of FDG whole body PET studies in multi-centre trials. Eur J Nucl Med Mol Imaging 2008;35:2320–33.
- Heukelom J, Hamming O, Bartelink H, Hoebers F, Giralt J, Herlestam T, et al. Adaptive and innovative Radiation Treatment FOR improving Cancer treatment outcomE (ARTFORCE); a randomized controlled phase II trial for individualized treatment of head and neck cancer. BMC Cancer 2013;13:84.
- van Elmpt W, De Ruysscher D, van der Salm A, Lakeman A, van der Stoep J, Emans D, et al. The PET-boost randomised phase II dose-escalation trial in non-small cell lung cancer. Radiother Oncol 2012;104:67–71.
- Zimny M, Gagel B, DiMartino E, Hamacher K, Coenen HH, Westhofen M, et al. FDG – a marker of tumour hypoxia? A comparison with [18F]fluoromisonidazole and pO2-polarography in metastatic head and neck cancer. Eur J Nucl Med Mol Imaging 2006;33:1426–31.
- Sato J, Kitagawa Y, Yamazaki Y, Hata H, Okamoto S, Shiga T, et al. 18F-fluoromisonidazole PET uptake is correlated with hypoxia-inducible factor-1alpha expression in oral squamous cell carcinoma. J Nucl Med 2013;54:1060–5.
- Komar G, Lehtio K, Seppanen M, Eskola O, Levola H, Lindholm P, et al. Prognostic value of tumour blood flow, [(1)(8)F]EF5 and [(1)(8)F]FDG PET/CT imaging in patients with head and neck cancer treated with radiochemotherapy. Eur J Nucl Med Mol Imaging 2014;41:2042–50.
- Thorwarth D, Eschmann SM, Holzner F, Paulsen F, Alber M. Combined uptake of [18F]FDG and [18F]FMISO correlates with radiation therapy outcome in head-and-neck cancer patients. Radiother Oncol 2006;80:151–6.
- Hoeben BA, Bussink J, Troost EG, Oyen WJ, Kaanders JH. Molecular PET imaging for biology-guided adaptive radiotherapy of head and neck cancer. Acta Oncol 2013;52:1257–71.
- Toma-Dasu I, Uhrdin J, Antonovic L, Dasu A, Nuyts S, Dirix P, et al. Dose prescription and treatment planning based on FMISO-PET hypoxia. Acta Oncol 2012;51: 222–30.
- Chang JH, Wada M, Anderson NJ, Lim Joon D, Lee ST, Gong SJ, et al. Hypoxia-targeted radiotherapy dose painting for head and neck cancer using (18)F-FMISO PET: A biological modeling study. Acta Oncol 2013;52:1723–9.
- Grau C, Hoyer M, Alber M, Overgaard J, Lindegaard JC, Muren LP. Biology-guided adaptive radiotherapy (BiGART) – more than a vision? Acta Oncol 2013;52:1243–7.
- Dirix P, Vandecaveye V, De Keyzer F, Stroobants S, Hermans R, Nuyts S. Dose painting in radiotherapy for head and neck squamous cell carcinoma: Value of repeated functional imaging with (18)F-FDG PET, (18)F- fluoromisonidazole PET, diffusion-weighted MRI, and dyna mic contrast-enhanced MRI. J Nucl Med 2009;50:1020–7.