
ABSTRACT
Background. Gastrointestinal morbidity after radiotherapy (RT) for prostate cancer may be related to the biomechanical properties of the rectum. In this study we present a magnetic resonance imaging (MRI)-based method to quantitate the thickness and elasticity of the rectal wall in prostate cancer patients treated with RT.
Material and methods. Four patients previously treated with RT for prostate cancer underwent an MRI session with stepwise rectal bag deflation (from a maximum tolerable volume to 0 ml, in 50 ml steps), with a probe inserted inside the bag to monitor the internal rectal pressure. MRIs were acquired using Dixon sequences (4 mm axial slice thickness) at each deflation step. Rectal walls were defined from the recto-sigmoid junction to 3 cm above the anal canal as the space between the inner and outer wall surfaces. The wall thickness was determined and biomechanical properties (strain and stress) were calculated from the pressure measurements and the MRI-segmented rectal walls.
Results. The integral rectal pressure varied for the maximum tolerable volume (range 150–250 ml) across patients and ranged from 1.3 to 4.0 kPa (SD = 1.2 kPa). Wall thickness was found to vary between patients and also across different rectum segments, with a mean (SD) thickness for the different segments at the 50 ml distension volume of 1.8–4.0 (0.6) mm. Stress showed larger variation than strain, with mean (SD) values for the different segments ranging between 1.5 and 7.0 (1.5) kPa.
Conclusion. We have developed a method to quantify biomechanical properties of the rectal wall. The resulting rectal wall thickness, strain and stress differed between patients, as well as across different rectal wall sections. These findings could provide guidance in future predictive outcome modelling in order to better understand the rectal dose-volume response relationship.
External beam radiotherapy (RT) for prostate cancer may cause adverse effects in the adjacent healthy tissues, with gastrointestinal (GI) symptoms having a pronounced impact on patients quality of life [Citation1–3]. The adverse effect profiles are tightly connected to the doses received in the co-irradiated normal tissues. RT doses above 70 Gy have been shown to improve freedom from biochemical failure and disease-specific survival [Citation4–6]. Adverse effects related to GI morbidity are reported to occur in 5–23% of all prostate cancer survivors [Citation7], making the GI tract a tumour dose limiting organ [Citation8]. The dose delivered to the rectum could lead to changes in physiological and biomechanical properties [Citation9,Citation10]. These in turn may cause GI morbidity, such as increased stool frequency, incontinence, bleeding, mucous, pain and/or urgency [Citation11–13].
Normal rectal function involves functioning rectal motility, reservoir capacity and sphincter control, which may be altered by RT. The pathophysiology behind such RT-induced injuries is, however, not extensively understood [Citation14]. Typically, the risk of RT-induced GI morbidity is described by dose-volume parameters of the rectum [Citation7,Citation15–17]. Novel but less recognised approaches involve, e.g. addressing dose surface/wall distributions of the rectum [Citation18–20], and studying pathophysiological properties. For instance, Petersen et al. assessed changes in rectal mucosa, thickness and function of the anal sphincter by sigmoidoscopy, endoanal ultrasonography and anal manometry, respectively. They found that reduced rectal functionality was a result of combined RT damage of the anterior rectal wall and the anal canal [Citation9]. Krol et al. observed that RT reduces anal resting pressure and decreases rectal distensibility [Citation10], while Choi et al. recently identified patients with an increased risk of GI morbidity after RT by measuring anorectal pressure [Citation21]. Even though these studies based their findings on pressure-volume measurements and consequently exclude detailed spatial information [Citation22], they point in the same direction, towards an underlying relationship between biomechanical rectal properties and risk of RT-induced GI morbidity.
The aim of this study was to develop a method for quantification of the biomechanical rectal properties in patients treated with RT, by combining rectal distension and image-based assessment of the rectal thickness and derived biomechanical properties (strain and stress) of the rectal wall. These properties were assessed from repeat magnetic resonance imaging (MRI) scans while a bag was deflated stepwise inside the rectum and internal rectal pressure measurements were performed.
Material and methods
Patients
The four subjects selected for this study were the first to be analysed from a total of 26 men who participated in an anorectal physiology study [Citation9]. These men had previously been treated with primary external beam RT to 78 Gy (2 Gy/fraction) for localised prostate cancer at Aarhus University Hospital, Denmark, in 2005–2007. The original study included 309 men that completed a patient-reported questionnaire [Citation23]. All patients gave written consent and none of the subjects had contraindications to MRI. The Central Denmark Region Committees on Health Research Ethics (ID M-20100205) approved the study.
Pressure-volume distension, MRI acquisition and contouring
The probe consisted of an end-mounted bag over a 10 mm outer diameter and 30 cm long plastic tube containing a channel for pressure measurement and a channel for infusion and withdrawal of fluid into the bag. The pressure transducer was calibrated prior to the MRI acquisitions and the probe was passed into the rectum with the proximal edge of the bag placed 3 cm from the anal verge. For each patient, the bag was deflated manually from the maximum tolerable volume (using a visual analogue sensory scale) to 0 ml, in 50 ml steps. Further details on technical aspects of the rectal bag and pressure monitoring system are described in detail by Frøkjær et al. [Citation22]. With the patient in the prone position, an MRI scan was acquired prior to bag inflation and at every deflation step. The dedicated whole body MRI scanner had field strength of 1.5 Tesla (Ingenia 1.5 T, Philips Healthcare, Best, The Netherlands). Axial T2-weighted images were acquired using turbo spin echo with an echo time, TE = 100 ms, a repetition time, TR = 14000 ms, 200 × 200 mm2 field of view, 4 mm axial slice thickness and 512 × 512 pixels image size. At each deflation step, the pressure was monitored and stabilised before MRI acquisition, and the volume was maintained during each acquisition (approx. 2 minutes).
The rectum was defined from the recto-sigmoid junction to 3 cm from the distal anal canal surface. Rectal walls were segmented for each MRI scan by manually outlining the inner and outer walls, also the prostate was contoured (in the Eclipse v.11 treatment planning system, Varian Medical Systems, Palo Alto, CA, USA). Contours were reviewed by an experienced radiation oncologist. The inner and the outer surfaces of the wall were imported and processed in an in-house developed MATLAB script (MATLAB V. 2011, The MathWorks Inc., Natick, MA, USA). Surface points of the contours were aligned to the curved centre of axis, defined as the line connecting the centre of mass at each slice. These points were used as input to describe rectal deformations between deflation steps. Then, the three-dimensional (3D) surface was generated and surface irregularities were removed using a non-shrinking Gaussian smoothing algorithm. The geometric model and surface generation method are described in more detail elsewhere [Citation22,Citation24] (see Supplementary Material, available online at http://www.informahealthcare.com/doi/abs/10.3109/0284186X.2015.1066933).
Assessment and analysis of biomechanical parameters
At each distension volume, the wall thickness was assessed from the distance between points the inner and the outer surface of the rectum. The biomechanical parameters strain and stress (tension) were calculated from the deformable registration of two inner surfaces of two consecutive deflation step volumes together with pressure changes; in this study we limited the analysis to the two lowest distension volumes (0 and 50 ml) for each patient (although the smallest distension volume is referred to as 0 ml, the volume of the tube is already passed into the rectum). For each subject, the smallest distension volume was considered as reference, and registrations between the reference and the deformed volumes were computed using a 3D shape context method based on non-rigid image registration with full-field strain analysis [Citation25]. The thickness of the rectal wall was obtained as the Euclidean distance between matched surface points from the inner and outer walls. Under the assumption that the rectum is a thin-walled organ, with isotropic properties, tension and stress at each surface point of the deformed volume, was obtained by Laplace's Law as [Citation26]:
where Δp denotes the pressure difference between the deformed volume and reference volume, k1 and k2 are two principal curvatures of each surface point, T is the surface tension, h is the wall thickness and σ is the estimated stress. Details on the biomechanical properties computation are described by Liao et al. [Citation25].
2D maps were calculated to display each biomechanical parameter by digitally unfolding the rectum wall at the most posterior point of each contour. The data points were extracted from the re-sliced contour points lying on planes perpendicular to the curved centre of axis. 2D maps were generated for the prostate area [1 cm below and above the limits of the prostate ()]. The rectal wall was then divided into five different segments: three equally distributed for the longitudinal extent (lower, intermediate and upper part), and two for the dorsal-ventral extent (anterior and posterior part). Finally, we evaluated the biomechanical parameters for the different segments of the unfolded rectum surface including comparisons in the anterior and posterior, as well as in the cranio-caudal directions.
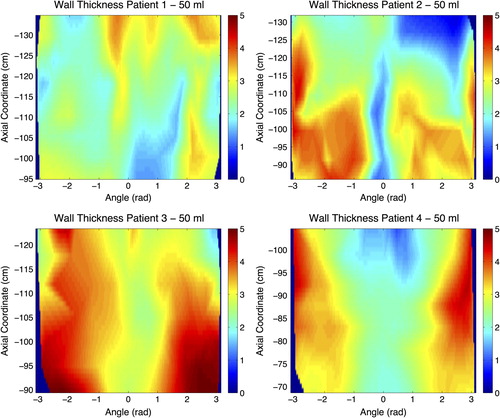
Figure 1. 2D maps for all patients illustrating the wall thickness (mm) for the 50 ml distension volume. Axial coordinate indicates the longitudinal position of the central point of each slice along the curved centre of axis, abscissa coordinate is the angular position from −π to π, where coordinate 0 corresponds to the most anterior point at the most caudal part of the surface.
Results
The maximum tolerable distension volume varied across patients. Patient 3 completed the entire series of five distension volumes, while Patients 1 and 4 completed all except the 250 ml distension volume, and Patient 2 completed 50 ml, 100 ml, and 150 ml (). Considering the maximum tolerable distension volume, the integral pressure varied across patients, ranging between 1.30 and 3.96 kPa (SD = 1.17 kPa; ). The cranio-caudal extent of the analysed segment of the rectum ranged between 34 and 46 mm (SD = 5.3 mm) across the patients. For the 50 ml distension volume, we found that the rectal wall thickness varied across different parts of the rectal wall and also across patients: upper part (mean: 1.8–3.7 mm), intermediate part (mean: 2.1–3.9 mm), lower part (mean: 2.2–4.0 mm), anterior part (mean: 2.0–3.9 mm) and posterior part (mean: 2.0–3.9 mm) (). These variations are shown for each point of the rectal wall as 2D maps for all patients and segments in . In particular, the anterior segment of the rectal wall was thicker compared with the posterior segment of the wall for Patient 2 (3.0 vs. 2.5 mm), Patient 3 (3.9 vs. 3.1 mm), and Patient 4 (3.4 vs. 2.0 mm); however there was almost no difference for Patient 1 (2.3 vs. 2.5 mm). In the longitudinal extent we found variations with respect to rectal wall thickness across the three segments, with different patterns across patients.
Figure 2. Box plots for the four patients and the wall thickness measurements at the 50 ml distension volume, and for the five rectal segments analysed.
Table I. Pressure at each distension value for the 4 patients analysed, values missing correspond with non-tolerable distension volumes for the specific patient.
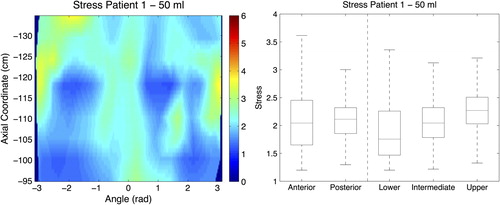
Strain across the different wall segments varied as well, but the patterns of variation differed between patients (). We found the lowest stress values for Patient 1, and the highest values for Patient 3 (c.f. 2D maps in ). We also found a wide range of variation in stress between different segments within a specific patient, and between patients. Among all studied biomechanical properties, stress had the largest variation across patients and different segments within the same patient. The mean stress values ranged between 1.5 and 7.0 kPa for the different segments analysed.
Figure 3. (Left panel) 2D map of strain for the 50 ml distension volume. Axial coordinate indicates the longitudinal position of the central point of each slice along the curved centre of axis, abscissa coordinate is the angular position from -π to π, where coordinate 0 corresponds with the most anterior point at most caudal part of the analysed surface. (Right panel) Box plot for the strain measurements at the 50 ml distension volume, and for the five rectal segments analysed.
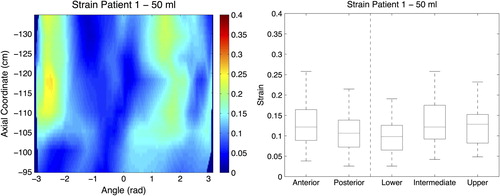
Figure 4. (Left panel) 2D map of stress for the 50 ml distension volume. Axial coordinate indicates the longitudinal position of the central point of each slice along the curved centre of axis, abscissa coordinate is the angular position from −π to π, where coordinate 0 corresponds with the most anterior point at most caudal part of the analysed surface. (Right panel) Box plot for the stress measurements at the 50 ml distension volume, and for the five rectal segments analysed.
Discussion
In this study we presented a method to calculate 3D distributions of rectal wall thickness, strain and stress based on rectal wall surfaces segmented from repeat MRI acquisitions with varying rectal bag volume distensions. We found variations in these properties across patients but also spatial variations within the investigated segments of the rectal wall.
The present MRI-based method determines physical properties related to elasticity of the rectal wall in 3D post-RT of prostate cancer. To explain GI morbidity as a function of differences in biomechanical properties after prostate cancer RT, previous studies have measured scalar physical properties of the anorectal region, such as pressure/distension [Citation9,Citation21]. Despite the lack of spatial information, these studies found that functional and structural anorectal changes occurring after RT originate from mucosa alterations or fibrotic changes and inflammation, which might be revealed as structural properties variations. With our 3D image-based approach, we found that the biomechanical rectal properties investigated differed not only across the rectum for the same patient but also across patients. Assessing the wall thickness, we found different patterns of variation across patients. Also, we found that strain and stress varied between the anterior and the posterior segment of the rectum wall, as well as in the cranio-caudal direction. The heterogeneity across patients and segments of the rectal wall could reflect the underlying RT-induced GI morbidity as some patients had indicated many problems whereas others had not reported problems. However, a larger study is needed to test this hypothesis. Our method allowed us to study patient-to-patient variability and also variability across the rectum. As previously suggested for RT dose and volume [Citation7,Citation15,Citation16], these results exemplify a spatial dependence also for biomechanical properties of the rectum, which could motivate inclusion of such properties into predictive dose- response modelling for GI morbidity.
Across patients and analysed segments we found that the variation in rectal thickness was within 1.5 mm. Thickness may be influenced by delineation and may also be affected by image resolution and the axial thickness (4 mm) due to surface reconstruction and re-slicing processes. In further investigations of the larger patient cohort we will relate the MRI-based biomechanical properties to more conventional (scalar) physiological measurements, thereby also disclosing to which degree the changes seen with MRI are attributable to contour acquisition uncertainties (image resolution and contouring). Furthermore, the definition of the lower part of the rectum as 3 cm from the distal anal canal surface may include the upper part of anal canal for some patients due to inter-patient variation of anal canal length. In a previous study, Frøkjær et al. [Citation22] found inhomogeneous 3D distributions of the wall thickness across the analysed subjects, with a decrease in the average wall thickness for distension volume increments. This previous study was based on an automatic rectal wall detection algorithm, and performed on healthy volunteers, which may explain the differences in thickness and rectal biomechanical properties respect to both, the aforementioned study and across patients.
The present study is based on a cross-sectional image assessment of wall thickness and biomechanical properties of the rectum. The study was performed several years after RT, which addresses late/chronic GI morbidity. This method also requires a considerable MRI scanner availability due to large acquisition times (30–40 minutes), which could have some limitations in the daily clinical routine. Future studies will help to identify the best volume range for this kind of study and analysis. It should be feasible to reduce the experiments to 2–3 volume levels resulting in reduced scanning time. Furthermore, the distension protocol has be to be carefully considered since factors, such as tissue preconditioning, strain softening, and viscoelasticity, must be considered. These factors are mechanical features of GI tissue [Citation27].
Strain accounts for displacements of the wall voxels between the two distension volumes, meaning that segments with high strain are predisposed for being deformed for a specific distension. However, stress and wall thickness are related to the tolerance/resistance of being deformed/elongated. This suggests that regions receiving higher doses (anterior wall of the rectum) are more prone to develop changes in biomechanical properties, which may be associated with different functional disorders [Citation9,Citation10,Citation21]. We studied rectal wall features for the anterior and posterior segment, as well as for three segments in the longitudinal extent and found different patterns of variations. This could be due to correlations between RT dose and thickness and biomechanical properties, as the anterior wall typically receives higher doses than the posterior part, or due to different segments of the rectum are more prone to the development of particular symptoms [Citation28,Citation29].
Future work will be devoted to investigations between delivered RT dose to the rectal wall, variations in the biomechanical parameters, and GI symptom profiles as assessed post-RT in the complete series of patients. As RT dose in the rectal wall is affected by the anatomical organ disposition, we hypothesise that the RT dose is likely to differ between patients and along different parts of the rectum. Classical approaches to evaluate the dose delivered to the rectum following prostate cancer RT are typically based on dose-volume parameters [Citation7,Citation15,Citation16]. However, there is growing interest in the use of dose surface histograms, which represent the dose to the rectum in a 2D map by unfolding the contours of the rectal wall [Citation30,Citation31]. With such an approach it could be possible to disclose biomechanical properties for particular locations of rectal wall involved in the development of GI morbidity [Citation28,Citation29], which could potentially be used to better explain differences in terms of RT-induced damage across patients and across segments. Digital unfolding methods are well known to be affected by distortions; for this particular study, the analysis was focused on the prostate region, where rectum presents a straight disposition and the effect of distortions is negligible. As further steps will incorporate analysis of an enlarged rectum region as well as all available image sets (from the other deflation steps), the influence of the unfolding method on the 2D distributions will be considered.
In conclusion, our image-based method allows quantification of 2D biomechanical properties to the rectal wall in subjects having undergone RT for prostate cancer. We found indications of differences in biomechanical properties (strain and stress) and thickness of different rectal wall segments within and across patients. Future work being based on data from a larger cohort will disclose the usefulness of these differences for understanding and limiting RT-induced GI morbidity.
Supplementary material available online
Supplementary material Figure 1 to 5 and Table I available online at http://www.informahealthcare.com/doi/abs/10.3109/0284186X.2015.1066933
ionc_a_1066933_sm1233.pdf
Download PDF (16.8 MB)Acknowledgements
This work has been partially supported by the European Commission under the project Virtual Physiological Human (DR THERAPAT project) and by project 903959 from Karen Elise Jensens Foundation.
Declaration of interest: The authors report no conflicts of interest. The authors alone are responsible for the content and writing of the paper.
References
- Budäus L, Bolla M, Bossi A, Cozzarini C, Crook J, Widmark A, et al. Functional outcomes and complications following radiation therapy for prostate cancer: A critical analysis of the literature. Eur Urol 2012;61:112–27.
- Schaake W, Wiegman EM, de Groot M, van der Laan HP, van der Schans CP, van den Bergh ACM, et al. The impact of gastrointestinal and genitourinary toxicity on health related quality of life among irradiated prostate cancer patients. Radiother Oncol 2014;110:284–90.
- Pettersson A, Turesson I, Persson C, Johansson B. Assessing patients’ perceived bother from the gastrointestinal side effects of radiotherapy for localized prostate cancer: Initial questionnaire development and validation. Acta Oncol 2014;53: 368–77.
- Peeters STH, Heemsbergen WD, Koper PCM, van Putten WLJ, Slot A, Dielwart MFH, et al. Dose-response in radiotherapy for localized prostate cancer: Results of the Dutch multicenter randomized phase III trial comparing 68 Gy of radiotherapy with 78 Gy. J Clin Oncol 2006;24:1990–6.
- Kuban DA, Levy LB, Cheung MR, Lee AK, Choi S, Frank S, et al. Long-term failure patterns and survival in a randomized dose-escalation trial for prostate cancer. Who dies of disease? Int J Radiat Oncol Biol Phys 2011;79:1310–7.
- Heemsbergen WD, Al-Mamgani A, Slot A, Dielwart MFH, Lebesque J V. Long-term results of the Dutch randomized prostate cancer trial: Impact of dose-escalation on local, biochemical, clinical failure, and survival. Radiother Oncol 2014;110:104–9.
- Michalski J, Gay H, Jackson A, Tucker SL, Deasy JO. Radiation dose-volume effects in radiation-induced rectal injury. Int J Radiat Oncol Biol Phys 2010;76:S123–9.
- Michalski J, Yan Y, Watkins-Bruner D, Bosch WR, Winter K, Galvin JM, et al. Preliminary toxicity analysis of 3-dimensional conformal radiation therapy versus intensity modulated radiation therapy on the high-dose arm of the Radiation Therapy Oncology Group 0126 prostate cancer trial. Int J Radiat Oncol Biol Phys 2013;87:932–8.
- Petersen SE, Bregendahl S, Langschwager M, Laurberg S, Brock C, Drewes AM, et al. Pathophysiology of late anorectal dysfunction following external beam radiotherapy for prostate cancer. Acta Oncol 2014;53:1398–404.
- Krol R, Smeenk RJ, van Lin ENJT, Yeoh EEK, Hopman WPM. Systematic review: Anal and rectal changes after radiotherapy for prostate cancer. Int J Colorectal Dis 2014;29:273–83.
- Lund J-Å, Kaasa S, Wibe A, Widmark A, Fransson P. Late radiation effects to the rectum and anus after treatment for prostate cancer; validity of the LENT/SOMA score. Acta Oncol 2013;52:727–35.
- Syndikus I, Morgan RC, Sydes MR, Graham JD, Dearnaley DP. Late gastrointestinal toxicity after dose- escalated conformal radiotherapy for early prostate cancer: Results from the UK Medical Research Council RT01 trial (ISRCTN47772397). Int J Radiat Oncol Biol Phys 2010; 77:773–83.
- Barry AS, Dunne MT, Lyons CA, Finn MA, Moulton B, Taylor JC, et al. Temporal patterns of late bowel and bladder radiotherapy toxicity in a randomised controlled trial assessing duration of neo-adjuvant hormones in prostate cancer. Acta Oncol 2014;53:1390–7.
- Maeda Y, Høyer M, Lundby L, Norton C. Faecal incontinence following radiotherapy for prostate cancer: A systematic review. Radiother Oncol 2011;98:145–53.
- Fonteyne V, Sadeghi S, Ost P, Vanpachtenbeke F, Vuye P, Lumen N, et al. Impact of changing rectal dose volume parameters over time on late rectal and urinary toxicity after high-dose intensity-modulated radiotherapy for prostate cancer: A 10-years single centre experience. Acta Oncol 2015;54:854–61.
- Fonteyne V, Ost P, Vanpachtenbeke F, Colman R, Sadeghi S, Villeirs G, et al. Rectal toxicity after intensity modulated radiotherapy for prostate cancer: Which rectal dose volume constraints should we use? Radiother Oncol 2014;113: 398–403.
- Thor M, Apte A, Deasy JO, Muren LP. Statistical simulations to estimate motion-inclusive dose-volume histograms for prediction of rectal morbidity following radiotherapy. Acta Oncol 2013;52:666–75.
- Buettner F, Gulliford SL, Webb S, Sydes MR, Dearnaley DP, Partridge M. Assessing correlations between the spatial distribution of the dose to the rectal wall and late rectal toxicity after prostate radiotherapy: An analysis of data from the MRC RT01 trial (ISRCTN 47772397). Phys Med Biol 2009;54:6535–48.
- Munbodh R, Jackson A. Quantifying cell migration distance as a contributing factor to the development of rectal toxicity after prostate radiotherapy. Med Phys 2014;41:1–12.
- Lee R, Chan EK, Kosztyla R, Liu M, Moiseenko V. Dose-distance metric that predicts late rectal bleeding in patients receiving radical prostate external-beam radiotherapy. Phys Med Biol 2012;57:8297–307.
- Choi Y, Park W, Rhee P-L. Can anorectal manometry findings predict subsequent late gastrointestinal radiation toxicity in prostate cancer patients? Cancer Res Treat Epub 2015 Mar 13.
- Frøkjær JB, Liao D, Bergmann A, McMahon BP, Steffensen E, Drewes AM, et al. Three-dimensional biomechanical properties of the human rectum evaluated with magnetic resonance imaging. Neurogastroenterol Motil 2005;17:531–40.
- Petersen SE, Bentzen L, Emmertsen KJ, Laurberg S, Lundby L, Høyer M. Development and validation of a scoring system for late anorectal side-effects in patients treated with radiotherapy for prostate cancer. Radiother Oncol 2014; 111:94–9.
- Liao D, Frøkjær JB, Yang J, Zhao J, Drewes AM, Gilja OH, et al. Three-dimensional surface model analysis in the gastrointestinal tract. World J Gastroenterol 2006;12: 2870–5.
- Liao D, Zhao J, Gregersen H. A novel 3D shape context method based strain analysis on a rat stomach model. J Biomech 2012;45:1566–73.
- Liao D, Zhao J, Gregersen H. Regional surface geometry of the rat stomach based on three-dimensional curvature analysis. Phys Med Biol 2005;50:231–46.
- Gregersen H. Biomechanics of the gastrointestinal tract: New perspectives in motility research and diagnostics. London: Springer Science & Business Media; 2003.
- Buettner F, Gulliford SL, Webb S, Sydes MR, Dearnaley DP, Partridge M. The dose-response of the anal sphincter region – an analysis of data from the MRC RT01 trial. Radiother Oncol 2012;103:347–52.
- Stenmark MH, Conlon ASC, Johnson S, Daignault S, Litzenberg D, Marsh R, et al. Dose to the inferior rectum is strongly associated with patient reported bowel quality of life after radiation therapy for prostate cancer. Radiother Oncol 2014;110:291–7.
- Tucker SL, Cheung R, Dong L, Liu HH, Thames HD, Huang EH, et al. Dose-volume response analyses of late rectal bleeding after radiotherapy for prostate cancer. Int J Radiat Oncol Biol Phys 2004;59:353–65.
- Buettner F, Gulliford SL, Webb S, Partridge M. Modeling late rectal toxicities based on a parameterized representation of the 3D dose distribution. Phys Med Biol 2011;56: 2103–18.