
ABSTRACT
Background. Particle dose distributions are highly sensitive to anatomy changes in the beam path, which may lead to substantial dosimetric deviations. Robust planning and dedicated image guidance together with strategies for online decision making to counteract dosimetric deterioration are thus mandatory. We aimed to develop methods to quantify anatomical discrepancies as depicted by repeated computed tomography (CT) imaging and to test whether they can predict deviations in target coverage.
Material and methods. Dedicated software tools allowed for voxel-based calculations of changes in the water equivalent path length (WEPL) in beam directions. We prepared proton and carbon ion plans with different coplanar beam angle settings on a series of lung cancer patients, for which planning and localization CT scans under high frequency jet ventilation (HFJV) for tumor fixation were performed. We investigated the reproducibility of target coverage between the optimized and recalculated treatment plans. We then studied how different raster scan and planning settings influence the robustness. Finally, we carried out a systematic analysis of the variations in the WEPL along different coplanar beam angles to find beam directions, which could minimize such variations.
Results. The Spearman's correlations for the GTV ΔV95 and ΔV98 with the ΔWEPL for the proton plans with a 0° and −45° two-field configuration were 0.701 (p = 0.02) and 0.719 (p = 0.08), respectively. For beam configurations 0° and −90°, or 0° and + 45°, with lower ΔWEPL, the correlations were no significant. The same trends were observed for the carbon ion plans. Increased beam spot overlap reduced dosimetric deterioration in case of large ΔWEPL.
Conclusion. Software tools for fast online analysis of WEPL changes might help supporting clinical decision making of image guidance. Raster scan and treatment planning settings can help to compensate for anatomical deviations.
Proton and carbon ion therapy, due to the localized dose deposition of charged particles, can decrease the dose to organs at risk as demonstrated in planning comparison studies [Citation1–3]. However, their finite range renders particles more sensitive to changes in the radiological depth in the beam entrance channels. These changes originate from interfractional tumor movement and other anatomical deviations, such as residual positioning errors, tumor shrinkage during the radiotherapy course or fluctuations in patient weight [Citation4]. Such effects can cause clinically relevant alterations in the particle dose distribution [Citation5–8].
Respiratory movement poses a challenge to the application of particle therapy in the lung. Anatomical changes caused by respiration have been related to dosimetric fluctuations inside the target [Citation8,Citation9]. In scattered beam particle therapy, target coverage is typically ensured by extended lateral as well as distal and proximal margins [Citation10] and dedicated internal target volume (ITV) concepts [Citation5]. In scanned beam particle therapy, additional interplay between target motion and beam scanning exists. Therefore, a margin-based approach might not be sufficient to assure both planned target coverage and homogeneity. Specific means to counteract motion interplay effects have been developed such as gating, tracking, and re-scanning [Citation5]. Clinical applicability of such methods is currently under investigation. Alternatively, tumor fixation approaches might have a role in particle therapy for reduction of target motion as well as tissue density changes in the beam path [Citation5]. High frequency jet ventilation (HFJV) is a modality of mechanical ventilatory support, which utilizes a high respiratory rate and very small tidal volumes, preventing any movement of the tumor with respiration [Citation11]. Due to its invasive nature the method is limited to few dose applications.
In previous work we have investigated the reproducibility of the delivered proton dose for early stage non-small cell lung cancer (NSCLC) patients treated with photon radiosurgery under HFJV [Citation12]. We have proven reproducible tumor fixation through HFJV, warranting excellent target coverage in the majority of investigated cases. However, for few tumors unacceptable dosimetric deviations were observed, illustrating the need for imaging prior to each dose delivery with dedicated protocols, together with the development of intervention thresholds based on the potential impact of anatomical discrepancies on the dose distribution [Citation12].
Current strategies for image guidance in particle therapy have been derived from photon techniques and usually rely on anatomical landmarks or fiducial markers to achieve geometrical tumor repositioning. The purpose of this study was therefore, to develop methods to quantify changes in tissue density and thickness in the beam entrance channels between planning and irradiation time. We analyzed such changes and checked their correlation with loss of target coverage in proton and carbon ion treatment plans. We aimed to investigate, how beam angles and different raster scan and planning settings influence plan robustness. A systematic study of the variations in water equivalent path length (WEPL) along different coplanar beam angles aimed to find beam directions which minimize such variations.
Material and methods
Patient data
We used datasets of a previously published cohort including 12 lung lesions [Citation11,Citation12]. Patients received one planning and one localization three-dimensional (3D) computed tomography (CT) scans, both performed under HFJV. Target volumes and organs at risk were delineated with the Pinnacle3 treatment planning system (TPS, version 8.0; Philips Radiation Oncology Systems, Best, The Netherlands) on both CT datasets for each patient. The planning target volume (PTV) was defined as the 5-mm isotropic expansion of the gross tumor volume (GTV). Automatic rigid coregistration of both CT datasets with three degrees of freedom was also performed with the Pinnacle3 system with a cross-correlation method.
Treatment planning
Scanned-beam proton and carbon ion treatment plans, optimized on the planning CT datasets, were prepared for each patient with the TRiP98 TPS (GSI Helmholzzentrum für Schwerionenforschung, Darmstadt, Germany) [Citation13–15]. Total prescribed dose was 33 Gy (absorbed dose). No optimization constraints were considered necessary due to the peripheral localization of all lesions. The angle convention in TRiP98 was used, in which the horizontal direction is represented by 0°, and the ventral and dorsal directions by -90° and 90°, respectively.
Proton plans had been previously calculated with two ipsilateral fields at 0° and + 45° (field configuration 2FA) [Citation12]. Additional two-field proton plans with different raster scan settings and with beam setups 0° plus + 90° (2FB), and 0° plus 45° (2FC) were calculated for this study. We applied the following standard settings for the proton plans with beam setups 2FB and 2FC: 3 mm grid spacing, 2 mm energy step, and 1.5 planning contour extension, relative to the beam spot full width at half maximum (FWHM). Carbon ion plans were prepared with each of the three two-field coplanar setups and, for the setup 2FA, with different raster scan settings.
Spot grid spacing was set to 3 mm for the proton plans and 2 mm for the carbon ion plans. Energy steps of 2 and 3 mm were tested. For carbon ions, a 3 mm ripple filter was used to spread the pristine Bragg peak to an in-depth width of 3 mm [Citation16]. A freedom was given to the TPS for placing spots laterally outside the PTV, the so-called virtual contour extension, in order to account for the dose fall-off at the lateral edges of the target. This parameter is implemented in TRiP98 in order to avoid dose hot spots on the PTV edges. Contour extension values were fixed to 0.9, 1.2, 1.5, or 1.8, relative to FWHM. A summary of the raster scan and planning settings used for the proton and carbon ion plans are presented in and , respectively.
Table I. Summary of planning settings, median (range) dosimetric indexes for the proton plans, and median (range) values of the calculated ∆WEPL plan in mm.
Table II. Summary of planning settings and median (range) dosimetric indexes for the carbon ion plans.
Single-field uniform dose (SFUD) optimization was used with a plain gradient optimization algorithm. For the proton planning we used realistic baseline data for a synchrotron-based facility with a reduced nozzle-to-isocenter distance to counteract spot size enlargement caused by the proton beam divergence [Citation17]. Actual plan delivery was simulated through plan recalculations on the coregistered localization CT scans. The behavior of the coverage preservation was analyzed for all created plans based on recomputations on the localization CT.
Image analysis (WEPL)
Hounsfield units (HU) of the planning and localization CT scans were converted to relative stopping power in water according to the default look-up table in TRiP98. The voxel-based differences in the WEPL along each beam path were calculated on the co-registered datasets. Statistical measures inside the PTV contour of the planning CT were calculated, namely, the average value of the WEPL and the mean absolute value of the local differences in the WEPL, referred to as ΔWEPL. More details of the WEPL calculation can be found in the Supplementary Materials (available online at http://informahealthcare.com/doi/abs/10.3109/0284186X.2015.1067716). The program dcm2trip was used to convert all patient DICOM datasets to the TRiP98 format [Citation18]. DVH and selected dosimetric indexes were extracted with the tool trip2png [Citation19]. Image analysis (coregistration and range calculations), data manipulation, statistical analysis and graphing were done with the software package R, version 2.15.0 [Citation20] and Python 2.7.3 [Citation21].
Plan evaluation
Optimized plans were considered clinically acceptable if the percentage of the PTV receiving at least 95% of the prescribed dose (V95) was 98% or more. The original and recomputed treatment plans were compared using dose distributions and dose-volume histograms (DVH). Coverage was evaluated with the V95 for the PTV in the optimized plans, as well as with the V95 and V98 for the GTV in both plans and recomputations. The conformity index (CI) at the 95% isodose level as defined by Paddick et al. [Citation22] was calculated for the PTV. The homogeneity index (HI) calculated as (D2%–D98%) was assessed for both the PTV and the GTV in the optimized plans as well as for the GTV in the recomputations.
Results
Dosimetric quality of the optimized plans
Proton plan versions with energy step of 2 mm and planning contour extension of at least 1.5, i.e. Hv2, Hv3, and Hv7, fulfilled the PTV coverage objective (i.e. PTV V95 of at least 98%) in all cases (). However, Hv7 was considered to have an excess contour extension of 1.8 and these plans were excluded from the analysis. For the plan versions with contour extensions of 0.9 and 1.2 (Hv5 and Hv4), or 1.5 with an energy step of 3 mm (Hv6), the PTV V95 remained below the acceptance objective for 12/12, 6/12 and 6/12 cases, respectively, and therefore these versions were also discarded. The analysis was restricted to proton plans with 8 mm spot nominal FWHM, 3 mm grid size and energy step of 2 mm, differing only in the beam configuration: Hv2, and Hv3. Changes in the field configuration alone resulted in small changes in conformity (Supplementary Table I, available online at http://informahealthcare.com/doi/abs/10.3109/0284186X.2015.1067716).
From 18 carbon ion plan versions with different raster scan and planning settings, 11 fulfilled the clinical acceptance criteria and were included in the analysis. Excess contour extensions of 1.5 were discarded. PTV V95 values for the 11 of 18 clinically accepted plan versions are displayed in . Versions C12v4 and C12v10, with the smallest tested contour extension of 0.9 (FWHM) provided a PTV V95 < 98% and >97.5% in 2/12 and 1/12 patients, respectively, which was considered clinically acceptable. and present a summary of the dosimetric coverage indexes for proton and carbon ion plans, respectively. All values of the homogeneity and conformity indexes for the proton as well as the carbon ion plans are listed in the Supplementary Tables I and II (available online at http://informahealthcare.com/doi/abs/10.3109/0284186X.2015.1067716).
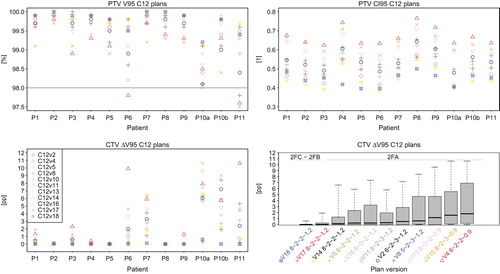
Figure 1. PTV V95 and CI95 for all prepared carbon ion plans (upper row), and GTV ΔV95 for each patient and each plan version with different planning and raster scan settings, as well as boxplots (median, 1st and 3rd quartiles, and range) for each plan version (lower row).
Influence of different raster scan settings for carbon ion plans
Qualitative comparison of all clinically approved carbon ion plan versions indicated that a larger contour extension led to better coverage preservation in presence of anatomical differences (). Attending at the raster scan settings, an enhanced beam spot overlap contributed as well to this effect: use of larger spot sizes (8 and 6 mm), as well as the lower values of grid size (2 mm) and energy step (2 mm) led to improved GTV ΔV95.
A multivariate analysis of the influences of the different parameters on the dosimetric coverage loss for the subset of approved carbon ion plans showed that the best linear model explaining the fluctuations in the CTV ΔV95 was given by ΔWEPL, the PTV volume and the contour extension (R2 of 0.58, p < 0.05). ΔWEPL was the strongest predictor in this model (this parameter yielded R2 of 0.40, p < 0.05, in a univariate analysis). More details on the models can be found in the Supplementary Table IV (available online at http://informahealthcare.com/doi/abs/10.3109/0284186X.2015.1067716).
There are large differences in the behavior of GTV ΔV95 depending on the specific patient. An analysis done for the subset of plans with identical beam directions (2FA) showed a significant correlation of the maximum GTV ΔV95 value across approved plan versions with the ΔWEPL, with Spearman's r of 0.66, p = 0.02, (see , bottom left).
Variations in the ΔWEPL with beam angle
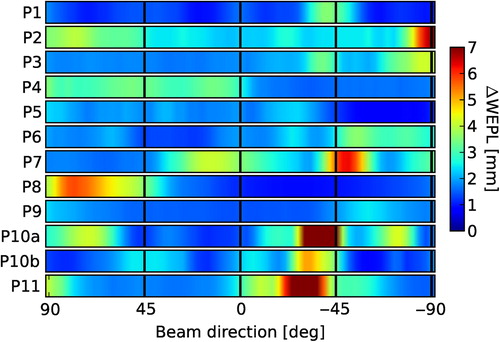
Due to the short extent of the localization CT in craniocaudal direction, this study was restricted to coplanar beam directions without couch rotation. The mean ΔWEPL values of the PTV in this patient cohort ranged from 25 to 88 mm in the lateral direction, and from 22 to 100 mm at −45°. Concerning the variability among patients, the lowest ΔWEPL averaged among all angles corresponds to Patient 1 with 1.5 ± 0.6 mm (mean with standard deviation), in opposition to Patient 10a, who shows a maximum averaged ΔWEPL of 3.6 ± 3.9 mm. For six patients the ΔWEPL reached values larger than 5 mm in specific beam directions. These high values concentrated for three patients at angles around the ventrolateral direction (−45°). Two of these specific patients presented considerable anatomical changes between the planning and localization CT in the beam entrance path. Therefore, the ΔWEPL reached extreme values of up to 10 and 19 mm. These changes were visually detectable in the CT co-registration. In the context of a particle therapy treatment, the necessity of set up corrections would have been evident without need of further image analysis. Nevertheless, we did not exclude these cases from the study as they helped us to test the WEPL calculation method. Examples of ΔWEPL values along selected beam directions are shown for two cases in . The results of systematic calculations of ΔWEPL for each patient for beam directions entering the patient ipsilaterally between dorsal and ventral in 3°-steps are displayed in .
Figure 2. ΔWEPL values in the isocenter PTV slice of two selected patient cases for four different field directions.
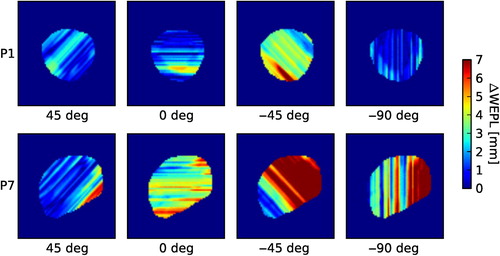
Figure 3. ΔWEPL values for each case of the cohort as a function of changing ipsilateral field directions between dorsal (90°) and ventral (− 90°).
Influence of the different beam angles in dose deterioration
Total ΔWEPL values for each plan were calculated as the averaged ΔWEPL for each beam direction. The Spearman's correlations for the ΔV95 and ΔV98 with the ΔWEPL for the proton plans with 2FA beam configuration were 0.701 (p = 0.02), and 0.719, (p = 0.08), respectively. Two patients presented extremely high GTV ΔV95 values motivated by WEPL discrepancies in the PTV of up to 4.6 mm. In these two cases, the beam setup 2FB reduced the GTV ΔV95% values to 1.3 and 0.0 pp, respectively. Better anatomical correspondence between planning and localization CT scans for the 2FB setup was also reflected in lower averaged ΔWEPL differences of 3.3 and 1.5 mm, respectively. The GTV ΔV95 and ΔV98 in median (range) was 0.0 (−0.3–3.5), and 1.0 (−0.8–13.2), respectively. The correlation between ΔV95 and ΔWEPL was not significant. New two-field plans were created with beam setup 2FC, i.e. with 0° and 45° beam directions. This beam setup showed generally low ΔWEPL values for all patients. This set of plans yielded median (range) ΔV95 and ΔV98 of 0 (−0.6–0.3) and 1.1 (−0.7–2.8) pp, respectively. Again, no significant correlation was found between ΔV95 nor ΔV98 and ΔWEPL (see ). The same trends were seen for the carbon ion plans, i.e. significant Spearman's correlations between ΔV95 and ΔV98 and average plan ΔWEPL for the 2FA beam setup of 0.85 and 0.81, respectively, and no significant correlation for the 2FB and 2FC beam configurations.
Figure 4. Spearman's r correlation values between GTV ΔV95 and ΔWEPL for the proton plans with beam setup 2FA (circles), 2FB (triangles), and 2FC (crosses).
Discussion
We implemented a method to quantify differences in the water equivalent path length (WEPL). A similar method based on calculation of WEPL changes have been used before by Mori et al. to quantify both intra- and interfractional range variations in the chest wall thickness [Citation8]. Casares et al. carried out an investigation to identify robust angles which minimize scanned-proton therapy dosimetric changes in the ITV within the breathing cycle, based on 4DCT images and under the hypothesis that no motion management strategy is applied [Citation9]. We tested our WEPL calculation method on a cohort of patients with lung lesions which were strictly immobilized using HFJV, and therefore effects of intrafractional motion (especially respiration) could be ignored. Treatment delivered in only one fraction also ruled out anatomical changes which typically occur during the course of fractionated irradiation treatments, such as weight loss. This enabled quantifying anatomical reproducibility in a static situation.
Even under such conditions, this study proved that large anatomical differences can occur. Large variations in the radiological depth significantly correlated with decrease in the coverage indexes. The selected patient cohort was treated with photon radiosurgery. Anatomical variations with little impact on photon dose distributions can cause large mis-dosages in a particle therapy scenario. In at least two patients, actions would have been required to correct for anatomical deviations in case of particle irradiation.
In the case of patient 2, good coverage was observed in the recomputations for all field configurations, although the corresponding ΔWEPL values were as large as 4.7 mm for a beam from the ventral direction. A visual comparison of the two CT images suggested that for this patient, the WEPL differences might arise from small-scale tissue differences within the PTV. These tissue differences could have compensated each other, resulting in good PTV coverage. Possibly, more sophisticated image analysis tools are required to quantify these effects.
In general in the ventrolateral direction larger anatomical differences can occur due to the arm mobility, and for this reason special care has to be taken when choosing this direction for irradiations of the chest. This needs to be taken into account in facilities with fixed oblique beamlines and consequently, reduced beam angle options. Planning settings such as contour extension and raster scan settings, such as beam spot and grid size and energy step, can affect dosimetric robustness, and increased beam spot overlap was found to help preserve target coverage. These results are consistent with previous results from Richter et al. which showed better plan robustness to residual motion if larger spot sizes are used, for the case of liver irradiation [Citation23].
The multivariate analysis showed that ΔWEPL alone can only explain a small fraction of the coverage loss. The PTV size plays a role since dosimetric deviations in a static tumor situation as is the case of our study, take place preferentially at the target borders. The contour extension is a planning parameter, which is seldom mentioned or specified in the published planning studies for particles, and in the present study it was found to have a significant role in plan conformity and homogeneity, as well as in dosimetric reproducibility.
The goal of a tool for automatic analysis, however, is not to detect clinically evident misalignments or anatomical changes, but subtler changes undetectable with visual inspection. This study showed that analysis of WEPL changes alone is possibly not enough to detect such changes, as other factors influence the dose distribution and therefore, more complex models would be required to support clinical decision making, which could include WEPL and planning information, and possibly other factors including geometrical tumor position. A pragmatic approach would be to correct first for the geometric tumor position and in a second step check if the anatomical changes in the beam paths are below a certain threshold, which would depend, for example on the planning technique, or the PTV margins in case of treatment under HFJV.
Supplementary material available online
Supplementary materials, Supplementary Figure 1 and Tables I–V to be found online at http://informahealthcare.com/doi/abs/10.3109/0284186X.2015.1067716.
ionc_a_1067716_sm1535.zip
Download Zip (624.4 KB)Acknowledgments
Funding by the Anneliese Pohl-Stiftung is acknowledged. The authors thank Dr. Michael Krämer for enabling TRiP98 calculations, Dr. Gheorghe Iancu for providing proton baseline data, and Filippo Ammazzalorso for providing software for DICOM conversion and RT plan analysis. The authors thank as well Toke Printz Ringbaek for his careful manuscript proofreading and support with graphing.
Declaration of interest: The authors report no conflicts of interest. The authors alone are responsible for the content and writing of the paper.
References
- Georg D, Hillbrand M, Stock M, Dieckmann K, Pötter R. Can protons improve SBRT for lung lesions? Dosimetric considerations. Radiother Oncol 2008;88:368–75.
- Hoppe BS, Huh S, Flampouri S, Nichols RC, Oliver KR, Morris CG, et al. Double-scattered proton-based stereotactic body radiotherapy for stage I lung cancer: A dosimetric comparison with photon-based stereotactic body radiotherapy. Radiother Oncol 2010;97:425–30.
- Stuschke M, Kaiser A, Pöttgen C, Lübcke W, Farr J. Potentials of robust intensity modulated scanning proton plans for locally advanced lung cancer in comparison to intensity modulated photon plans. Radiother Oncol 2012; 104:45–51.
- Britton KR, Starkschall G, Tucker SL, Pan T, Nelson C, Chang JY, et al. Assessment of gross tumor volume regression and motion changes during radiotherapy for non-small-cell lung cancer as measured by four-dimensional computed tomography. Int J Radiat Oncol Biol Phys 2007;68:1036–46.
- Bert C, Durante M. Motion in radiotherapy: Particle therapy. Phys Med Biol 2011;56:R113–44.
- Trofimov A, Nguyen PL, Efstathiou JA, Wang Y, Lu HM, Engelsman M, et al. Interfractional variations in the setup of pelvic bony anatomy and soft tissue, and their implications on the delivery of proton therapy for localized prostate cancer. Int J Radiat Oncol Biol Phys 2011;80:928–37.
- Engelsman M, Kooy HM. Target volume dose considerations in proton beam treatment planning for lung tumors. Med Phys 2005;32:3549–57.
- Mori S, Dong L, Starkschall G, Mohan R, Chen GT. A serial 4DCT study to quantify range variations in charged particle radiotherapy of thoracic cancers. J Radiat Res 2014;55: 309–19.
- Casares-Magaz O, Toftegaard J, Muren LP, Kallehauge JF, Bassler N, Poulsen PR, et al. A method for selection of beam angles robust to intra-fractional motion in proton therapy of lung cancer. Acta Oncol 2014;53:1058–63.
- Seco J, Panahandeh HR, Westover K, Adams J, Willers H. Treatment of non-small cell lung cancer patients with proton beam-based stereotactic body radiotherapy: Dosimetric comparison with photon plans highlights importance of range uncertainty. Int J Radiat Oncol Biol Phys 2012;83:354–61.
- Fritz P, Kraus HJ, Mühlnickel W, Sassmann V, Hering W, Strauch K. High-frequency jet ventilation for complete target immobilization and reduction of planning target volume in stereotactic high single-dose irradiation of stage I non-small cell lung cancer and lung metastases. Int J Radiat Oncol Biol Phys 2010;78:136–42.
- Santiago A, Jelen U, Ammazzalorso F, Engenhart-Cabillic R, Fritz P, Mühlnickel W, et al. Reproducibility of target coverage in stereotactic spot scanning proton lung irradiation under high frequency jet ventilation. Radiother Oncol 2013;109:45–50.
- Krämer M, Scholz M. Treatment planning for heavy-ion radiotherapy: Calculation and optimization of biologically effective dose. Phys Med Biol 2000;45:3319–30.
- Krämer M, Jäkel O, Haberer T, Kraft G, Schardt D, Weber U. Treatment planning for heavy-ion radiotherapy: Physical beam model and dose optimization. Phys Med Biol 2000; 45:3299–317.
- Kraemer M, Durante M. Ion beam transport calculations and treatment plans in particle therapy. Eur Phys J D 2010;60:195–202.
- Weber U, Kraft G. Design and construction of a ripple filter for a smoothed depth dose distribution in conformal particle therapy. Phys Med Biol 1999;44:2765–75.
- Jelen U, Bubula M, Ammazzalorso F, Engenhart-Cabilic R, Weber U, Wittig A. Dosimetric impact of reduced nozzle- to-isocenter distance in intensity-modulated proton therapy of intracranial tumors in combined proton-carbon fixed-nozzle treatment facilities. Radiat Oncol 2013;8:218.
- Krämer M. TRiP98 Online Manual. 2009. Available from: http://bio.gsi.de/DOCS/TRiP98/DOCS/dcm2trip.html [cited 24 June 2015].
- Ammazzalorso F, Chanrion MA, Graef S, Jelen U. A free software display and analysis tool for photon and particle radiotherapy dose distributions [abstract]. Proceedings to the 52nd Annual Meeting for the Particle Therapy Cooperative Group (PTCOG). Int J Particle Ther 2014;1:312–3.
- R Development Core Team (2008). R: A language and environment for statistical computing. R Foundation for Statistical Computing, Vienna, Austria. Available from: http://www.R-project.org [cited 24 June 2015].
- Python Software Foundation. Python Language Reference, version 2.7. Available from: http://www.python.org [cited 24 June 2015].
- Paddick I. A simple scoring ratio to index the conformity of radiosurgical treatment plans. J Neurosurg 2000;93(Suppl 3):219–22.
- Richter D, Graeff C, Jäkel O, Combs SE, Durante M, Bert C. Residual motion mitigation in scanned carbon ion beam therapy of liver tumors using enlarged pencil beam overlap. Radiother Oncol 2014;113:290–5.