
ABSTRACT
Background. Some oesophageal cancer patients undergoing chemotherapy and concomitant radiotherapy (chemoRT) show large interfractional anatomical changes during treatment. These changes may modify the dose delivered to the target and organs at risk (OARs). The aim of the presenwt study was to investigate the dosimetric consequences of anatomical changes during treatment to obtain criteria for an adaptive RT decision support system.
Material and methods. Twenty-nine patients were treated with chemoRT for oesophageal and gastro-oesophageal junction cancer and set up according to daily cone beam computed tomography (CBCTs) scans. All patients had an additional replanning CT scan at median fraction number 10 (9–14), which was deformably registered to the original planning CT. Gross tumour volumes (GTVs), clinical target volumes (CTVs) and OARs were transferred to the additional CT and corrected by an exwperienced physician. Treatment plans were recalculated and dose to targets and OARs was evaluated. Treatment was adapted if the volume receiving 95% of the prescribed dose (V95%) coverage of CTV decreased > 1% or planning target volume (PTV) decreased by > 3%.
Results. In total, nine adaptive events were observed: All nine were triggered by PTV V95% decrease > 3% [median 11% (5–41%)] and six of these were additionally triggered by CTV V95% decrease > 1% [median 5% (2–35%)]. The largest discrepancies were caused by interfractional baseline or amplitude shifts in diaphragm position (n = 5). Mediastinal (n = 6), oesophageal (n = 6) and bowel filling changes (n = 2) caused the remainder of the changes. For patients with dosimetric changes exceeding the adaptation limits, the discrepancies were confirmed by inspecting the daily CBCTs. In 31% of all patients, heart V30Gy increased more than 2% (maximum 5%). Only minor changes in lung dose or liver dose were seen.
Conclusion. Target coverage throughout the course of chemoRT treatment is compromised in some patients due to interfractional anatomical changes. Dose to the heart may increase as well.
Neoadjuvant chemotherapy and concomitant radiotherapy (chemoRT) followed by surgery or definitive chemoRT (without subsequent surgery) have become the standard treatments for locally advanced potentially curable oesophageal cancer [Citation1–3]. The final treatment volumes in RT are often large in order to compensate for risk of submucosal spread [Citation4]. This leads to a considerable probability of developing toxicity in the surrounding normal tissues at risk, which include spinal cord, lung, heart, kidney and liver as primary critical organs [Citation5,Citation6]. The use of conformal intensity-modulated radiation therapy (IMRT) or volumetrically modulated arc therapy (VMAT) decreases the normal tissue toxicity in particular with respect to high doses [Citation7,Citation8]. However, steep dose gradients adjacent to the target volume require accurate target alignment.
Large intra- [Citation9,Citation10] and interfractional [Citation11–15] anatomical changes are observed at the daily treatment fractions due to, e.g. respiratory motion and abdominal filling. In previous studies, significant displacements of the oesophagus were identified in patients who were setup according to the bony anatomy [Citation12–15]. The displacements were mostly seen in the superior-inferior direction where deviations above 1 cm were observed in 18% of the treatment fractions for patients treated for cancer of the gastro-oesophageal junction (GEJ) [Citation15]. In these distal tumours, a time trend was observed toward larger displacements in the superior-inferior direction as the RT treatment progressed [Citation12]. In addition, shrinkage of the tumour was observed for central and distal tumours [Citation13].
The aim of the present study was to investigate the dosimetric effect of interfractional anatomical changes during RT of oesophageal cancer to obtain criteria for an adaptive RT decision support system. The dose to the tumour and the normal tissue was calculated using an additional CT scan obtained midway in the treatment course and daily CBCTs were used to investigate if deviations observed were persistent.
Material and methods
Patients
A total of 29 oesophageal and GEJ cancer patients initiated and completed curative intended treatment in our institution with neoadjuvant or definitive chemo-RT between June 2014 and May 2015 (see ). The study included proximal, central and distal oesophageal and GEJ cancers and for some patients, the tumour and lymph node targets extended to involve more than one region (). Twenty-two patients were treated with the standard preoperative chemoRT treatment according to the CROSS regimen [Citation2] with RT of 41.4 Gy in 23 treatment fractions (1.8 Gy/fraction) with 5 fractions per week and concomitant chemotherapy weekly for five weeks using carboplatin AUC 2 and paclitaxel 50 mg/m2 Days 1, 8, 15, 22 and 29 [Citation2], and seven patients were treated with the definitive chemoRT schedule with 50 Gy/27 treatment fractions (1.85 Gy/fraction) with 5 fractions per week, start Day 22; cisplatin 75 mg/m2 Days 1, 22 and 43 and continuous 5 Fluorouracil (5FU) 300 mg/m2/ per 24 hours from Day 1 until completed RT.
Table I. Patient and tumour characteristics.
Pre-treatment image acquisition and contouring
All patients underwent a free-breathing 18FDG PET-CT diagnostic scan with 3 mm slice spacing and pixel size of 1 × 1 mm2 for the CT scan. Patients were positioned with both arms above the head in a standard or an individualised immobilisation device. Two patients had cervical oesophageal tumours located above the apex of the lung and these were positioned with both arms down in a standard immobilisation device with individualised thermoplastic mask for fixation of the head and neck. The planning CT scans were performed with intravenous (IV) contrast as a free-breathing three-dimensional (3D) CT scan for the two patients with cranially positioned targets, and as a time-resolved 4D CT scan for the remainder of the patients. The mid-ventilation phase of each 4D CT scan was selected for delineation and treatment planning.
Margins and treatment planning
Gross tumour volume of tumour (GTV-T) and lymph nodes (GTV-N) was delineated by an experienced clinical oncologist taking available diagnostic information into account including endoscopy and 18FDG PET-CT. The clinical target volume (CTV) was defined by adding the clinical target volumes of the primary tumour (CTV-T) and the lymph node targets (CTV-N) including areas with subclinical disease [Citation1,Citation2,Citation4]. CTV-T was defined by delineating the oesophagus with a margin to GTV-T of 3 cm cranial and caudal respecting the gastric wall and with a 1 cm margin in coronal and transversal planes. CTV-N was defined as GTV-N plus an additional 1 cm margin all directions. The two CTVs were merged to a total CTV (CTVtotal). The median volume (range) of the primary tumour GTV-T was 45cm3 (9–235 cm3) and the lymph nodes GTV-N was 3 cm3 (0.3–48 cm3). The median CTVtotal was 280 cm3 (98–692 cm3) and the median superior-inferior extent of the CTV was 13 cm (8–20 cm).
An institution determined planning target volume (PTV) margin was created by adding a 5 mm margin to the CTVtotal in the left-right and anterior-posterior direction and 8 mm in the superior-inferior direction (5/5/8mm) ().
Treatment plans with 5–8 6 MV beams were created in the Eclipse treatment planning system (Varian Medical Systems, Palo Alto, CA, USA version 11.0.31). The plans were normalised to give a mean PTV dose of 100% of the prescribed dose and the dose distribution to the target was made homogeneous (minimum 95% and maximum 107% of the prescribed dose). Dose calculation was done using the AAA algorithm and the dose was delivered using Varian Clinacs.
In-room imaging and soft-tissue match
A CBCT scan acquired with a kV On-Board Imager system (Varian Medical Systems) was used for daily image-guided patient setup. The axial field of view was 16 cm. For each fraction, the CBCT scan was registered online to the planning CT scan based on a rigid bone match. The radiation therapists (RTT) evaluated the registration and the resulting 3D-translational shifts and couch rotation were performed.
Additional CT scans during RT
For each patient, one additional CT scan was acquired during the RT course at median fraction 10, (range 9–14) (See ), using IV-contrast and the same CT scanning protocol as the pre-treatment planning CT scan. This time during the treatment was chosen to allow for evaluation of the persistency of anatomical changes, but also to allow for treatment adaptation during subsequent treatments to have a dosimetric and clinical relevance. Retrospectively, the planning CT was registered to the additional CT scan using rigid bone match with six degrees of freedom (3D translations and rotation, roll and pitch) (SmartAdapt, Varian Medical Systems) with a region of interest (ROI) enclosing the vertebral column and the sternum to the superior-inferior extent of the PTV. This registration was used to transfer the isocentre of the planning CT to the additional CT. Based on both a rigid and a daemons-based deformable propagation of contours from the planning CT, target structures and OARs delineations on the additional CT were manually corrected by an experienced clinical oncologist [Citation16]. PTVs were generated from the new CTV-delineations. The dose distribution was calculated for the additional CT using identical gantry angles, collimator leaf motion and fixed identical number of monitor units. The dose coverage for the additional CT scan was evaluated.
A decrease < 1% in CTV or < 3% in PTV coverage was accepted. If a larger decrease than accepted was observed, the additional CT was compared to the prior daily CBCTs to inspect if the anatomical change was persistent. Positional shift of the mediastinum or contraction/expansion as compared to the planning CT was noted, as well as changes in the diaphragmatic respiratory baseline or bowel filling. If the changes were found to be persistent and systematic on CBCT for at least three fractions prior to the additional CT scan, a new adaptive RT plan was created. Retrospectively, CBCTs of the fractions treated with the adapted plan were examined to determine if the change was persistent throughout the course of treatment. If the same type of anatomical change was observed later in the treatment, this was noted.
The maximum dose to the spinal cord was 45 Gy and 50 Gy to the planning organ at risk volume (PRV). If these constraints were violated at the additional CT scan, an adaptive treatment plan was made. Dose to the heart, lungs, liver and kidneys were only retrospectively scored. For the heart, the volume of the heart receiving 30 Gy or more (V30Gy), 40 Gy or more (V40Gy) and mean heart dose (MHD) was noted. For the total lung volume, V20Gy and mean lung dose (MLD) were noted. For the liver V35Gy and mean liver dose was noted. Finally for the total kidney volume, V12Gy and mean kidney dose (MKD) was noted in patients who had > 10% of the total kidney volume irradiated with 12 Gy according to the planning CT. Acceptable deviations were set to 2% for VxGy (x = dose) and 1 Gy for mean organ dose.
Results
For all 29 patients, the planning CT derived treatment plan median V95% CTV coverage was 100% (99.9–100%), whereas the planning CT derived treatment plan median V95% PTV coverage was 99.2% (96.5–99.9%) (see ). None of the patients showed an increase in V95% PTV coverage on the additional CT scans. In total, 13 of the patients exceeded at least one of the adaptive limits. Of these 13, one patient showed target coverage decrease of more than the 1%/3% limits, but the anatomical changes were not confirmed by the daily CBCTs and thus, the treatment plan was not adapted. The changes in dose distribution for another two patients were caused by differences in positioning and adaptation was omitted, instead requesting special attention at the daily treatment fractions regarding positioning. Hence, only 10 true positive violations of the adaptation limits were observed, among whom nine patients were adapted, optimising a new treatment plan on the additional CT scan.
Table II. Dosimetric parameters for targets and organs at risk.
In patients for whom the adaptive limits were exceeded the median decrease in V95% coverage of CTV was 5% (2–35%) and coverage of PTV 11% (5–41%) (see for all patients). In three patients, PTV coverage alone triggered the adaptation, and in six patients the adaptation limits of both CTV and PTV coverage were exceeded. One case was adapted due to the dose to the spinal cord exceeding the 45 Gy dose constraint.
The discrepancies were caused by interfractional baseline or amplitude shifts in diaphragm position (five patients), mediastinal (six patients) changes or changes in the connective tissue surrounding the oesophagus (two patients) and bowel filling and bowel gas (two patients). Some patients showed large anatomical changes of more than one of these categories, causing underdosage in multiple areas of the target structures (see ). In the nine adaptive cases anatomical changes were confirmed by inspecting the daily CBCTs prior to the additional CT scan. For the eight patients adapted on the basis of underdosage, the CBCTs of the subsequent fractions were examined to ensure that the adaptation corrected the discrepancy. In one case the diaphragmatic base line continued to shift and in another case the displacement of the mediastinum increased, both displacing the CTV and PTV further. All the other cases of diaphragm, mediastinal or connective tissue displacement were mitigated by the adaptation. Changes in bowel filling and gas, however, continued to fluctuate throughout the remainder of the treatment.
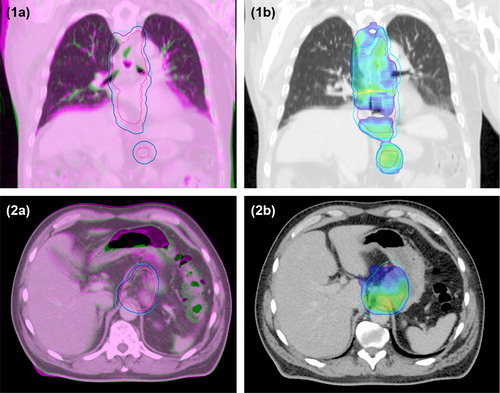
Figure 1. 1a) and 2a), Overlay of planning CT scan (green) and additional CT scan at fraction 11 (magenta); 1b) and 2b), The recalculated dose distribution on the additional CT scan, with 95% of the prescribed dose shown in colour wash; All images, Pink line, CTVtotal on planning CT scan; Blue line, PTV on planning CT scan; Magenta line, CTVtotal on additional CT scan; Cyan line, PTV on additional CT scan. Case 1), Changes in the diaphragmatic base line and the mediastinum shifted the CTVtotal and PTV towards the patient's left side causing underdosage near the top of the diaphragm and to the left in the mediastinum. The CTV and PTV were underdosed, showing decreases in V95% of the CTV of 5% and of the PTV of 12%. Case 2), Changes in the bowel filling and bowel gas shifted the CTVtotal and PTV towards the patient's right side and slightly to the posterior, causing underdosage in the PTV which had a decrease in V95% of 11%.
In 31% of all patients in the study, heart V30Gy increased by 2% or more (maximum 5%), and 17% of the patients showed heart V40Gy increase more than 2% (maximum 5%). The latter group of patients was part of those cases showing heart V30Gy change. Only minor changes were seen in lung dose and liver dose: One patient showed an increase in lung V20Gy more than 2% (2.4%). The same patient had an increased MLD of more than 1 Gy (1.1 Gy). No patients showed an increase in dose to the liver and lungs. Finally, no patients had a treatment planning value of kidney V12Gy of > 10%, and hence nothing was noted.
Discussion
This study investigated the need for adaptation of RT treatment plans when the patients showed large anatomical changes, and confirmed the need for adaptation as the additional CT scans showed underdosage of PTV alone, or CTV and PTV, in nine (31%) patients when PTV margins of 5/5/8mm were used. All adaptive events were confirmed or disproved using the daily CBCTs.
Wang et al. [Citation12] investigated weekly 4D CT scans and found tidal volume variations resulting in large geometrical changes in the position of the oesophagus. In the current study, the decrease in target coverage was related to variations in the diaphragm position in 17% of the adapted patients. Such variations may be included in the treatment plan, by delineation of a composite volume of the observed CTVs on the CBCTs of the first RT treatment week [Citation17]. Hereby, the target coverage would be secured for the remainder of the treatment course. In addition, PTV would be reduced, whereby a significant reduction in the toxicity of the heart and lungs could be obtained. We observed an increased V30Gy dose to the heart of > 2% in nine (31%) patients (maximum 5% increase). Han et al. [Citation11] reported deviations > 5% of the maximum dose to the lungs and the heart in approximately 5% of the treatment fractions as visualised on daily CBCT scans. However, in a study of 22 patients undergoing chemoRT, Wang et al. [Citation18] found no statistically significant correlation between interfractional displacements and the severity of the toxicity. Such diverging observations between studies are to be expected for several reasons, one being differences between the prescribed total radiation dose and dose per fraction within studies. More serious is the lack of studies actually measuring and reporting data on normal tissue toxicity. It is difficult to identify and specify cause and relationship when trying to evaluate serious or even potentially lethal normal tissue toxicities that can be caused by multiple factors. This is in particular challenging in oesophageal cancer patients receiving combined treatment modalities involving, e.g. RT at high doses (as to the heart), chemotherapy with known potential toxicity to heart and kidney and who eventually may be subjected to major surgery involving intrathoracic oesophagectomy. Normal toxicity was not systematically scored and evaluated in the present study. However, if the prescribed dose in the RT treatment is to be precisely and adequately delivered to the delineated target, persistent anatomical changes large enough to change the dose distribution must be discovered and acted upon.
In the current study, the control of the patients’ treatment was performed at the 10th treatment fraction. This timing was selected to allow time to act upon any observed changes with a dosimetrically relevant adaptation of the treatment. This was the only time during the treatment that we chose to repeat a CT scan as the patients had only median 23 treatment fractions (range 23–27). Adaptations at a later point in time would not be feasible in order to achieve a significant effect on the total dose delivered. Considerable changes in target coverage or increases in the dose to normal tissue may have been present at an earlier time or may have appeared later during the treatment course. This was not investigated fully as only one additional CT was acquired. Even though daily CBCTs were available for all patients, the quality and superior-inferior length of these images did not allow a dose distribution to be calculated. Furthermore, only patients showing changes above the adaptation limits were subjected to CBCT analysis. However, in the majority of patients (eight of nine) the adaptation removed or mitigated the dosimetric effects of the anatomical changes, except for effects related to bowel filling or bowel gas.
When planning patients with target volumes near the diaphragm-lung border care should be taken not to put too much dose fluence through volumes changing density with diaphragmatic base line shifts, e.g. by using non-coplanar field angles from the anterior and posterior directions for irradiation of this volume, or by using different field setups for the superior and inferior parts of the target, adjoining field borders below the diaphragm. Likewise, the fraction of dose carried by treatment fields passing through volumes with abundant bowel gas should also be minimised. Treatment plans that are more robust to these types of changes may be achieved by avoiding gantry angles for which the beam must pass through volumes prone to large anatomical changes.
This study showed that changes in the respiratory base line and bowel filling affected the position of the CTV. By correcting for these changes and seeking to minimise them in the daily treatment fractions, geographical miss and potentially also treatment margins and treatment toxicity can be reduced. Possible methods to overcome geographical miss could be achieved by setting up with soft tissue match using implanted fiducial markers for positional verification [Citation13,Citation19] or treating with internally correlated respiration gating [Citation20].
To avoid overlooking anatomical changes, frequent online or offline evaluation according to a decision support system could be implemented. This system should be based on criteria for acceptable geometrical deviations and only systematic deviations should result in adaptation [Citation21]. Criteria for adaptation should be derived from CT scans of a number of patients showing anatomical changes on the CBCTs, to determine how large any type of change would have to be to change the dose distribution in the patient, significantly. Changes to observe should include diaphragmatic baseline shifts, changes in the mediastinum or connective tissue surrounding the oesophagus, and bowel filling and bowel gas.
In conclusion, this study showed interfractional anatomical changes that were mitigated by an adapted RT plan as target coverage was compromised in nine among 29 patients .This was especially the case for patients with tumours that are sensitive to respiratory base line changes or changes in bowel filling. Dose to the heart may increase as well as a result of these anatomical changes.
Declaration of interest: The authors report no conflicts of interest. The authors alone are responsible for the content and writing of the paper.
References
- Waddell T, Verheij M, Allum W, Cunningham D, Cervantes A, Arnold D. Gastric cancer: ESMO-ESSO- ESTRO Clinical Practice Guidelines for diagnosis, treatment and follow-up. Radiother Oncol 2014;110:189–94.
- van Hagen P, Hulshof MC, van Lanschot JJ, Steyerberg EW, van Berge Henegouwen MI, Wijnhoven BPL, et alPreoperative chemoradiotherapy for esophageal or junctional cancer. N Engl J Med 2012;366: 2074–84.
- Stahl M, Walz MK, Stuschke M, Lehmann N, Meyer HJ, Riera-Knorrenschild J, et al. Phase III comparison of preoperative chemotherapy compared with chemoradiotherapy in patients with locally advanced adenocarcinoma of the esophagogastric junction. J Clin Oncol 2009;27:851–6.
- Gao XS, Qiao X, Wu F, Cao L, Meng X, Dong Z, et al. Pathological analysis of clinical target volume margin for radiotherapy in patients with esophageal and gastroesophageal junction carcinoma. Int J Radiat Oncol Biol Phys 2007; 67:389–96.
- Lee HK, Vaporciyan AA, Cox JD, Tucker SL, Putnam JB Jr, Ajani JA, et al. Postoperative pulmonary complications after preoperative chemoradiation for esophageal carcinoma: Correlation with pulmonary dose-volume histogram parameters. Int J Radiat Oncol Biol Phys 2003;57:1317–22.
- Shirai K, Tamaki Y, Kitamoto Y, Murata K, Satoh Y, Higuchi K, et al. Dose-volume histogram parameters and clinical factors associated with pleural effusion after chemoradiotherapy in esophageal cancer patients. Int J Radiat Oncol Biol Phys 2011;80:1002–7.
- Kole TP, Aghayere O, Kwah J, Yorke ED, Goodman KA. Comparison of heart and coronary artery doses associated with intensity-modulated radiotherapy versus three-dimensional conformal radiotherapy for distal esophageal cancer. Int J Radiat Oncol Biol Phys 2012;83:1580–6.
- Hafeez S, Bedford JL, Tait DM, Hawkins MA. Normal tissue sparing with respiratory adapted volumetric modulated arc therapy for distal oesophageal and gastro-oesophageal tumours. Acta Oncol 2014;53:149–54.
- Yamashita H, Kida S, Sakumi A, Haga A, Ito S, Onoe T, et al. Four-dimensional measurement of the displacement of internal fiducial markers during 320-multislice computed tomography scanning of thoracic esophageal cancer. Int J Radiat Oncol Biol Phys 2011;79:588–95.
- Patel AA, Wolfgang JA, Niemierko A, Hong TS, Yock T, Choi NC. Implications of respiratory motion as measured by four-dimensional computed tomography for radiation treatment planning of esophageal cancer. Int J Radiat Oncol Biol Phys 2009;74: 290–6.
- Han C, Schiffner DC, Schultheiss TE, Chen YJ, Liu A, Wong JY. Residual setup errors and dose variations with less-than-daily image guided patient setup in external beam radiotherapy for esophageal cancer. Radiother Oncol 2012;102:309–14.
- Wang JZ, Li JB, Wang W, Qi HP, Ma ZF, Zhang YJ, et al. Changes in tumour volume and motion during radiotherapy for thoracic oesophageal cancer. Radiother Oncol 2015; 114:201–5.
- Fukada J, Hanada T, Kawaguchi O, Ohashi T, Takeuchi H, Kitagawa Y, et al. Detection of esophageal fiducial marker displacement during radiation therapy with a 2-dimensional on-board imager: Analysis of internal margin for esophageal cancer. Int J Radiat Oncol Biol Phys 2013;85:991–8.
- Yamashita H, Haga A, Hayakawa Y, Okuma K, Yoda K, Okano Y, et al. Patient setup error and day-to-day esophageal motion error analyzed by cone-beam computed tomography in radiation therapy. Acta Oncol 2010;49:485–90.
- Hawkins MA, Aitken A, Hansen VN, McNair HA, Tait DM. Set-up errors in radiotherapy for oesophageal cancers – is electronic portal imaging or conebeam more accurate? Radiother Oncol 2011;98:249–54.
- Ellegaard MB, Knap MM, Hoffmann L. Inter-tester reproducibility of tumour change in small cell lung cancer patients undergoing chemoradiotherapy. Acta Oncol 2013; 52:1520–5.
- Hawkins MA, Brooks C, Hansen VN, Aitken A, Tait DM. Cone beam computed tomography-derived adaptive radiotherapy for radical treatment of esophageal cancer. Int J Radiat Oncol Biol Phys 2010;77:378–83.
- Wang J, Lin SH, Dong L, Balter P, Mohan R, Komaki R, et al. Quantifying the interfractional displacement of the gastroesophageal junction during radiation therapy for esophageal cancer. Int J Radiat Oncol Biol Phys 2012;83:e273–80.
- Schaake EE, Belderbos JSA, Buikhuisen WA, Rossi MM, Burgers JA, Sonke JJ. Mediastinal lymph node position variability in non-small cell lung cancer patients treated with radical irradiation. Radiother Oncol 2012;105: 150–4.
- Ren Q, Nishioka S, Shirato H, Berbeco R. Adaptive external gating based on the updating method of internal/external correlation and gating window before each beam delivery. Phys Med Biol 2012;57:N145–57.
- Yan D, Vicini F, Wong J, Martinez A. Adaptive radiation therapy. Phys Med Biol 1997;42:123–32.