
ABSTRACT
Introduction. Hypoxic tumor cells are radioresistant, therefore, identification of hypoxia is crucial. Hyperpolarized magnetic resonance spectroscopy (HPMRS) allows real time measurements of the conversion of pyruvate to lactate, the final step of anaerobic energy production, and may thus allow non-invasive identification of hypoxia or treatment-induced changes in oxygenation. The aim of the study was to investigate the usefulness of HPMRS as a means to assess tumor hypoxia and its dynamics during intervention.
Material and methods. C3H mammary carcinomas grown in CDF1 mice were used. To manipulate with tumor oxygenation, non-anaesthetized mice were gassed with air, 10% or 100% oxygen prior to administration of hyperpolarized [1-¹³C]pyruvate and HPMRS analysis. A direct assessment of tumor oxygen partial pressure (pO2) distributions were made using the Eppendorf oxygen electrode in a separate, but similarly treated, group of mice.
Results. Even though breathing 100% oxygen improved tumor oxygenation as evidenced by pO2 measurements, the mean (with 1 S.E.) [1-¹³C]lactate/[1-¹³C]pyruvate ratio was unaffected by this intervention, being 34 (30–37) in mice breathing air and 37 (33–42) in mice breathing 100% oxygen. In contrast, and in accordance with pO2 measurements, a significant increase in the [1-¹³C]lactate/[1-¹³C]pyruvate ratio was seen in 10% oxygen-breathing mice with a ratio of 46 (42–50).
Conclusions. Although, no metabolic change was observed during 100% O2 breathing using HPMRS, the significant increase in the [1-¹³C]lactate/[1-¹³C]pyruvate ratio during 10% oxygen breathing suggests, that HPMRS can detect hypoxia-driven changes in the metabolic fate of pyruvate. To what extent and for what purposes HPMRS may best supplement or complement established techniques like hypoxia PET needs to be unraveled in future research.
Hypoxia in tumor tissue is a source of resistance to conventional cancer treatment, especially radiation [Citation1,Citation2]. This has led to numerous attempts to find clinically applicable methods to identify patients with hypoxic tumors, who are most likely to benefit from therapies that can overcome hypoxia [Citation3]. The most investigated method to measure presence of oxygen in tumor tissue used fine needle oxygen electrodes. This principle was shown by Kolstad [Citation4] who demonstrated the prognostic significance of hypoxia. Others showed the same prognostic significance of hypoxia in solid tumors using the Eppendorf oxygen electrode [Citation1,Citation5–7]. However, this technique was never established in clinical practice. Moreover, today there is a need for non-invasive approaches.
Hyperpolarized magnetic resonance spectroscopy (HPMRS) is a promising non-invasive technique that allows measurement of biochemical reactions in vivo. Imaging with hyperpolarized agents can result in a more than 10 000-fold enhancement in signal relative to conventional MR imaging [Citation8]. The technique evaluates the distribution of hyperpolarized agents, such as [1-¹³C]pyruvate and its metabolic products lactate, alanine, and bicarbonate, in a matter of seconds. Pyruvate is rapidly transported into cells via monocarboxylate transporters and the flux of [1-13C]pyruvate to [1-13C]lactate is catalyzed by lactate dehydrogenase. The relaxation rate of the polarization is approximately 20–30 seconds in vivo, which limits studies to fast metabolic reactions. Preclinical studies in cancer models have detected elevated levels of hyperpolarized [1-¹³C]lactate in tumor compared to normal tissue, with the ratio of [1-¹³C]lactate/[1-¹³C]pyruvate being increased in high-grade tumors and decreased after successful treatment [Citation9]. So far [1-13C]pyruvate is the most tested substrate in HPMRS and it was the first hyperpolarized agent to be used in a clinical trial [Citation10]. Hypoxia is expected to reduce mitochondrial oxidation of pyruvate and stimulate the conversion of pyruvate to lactate (the Pasteur Effect), and in accordance it was shown that manipulation of oxygen availability in a diabetic kidney rat model could be detected by [1-13C]pyruvate HPMRS [Citation11]. Similar results have been reported for other tissues when oxygen delivery is fully or partly impaired [Citation12,Citation13]. Tumor cells often consume excessive amounts of glucose, which is converted to lactic acid even under non-hypoxic conditions (aerobic glycolysis or the Warburg effect). This inherent, yet highly variable, glycolytic dependency may prevent a simple universally applicable relationship between oxygenation and the conversion rate of pyruvate to lactate.
The aim of this study was therefore to investigate whether the [1-¹³C]lactate/[1-¹³C]pyruvate ratio, as determined from HPMRS, is able to detect changes in oxygenation during hypoxic intervention, rather than assessing absolute oxygenation values. If so, HPMRS may be a useful tool to assess the efficacy of hypoxic intervention in individual patients with proven hypoxia.
Materials and methods
Tumor model
All animal studies were conducted according to the animal welfare policy of Aarhus University (http://dyrefaciliteter.au.dk), with the Danish Animal Experiments Inspectorate's approval. Female and male CDF1 mice (29 g ± 4 g, Taconic Laboratories) were implanted in the right rear foot with C3H mammary carcinomas as previously described [Citation14]. Tumors were grown to a volume of 200 mm3 determined from the formula [(Length× Width× Height)×π/6] before experiments were carried out. This generally occurred 2–3 weeks after implantation.
Hyperpolarization of [1-13C]pyruvate and HPMRS experiments
A formulation of 127 mg of [1-13C]pyruvic acid and 15 mM AH111501 was polarized in a SPINLab (GE Healthcare, Brøndby, Denmark), to a reproducible polarization of 40% with a final concentration of 125 mM [1-13C]pyruvate. Prior to HPMRS, the MR scanner was heated to 25°C. Non-anaesthetized mice were restrained in jigs, with their tumor-bearing legs exposed [Citation15]. Rectal temperature was measured. A tail vein was cannulated with a 25G 3/4 0.5*19 mm needle connected to a 110 cm line suitable for the injection of [1-13C]pyruvate when the mouse was placed in the scanner. In order to manipulate with tumor oxygenation, mice were gassed with a flow rate at 2.5 l/min prior to HPMRS. Based on previous experience, the period of gas exposure before HPMRS was 5 minutes for atmospheric air or 100% oxygen and 3 hours for 10% oxygen (in gas-tight PVC chambers), as this ensures maximum changes in tumor oxygenation. Gas flow was also maintained during HPMRS. Following the pre-gassing period, mice were transferred to a 9.4 T MRI scanner (Agilent, Santa Clara CA) and through the intravenous line a volume of 200 μL hyperpolarized [1-¹³C]pyruvate was injected into the tail vein over a period of 30 seconds. HPMRS was performed. The transfer time between dissolution and injection of hyperpolarized [1-¹³C]pyruvate was 27 seconds on average. A thermal 2M 13C urea phantom was used to optimize the frequency and flip angle prior to the hyperpolarized experiment. A 13C 11 mm surface coil (Agilent, Santa Clara, CA, USA) positioned approximately 2 mm above the tumor was used for MR acquisitions. A non-selective 1D time series with a TR of 1 second, a 9° flip angle and 120 repetitions was initiated at the start of injection. The spectral width was 20 kHz and 2048 points were acquired. After completing the scan, the body temperatures of the mice were measured before sacrificing the animal. Spectral and radiometric analysis was performed with spectral deconvolution in iNMR 5.4.3 (Nucleomatica, Molfetta, Italy).
Eppendorf oxygen electrode measurements
Tumor oxygen partial pressure (pO2) measurements were made with an Eppendorf oxygen electrode (Eppendorf, Hamburg, Germany) as previously described [Citation15,Citation16]. The same procedure as in the HPMRS experiment regarding tumor type, volume, measurements in non-anaesthetized mice, gas composition and exposure period was used, but in a different group of mice than used in the HPMRS. Groups with an average of six mice were used for each gas exposure. The electrode was inserted up to a depth of 1 mm into the tumor of restrained mice, and then moved automatically through the tissue in 0.7 mm increments, followed each time by a 0.3 mm backward step before measurement. Response time was 1.4 seconds. An average of five repeated parallel insertions were made in each tumor giving a mean number of 52 (30–90) pO2 values per animal. Negative pO2 values were sometimes recorded. These were accepted provided they were not lower than −2.0 mmHg. The endpoint was the percent of pO2 values ≤ 5 mmHg.
[Citation18]-Fluorodeoxyglucose (FDG)/Pimonidazole assay
To assess whether hypoxia affected central carbohydrate energy metabolism, a prerequisite for the usefulness of techniques like HPMRS in hypoxia assessment, tumor bearing mice were injected in the tail vein with approximately 10 MBq of the glucose analog FDG and intraperitoneally with 60 mg/kg of the hypoxia marker pimonidazole. One hour after administration of tracers, mice were sacrificed and tumors were quickly excised and frozen in cooled isopentane (−40°C) before tissue sectioning. Multiple 10 μm tissue cryo-sections were cut and dried. Next, sections were exposed to a phosphor imaging plate overnight from which autoradiograms showing the regional distribution of FDG were extracted using a FUJIFILM BAS 5000 scanner (Fujifilm, Japan). The sections used for autoradiography were then bathed in a solution containing a polyclonal anti-rabbit antibody against pimonidazole (kindly provided by Dr. J.A. Raleigh). Finally, hypoxic areas were visualized using anti-rabbit IgG–horseradish peroxidase-conjugated polymers and sections were counterstained with hematoxylin (for further details see [Citation17]).
Comparison of FDG autoradiography and pimonidazole images
Pimonidazole-stained tissue sections were digitized using a Hamamatsu NanoZoomer scanner (Hamamatsu Photonics, Japan) followed by thresholding and conversion into binary images using the free software ImageJ resulting in images showing the distribution of cells with an oxygen partial pressure (pO2) below approximately 10 mmHg as detailed previously [Citation17]. Autoradiograms showing the regional distribution of FDG were covered by a grid composed of 0.5 × 0.5 mm pixels using the Image Gauge software (version 4.0) from Fujifilm. Corresponding binary pimonidazole images were imported into Image Gauge and covered by the same grid. This grid was positioned similar to the grid covering the autoradiograms using distinct landmarks (for an example see ). The spatial relationship between FDG retention and hypoxic cell density was then quantified by comparison of the two grids pixel-by-pixel and graphed as scattergrams. Only pixels fully within the periphery of the tissue sections were included in analysis. Pixels containing significant necrosis, tissue folds and holes (cutting artifacts) were excluded from analysis. Although regression coefficient analysis can reveal whether glucose metabolism and tumor oxygenation are linked spatially, the magnitude of the metabolic changes are also important to allow for sufficient sensitivity of assays that measures these metabolic flux changes. Therefore, we also calculated an apparent in vivo Pasteur Effect defined as the ratio of the FDG uptake measured at a hypoxic fraction (HF) of 1 (from extrapolation of the regression line) with retention measured at a HF of zero (intersection with the y-axis). This can be interpreted as a standardized measure of the maximal influence tumor oxygenation can exert on glycolytic flux.
Statistical analysis
HPMRS and Eppendorf results are presented as mean ± 1 SE. Comparisons of HPMRS at different oxygen tension levels were done using a linear regression model. A two-sided p-value less than 0.05 was regarded as significant. All statistical analyses were performed by using Stata version 13. The spatial relationship between FDG and pimonidazole-positive cells was compared using Pearson's correlation coefficients.
Results
Data from HPMRS was compared to the pO2 measurements made with the Eppendorf oxygen electrode. An example of 13C spectra showing data from one HPMRS recording in a mouse breathing 100% oxygen is shown in Supplementary Figure 1 (available online at: http://informahealthcare.com/doi/abs/10.3109/0284186X.2015.1070964). The percentage of pO2 values < 5 mmHg measured by the Eppendorf electrode was determined [Citation16] and the relationship between these values and the [1-¹³C]lactate/[1-¹³C]pyruvate ratio measured under atmospheric air, 10% or 100% oxygen is illustrated in . The Eppendorf oxygen electrode measurements resulted in a mean (with 1 SE) of 36% (30–43) values ≤ 5 mmHg in air-breathing mice. This was significantly reduced to 9% (3–14) with 100% oxygen breathing and increased to 72% (62–81) under 10% oxygen. In air breathing mice the mean (with 1 SE) [1-¹³C]lactate/[1-¹³C]pyruvate ratio was 34 (30–37) and this was non-significantly changed to 37 (33–42) under 100% oxygen. In 10% oxygen breathing mice a significant increase in [1-¹³C]lactate/[1-¹³C]pyruvate ratio to 46 (42–50) was observed (p = 0.046) when compared to air breathing mice.
Figure 1. Relationship between Eppendorf measurements of tumor oxygenation and the [1-¹³C]lactate/[1-¹³C]pyruvate ratio in C3H mammary carcinomas. Different groups of mice were used for Eppendorf (n = 6) and HPMRS (n = 5) measurements. Results were obtained from air-breathing mice and mice breathing 10% or 100% oxygen.
![Figure 1. Relationship between Eppendorf measurements of tumor oxygenation and the [1-¹³C]lactate/[1-¹³C]pyruvate ratio in C3H mammary carcinomas. Different groups of mice were used for Eppendorf (n = 6) and HPMRS (n = 5) measurements. Results were obtained from air-breathing mice and mice breathing 10% or 100% oxygen.](/cms/asset/4bab2b77-53d4-4ffc-aab8-3f3d1f0ecc69/ionc_a_1070964_f0001_b.gif)
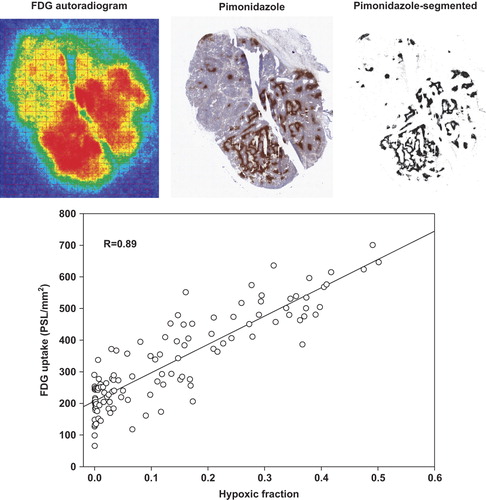
To provide evidence that tumor oxygenation directly affects glucose metabolism in the C3H tumor model, we studied the linkage between cellular glucose retention/phosphorylation and hypoxia in vivo. We took advantage of the glucose analog FDG that provides a surrogate measure of glucose retention and hexokinase-mediated phosphorylation and pimonidazole, which allows identification of hypoxic cells at a cellular resolution. The FDG-autoradiograms and pimonidazole images showed a clear and highly significant spatial linkage between cellular FDG uptake and hypoxia with average Pearson's correlation coefficients of 0.68 ± 0.08 (p ≤ 5 × 10⁻⁶) and 0.69 ± 0.09 (p ≤ 6 × 10⁻¹⁴) in female and male mice, respectively. An example of such analysis is shown in . Calculation of the apparent Pasteur Effect revealed that glycolytic flux was stimulated 3.37 ± 0.66- and 3.14 ± 0.77-fold in female and male mice, respectively in fully hypoxic areas compared to non-hypoxic areas.
Figure 2. Top panel: Example of a C3H mammary carcinoma tumor showing corresponding FDG autoradiogram, Pimonidazole staining and Pimonidazole-segmented image. Bottom panel: A scattergram depicting the relationship between hypoxia and FDG retention is shown. There is a clear spatial linkage (R: correlation coefficients) between cellular FDG uptake and hypoxia, showing that the Pasteur Effect is present in vivo.
Discussion
Several techniques which potentially allow assessment of tumor hypoxia in patients have been developed, but they all have inherent weaknesses. Direct measurement of pO2 with tissue invasive oxygen electrodes is intuitively an attractive technology, due to the direct measurement principle, and it is still considered the gold standard. However, it is highly invasive and is only feasible on a regular basis in easily accessible tumors. Furthermore, this method is unable to separate between necrotic tissue and viable treatment-resistant hypoxic tissue. There are several non-invasive techniques that have been investigated for measuring hypoxia, such as DCE-MRI, CT perfusion measurements and PET [Citation3]. PET imaging with radio-labeled nitroimidazoles is currently the standard technology in the clinic for assessment of tumor hypoxia. However, HPMRS may have several advantages compared to PET including: 1) it is non-radioactive; 2) the short half-life of hyperpolarization allows multiple measurements in a single day (e.g. before/after hypoxic intervention); 3) the duration of the measurement is very short thus allowing identification of transient changes which would pass undetected by PET, which only provides a cumulative measure of tracer retention generated over several hours.
Therefore we decided to examine the potential of the [1-¹³C]lactate/[1-¹³C]pyruvate ratio to be a surrogate marker for hypoxia using HPMRS. To do this we exposed mice to different gas breathing conditions that would be expected to both increase and decrease the level of hypoxia. The Eppendorf measurements clearly showed that breathing 100% oxygen increased oxygenation status, while it decreased with 10% oxygen. These findings are consistent to what we had previously found [Citation18,Citation19]. Furthermore, a recent HPMRS study in tumor-bearing rats showed, that the conversion of pyruvate to lactate responded significantly to a reduction in tumor oxygenation [Citation20]. However, although the oxygenation status in tumor changes when reducing oxygen from 100% to atmospheric air we did not see a corresponding change in [1-¹³C]lactate/[1-¹³C]pyruvate ratio using HPMRS in mice breathing 100% and atmospheric air.
Energy metabolism is affected by oxygenation and such changes, if quantifiable, may thus serve as indirect surrogate markers for tissue hypoxia. In particular, during hypoxia, when mitochondrial ATP synthesis decreases, mammalian cells typically respond with a compensatory increase in anaerobic glycolytic ATP production and associated production of lactic acid (i.e. the Pasteur Effect). Indeed, a linkage between tumor lactate concentration and poor outcome in different cancer types has been demonstrated, making lactate a very interesting prognostic biomarker [Citation21]. Nonetheless, invasive analysis revealed that lactate concentration is not a reliable surrogate measure of tumor hypoxia, possibly due to the Warburg effect, where a large fraction of glucose is converted to lactic acid even under non-hypoxic conditions.
Similarly, the Warburg effect and associated oxygen-independent ATP synthesis, may potentially reduce the sensitivity of other surrogate markers of tumor hypoxia that relies on estimates of glycolytic flux per see (e.g. FDG) or the metabolic fate of glucose as previously shown by us [Citation22,Citation23]. Therefore, we evaluated whether hypoxia is a driving and modulating force of glycolytic flux in the C3H tumor model. Our analysis of the spatial linkage between areas of intense glucose use and hypoxia () revealed that in vivo glucose metabolism (uptake and phosphorylation) in the C3H tumor is highly influenced by oxygen, making it a suitable model for further testing using HPMRS. As discussed above, a profound Warburg effect may lower the influence of oxygen fluctuations on glucose metabolism, including the metabolic fate of pyruvate; however, the clear spatial linkage between cellular FDG uptake and hypoxia does not support this theory. The significant increase in the [1-¹³C]lactate/[1-¹³C]pyruvate ratio during hypoxia (mice breathing 10% oxygen) suggests, that HPMRS potentially responds to oxygenation-linked metabolic changes. These results are not necessarily contradictory. It may be hypothesized that cells under chronic hypoxia which suddenly experience elevated oxygen levels requires an adaptive period much beyond 5 minutes (duration of the 100% O2 gassing period) before they acquire a non-glycolytic phenotype. Conversely, cells that experience abrupt hypoxia (breathing 10% O2) need an immediate glycolytic up-regulation to safeguard cellular ATP levels. Further experiments including additional tumor models with differing metabolic phenotypes and microenvironment are needed to decisively determine the usefulness of HPMRS as a means to quantify tumor hypoxia at baseline and during hypoxic intervention.
Supplementary material available online
Supplementary Figure 1 available online at: http://informahealthcare.com/doi/abs/10.3109/0284186X.2015.1070964
ionc_a_1070964_sm2089.zip
Download Zip (189.5 KB)Acknowledgements
The authors would like to thank Ms. Inger Marie Horsman, Ms. Dorthe Grand and Henrik Vestergaard Nielsen for excellent technical assistance. This work was supported by grants from the Danish Cancer Society, Lykfeldts Grant, Astrid Thaysens Medical Scientific Research Grant and A. P. Møllers Fund for General Purposes.
Declaration of interest: The authors report no conflicts of interest. The authors alone are responsible for the content and writing of the paper.
References
- Nordsmark M, Overgaard M, Overgaard J. Pretreatment oxygenation predicts radiation response in advanced squamous cell carcinoma of the head and neck. Radiother Oncol 1996;41:31–9.
- Overgaard J. Sensitization of hypoxic tumour cells – clinical experience. Int J Radiat Biol 1989;56:801–11.
- Horsman MR, Mortensen LS, Petersen JB, Busk M, Overgaard J. Imaging hypoxia to improve radiotherapy outcome. Nat Rev Clin Oncol 2012;9:674–87.
- Kolstad P. Intercapillary distance, oxygen tension and local recurrence in cervix cancer. Scand J Clin Lab Invest Suppl 1968;106:145–57.
- Fyles AW, Milosevic M, Wong R, Kavanagh MC, Pintilie M, Sun A, et al. Oxygenation predicts radiation response and survival in patients with cervix cancer. Radiother Oncol 1998;48:149–56.
- Hockel M, Vorndran B, Schlenger K, Baussmann E, Knapstein PG. Tumor oxygenation: A new predictive parameter in locally advanced cancer of the uterine cervix. Gynecol Oncol 1993;51:141–9.
- Hockel M, Knoop C, Schlenger K, Vorndran B, Baussmann E, Mitze M, et al. Intratumoral pO2 predicts survival in advanced cancer of the uterine cervix. Radiother Oncol 1993;26:45–50.
- Ardenkjaer-Larsen JH, Fridlund B, Gram A, Hansson G, Hansson L, Lerche MH, et al. Increase in signal-to-noise ratio of > 10,000 times in liquid-state NMR. Proc Natl Acad Sci U S A 2003;100:10158–63.
- Day SE, Kettunen MI, Gallagher FA, Hu DE, Lerche M, Wolber J, et al. Detecting tumor response to treatment using hyperpolarized 13C magnetic resonance imaging and spectroscopy. Nat Med 2007;13:1382–7.
- Nelson SJ, Kurhanewicz J, Vigneron DB, Larson PE, Harzstark AL, Ferrone M, et al. Metabolic imaging of patients with prostate cancer using hyperpolarized [1-(1)(3)C]pyruvate. Sci Transl Med 2013;5:198ra108.
- Laustsen C, Lycke S, Palm F, Ostergaard JA, Bibby BM, Norregaard R, et al. High altitude may alter oxygen availability and renal metabolism in diabetics as measured by hyperpolarized [1-(13)C]pyruvate magnetic resonance imaging. Kidney Int 2014;86:67–74.
- Saito K, Matsumoto S, Devasahayam N, Subramanian S, Munasinghe JP, Morris HD, et al. Transient decrease in tumor oxygenation after intravenous administration of pyruvate. Magn Reson Med 2012;67:801–7.
- Matsumoto S, Saito K, Yasui H, Morris HD, Munasinghe JP, Lizak M, et al. EPR oxygen imaging and hyperpolarized 13C MRI of pyruvate metabolism as noninvasive biomarkers of tumor treatment response to a glycolysis inhibitor 3- bromopyruvate. Magn Reson Med 2013;69:1443–50.
- Overgaard J. Simultaneous and sequential hyperthermia and radiation treatment of an experimental tumor and its surrounding normal tissue in vivo. Int J Radiat Oncol Biol Phys 1980;6:1507–17.
- Horsman MR, Murata R. Vascular targeting effects of ZD6126 in a C3H mouse mammary carcinoma and the enhancement of radiation response. Int J Radiat Oncol Biol Phys 2003;57:1047–55.
- Busk M, Horsman MR, Jakobsen S, Keiding S, van der Kogel AJ, Bussink J, et al. Imaging hypoxia in xenografted and murine tumors with 18F-fluoroazomycin arabinoside: A comparative study involving microPET, autoradiography, PO2-polarography, and fluorescence microscopy. Int J Radiat Oncol Biol Phys 2008;70:1202–12.
- Busk M, Munk OL, Jakobsen S, Wang T, Skals M, Steiniche T, et al. Assessing hypoxia in animal tumor models based on pharmocokinetic analysis of dynamic FAZA PET. Acta Oncol 2010;49:922–33.
- Lukacova S, Khalil AA, Overgaard J, Alsner J, Horsman MR. Relationship between radiobiological hypoxia in a C3H mouse mammary carcinoma and osteopontin levels in mouse serum. Int J Radiat Biol 2005;81:937–44.
- Raleigh JA, Chou SC, Arteel GE, Horsman MR. Comparisons among pimonidazole binding, oxygen electrode measurements, and radiation response in C3H mouse tumors. Radiat Res 1999;151:580–9.
- Bluff JE, Reynolds S, Metcalf S, Alizadeh T, Kazan SM, Bucur A, et al. Measurement of the acute metabolic response to hypoxia in rat tumours in vivo using magnetic resonance spectroscopy and hyperpolarised pyruvate. Radiother Oncol Epub 2015 Mar 27.
- Zips D, Adam M, Flentje M, Haase A, Molls M, Mueller-Klieser W, et al. Impact of hypoxia and the metabolic microenvironment on radiotherapy of solid tumors. Introduction of a multi-institutional research project. Strahlenther Onkol 2004;180:609–15.
- Busk M, Horsman MR, Jakobsen S, Bussink J, van der Kogel A, Overgaard J. Cellular uptake of PET tracers of glucose metabolism and hypoxia and their linkage. Eur J Nucl Med Mol Imaging 2008;35:2294–303.
- Busk M, Horsman MR, Kristjansen PE, van der Kogel AJ, Bussink J, Overgaard J. Aerobic glycolysis in cancers: implications for the usability of oxygen-responsive genes and fluorodeoxyglucose-PET as markers of tissue hypoxia. Int J Cancer 2008;122:2726–34.