
ABSTRACT
Background. Previous studies suggested the maximum tumor to background ratio (TBRmax) in FMISO PET images as a potentially predictive parameter for local control after radio-chemotherapy (CRT) in head and neck squamous cell carcinomas (HNSCC). However, different TBRmax thresholds for stratification were reported, implying that a common threshold cannot readily be used among different institutions without the risk of reducing prediction accuracy. Therefore, this study investigated the robustness of using a common pre-defined TBRmax, simulating a multicenter clinical trial.
Material and methods. FMISO PET/CT was performed four hours post-injection in 22 patients with advanced HNSCC in a phase II FMISO dose escalation study. PET background regions of interest (ROIs) were manually defined in deep neck muscles. TBRmax was calculated as the mean of the highest-valued voxels within the high risk RT planning target volume. Its predictive power with respect to local control was tested, classifying patients using median TBRmax as threshold. The influence of systematically varying quantification between institutions was studied in silico by applying offsets of ± 10% and ± 20% to the TBRmax of all patients, while the threshold remained constant. The effect was analyzed using a receiver operating characteristic (ROC). True positive and false positive rates (TPR/FPR) as well as positive and negative predictive values (PPV/NPV) were evaluated.
Results. For the reference condition without an offset the median TBRmax was 2.0 (1.4–3.5). Patients were classified using this threshold and TPR = 0.7, FPR = 0.4, PPV = 0.5 and NPV = 0.8 were observed. Accuracy declined with increasing offsets. Negative offsets of -10% and -20% resulted in TPR = 0.43 and 0.14, FPR = 0.20 and 0.13, PPV = 0.50 and 0.33 and NPV = 0.75 and 0.68, respectively. Positive offsets of + 10% and + 20% resulted in TPR = 1.00 and 1.00, FPR = 0.53 and 0.67, PPV = 0.47 and 0.41 and NPV = 1.00 and 1.00, respectively.
Conclusions. Using a common pre-defined TBRmax threshold in multicenter trials requires careful standardization and harmonization of all steps from patient preparation to image analysis. Our results indicate that TBRmax should deviate less than 10% from reference conditions (absolute value in this dataset ± 0.2). This conclusion likely applies to all low contrast nitroimidazole hypoxia PET tracers.
Hypoxia positron emission tomography (PET) imaging can identify tumors with low local control probability following radio-chemotherapy (CRT) [Citation1]. For FMISO PET in head and neck squamous cell carcinoma (HNSCC) patients the maximum tumor to background ratio (TBRmax) is a potential prognostic parameter. Reported median TBRmax varies strongly between studies. Values of 1.3 [Citation2], 1.5 [Citation3,Citation4] and 2.2 [Citation5] have been reported. FAZA, a different hypoxia PET tracer, shows comparable variations in median TBRmax with reported values of 1.5 [Citation6] and 1.9 [Citation7]. These differences have several possible explanations, including differing PET hardware, image reconstruction methods, imaging protocols and image analysis procedures. Indeed, in the aforementioned studies acquisition time points post-FMISO injection (p.i.) varied between 90–120 min [Citation3] and 240 min [Citation5]. Also, different definitions of background activity were used. Some studies evaluated tumor to blood values using venous blood samples [Citation3,Citation4], others evaluated tumor to muscle ratios using background signals in PET image regions of interest (ROIs) [Citation2,Citation5].
In multicenter clinical studies these differences have to be compensated, which is particularly important when quantitative parameters from FMISO PET imaging are used to stratify patients for interventional treatments, e.g. covering the gross tumor volume (GTV) with a simultaneous integrated boost technique [Citation8,Citation9]. For this purpose, a common TBRmax threshold might be used among institutions in a pragmatic approach. However, all institutions would have to ensure that quantification is consistent with the reference conditions under which the common threshold has been obtained.
The importance of standardization and harmonization has previously been outlined for FDG PET, for which the standardized uptake value (SUV) is a common quantitative measure [Citation10]. Standardization protocols and an accreditation scheme were implemented for FDG PET imaging [Citation11,Citation12]. For FMISO PET corresponding methods may be applicable as well. A major difference between FMISO and FDG PET is that for FMISO image contrast is considerably lower. While typical FMISO TBRmax values in head and neck cancer range from 1.3 to 2.2 as referenced above, a typical FDG SUVmax is 11 [Citation13]. Therefore, FMISO PET imaging is more sensitive to variations in quantification.
The potential impact of non-uniform quantification in a multicenter clinical trial setting is a reduced accuracy of treatment response prediction. Though it is known that differences on the order of some 10% in FDG SUV may occur among different institutions without standardization [Citation10,Citation14], the magnitude of the influence on prediction accuracy has not been investigated so far, neither for FDG nor for FMISO. Therefore, in this in silico study the potential consequences of lacking standardization with respect to common measures of diagnostic accuracy were investigated for FMISO PET imaging in HNSCC.
Material and methods
Patients and imaging
This study used data from 22 patients with histology proven advanced HNSCC that were enrolled in a phase II FMISO PET dose escalation study at our institution between 2009 and 2013, including 18 male and four female patients with a median age of 57 (46–75) years. Tumors were located in the hypo- and oropharyngeal region. All patients gave informed consent and were treated with definitive CRT (70 Gy in 35 fractions and concomitant 5FU/MMC for 21 patients and cisplatin for 1 patient). Seven local failures occurred and 15 patients were locally controlled. Three patients received a dose escalation of 10% to hypoxic areas as per protocol, one of them failed locally and the others were controlled. Median follow-up after RT was 25 months (1–64 months), whereas all patients with a follow-up of less than 20 months either had a local recurrence (six patients) or died shortly after the end of RT (one patient).
A planned interim analysis of the dose escalation study with 25 patients was performed, including treatment toxicities and the feasibility of the 10% dose escalation in hypoxic areas (Welz et al., submitted). In the present study the first three patients were excluded, because they were imaged in an older PET standalone scanner and thus are not fully comparable to the other datasets.
All patients underwent a treatment planning computed tomography (CT) with immobilization using a thermoplastic mask covering head and shoulders. A dynamic FMISO PET/CT was acquired following the planning CT in RT treatment position using the thermoplastic mask, a neck support and a flat table top. The FMISO PET acquisition protocol consisted of a 40 minutes dynamic scan instantly after tracer injection and two static scans acquired two hours and four hours post-injection with an acquisition time of 15 minutes, respectively. Following intravenous injection of a mean dose of 372 (315–444) MBq FMISO PET/CT images were acquired in a Siemens Biograph 16 (N = 11) or a Siemens Biograph mCT (N = 11) (Siemens Healthcare, Germany). Images were reconstructed iteratively using OSEM 3D (four iterations, eight subsets), 5 mm Gaussian filtering and CT-based attenuation correction.
Image analysis
Planning CT and PET/CT four hours p.i. were manually rigidly co-registered for all patients (Hyperion treatment planning system). Dynamic PET data was not used in this study. An experienced radiation oncologist (SW) delineated target volumes and organs at risk in the planning CT according to the institutional standard (Oncentra Masterplan, Nucletron, The Netherlands). TBR calculations were performed in the FMISO PET images acquired four hours p.i. For the definition of PET background activity deep neck muscles were delineated by a single observer (DM) and the mean ROI signal was obtained (Rover 2.0.51, ABX GmbH, Germany). TBR was defined on a voxel-level as ratio between activity concentrations in the FMISO PET images acquired four hours p.i. and the background activity. TBRmax was calculated as the mean of the highest-valued voxels representing 0.5 cm3 of tissue (4–6 voxels) within the high-risk RT planning target volume, as proposed in a previous study [Citation5].
Analysis of predictive accuracy and the influence of non-uniform quantification
A receiver operating characteristic (ROC) analysis was carried out, which yields information about the stability of a prediction with respect to variations in the prognostic parameter. The area under the ROC curve (AUC) reduces this information to a single parameter. Therefore, it was used to investigate the effect of systematic offsets in FMISO PET quantification between different institutions on diagnostic accuracy. Moreover, true positive rates (TPR), false positive rates (FPR), negative predictive values (NPV), positive predictive values (PPV) and log-rank p-values were calculated for TBRmax offsets between + 20% and + 20% and a constant threshold separating low and high uptake tumors (median TBRmax over all patients). The offset magnitude is representative for variations observed for FDG PET imaging [Citation10] and consequently is realistic for FMISO as well. The rationale for this approach was that a common threshold should be used in an interventional multicenter FMISO PET study, as not every participating institution can determine an optimum TBRmax threshold for its specific situation. Furthermore, study results should be transferable to other institutions which requires that PET image quantification is well reproducible with respect to its predictive accuracy.
Results
ROI-based definition of background in deep neck muscles resulted in a cohort median (range) activity concentration of 5.6 (3.9–8.8) kBq/ml. Normalized to injected FMISO activity and body weight a mean muscle SUV of 1.0 (0.8–1.4) was assessed, indicating that for some patients SUV and TBR differ considerably.
The evaluated median TBRmax was 2.0 (1.4–3.5). shows values on a patient basis for locally controlled as well as locally failed patients. The patient with the highest value died one month after the end of RT and consequently local control could not be assessed. Local tumor control was not significantly different between the two groups dichotomized by median TBRmax (log-rank p = 0.13). Additional accuracy measures are given in .
Figure 1. TBRmax in patient groups with local tumor control (N = 15) and local failure (N = 7). The horizontal line depicts the median value.
Table I. Parameters of diagnostic accuracy for different offsets: False positive and true positive rate (FPR and TPR). Positive and negative predictive value (PPV and NPV). Log rank p.
The ROC curve for the presented dataset with an AUC of 0.77 is shown in . TPRs are plotted against FPRs for varying TBRmax offsets, while maintaining the stratification threshold. Offsets increase from -20% to + 20% from left to right. Therefore, institutions systematically measuring lower TBRmax values than under reference conditions and using the reference threshold defined in the study protocol are biased towards lower TPR and FPR and vice versa.
Figure 2. ROC curve for the classification of tumors into local failure/local control groups with varying TBRmax offsets increasing from left to right and a constant TBRmax classification threshold of 2.0. Red crosses depict the estimated accuracies for offsets of -20%, -10%, 0%, + 10% and + 20% (from left to right) compared to reference conditions. The AUC is 0.77.
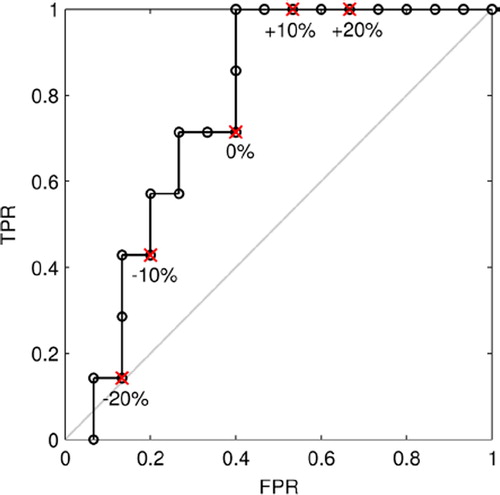
For an offset of -10% TPR and FPR were considerably reduced, whereas PPV, NPV and p remained relatively stable. An offset of + 10% resulted in an increase of TPR from 0.71 to 1.00, while the increase in FPR from 0.40 to 0.53 was modest. PPV remained stable and NPV increased from 0.82 to 1.00. Log-rank p decreased considerably to 0.03. These data indicate that a slightly lower TBRmax threshold than the median of this patient cohort allows a more accurate dichotomization. A threshold of 1.88 resulted in the optimum p of 0.007. Larger offsets had a stronger influence on accuracy. While for + 20% the TPR was 1.00, the FPR also increased considerably to 0.67. For +20% both TPR and FPR decreased to 0.14 and 0.13, respectively. Moreover, p increased strongly to 0.64. Generally, PPV and NPV are influenced less, because these values refer to the number of patients classified as predicted failure or control, whereas TPR and FPR refer to the total number of failures or controls. The former is different for each offset and the latter remains constant.
Discussion
The assumption of systematic deviations in FMISO PET quantification of up to ± 20% in this study was based on findings for FDG PET and may exceed this range in practice. Causes of these deviations were not explicitly investigated, among them are differing image reconstruction methods, poor calibration of scanners with respect to activity recovery and differences in image analysis including background ROI definition and the evaluation of maximum signals in a defined volume.
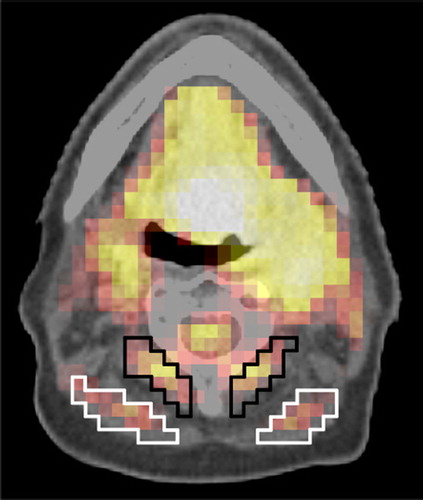
The evaluation of background activity is prone to variability, even for a single observer. Though background ROI delineation was performed as uniformly as possible in this study, it cannot be excluded that the differences between SUV and TBR are in part due to variations in background definition and not due to physiologically different muscle activity in patients. Detailed guidelines should be used to achieve consistent results among different observers, otherwise variations of 10% in background signal can easily occur (). This problem could be avoided by normalizing the maximum tumor signal to injected dose and body weight (SUVmax) instead to an image-derived background signal (TBRmax). However, SUVmax appears to be a weaker prognostic parameter [Citation5].
Figure 3. Examples of possible different background ROI definitions in neck muscles. The mean activities are 6.26 kBq/ml (SD 0.71) and 6.88 kBq/ml (SD 0.62) in the white and black region, respectively. The volumes of the black and white ROI are 3.3 cm3 and 3.9 cm3, respectively.
Median TBRmax determined in this study was on the high end of previously reported values between 1.3 and 2.2 [Citation2–5]. This may result from the late imaging time point four hours p.i. compared to studies reporting lower numbers. A significant difference in local control for stratification by median TBRmax was not found, however, significance was observed for a lower threshold that is optimal with respect to p. Final results will be reported when the phase II dose escalation study has been completed.
Prediction of local tumor control using TBRmax from FMISO PET imaging is sensitive to variations in quantification. In this study it was estimated that already a minor offset of ± 10% considerably influences prediction accuracy. A higher offset of ± 20% results in further deterioration of accuracy. For positive offsets many normoxic tumors are falsely classified as hypoxic, whereas for negative offsets many hypoxic tumors are false classified as normoxic. In a clinical trial this would weaken the apparent efficacy of an intervention, because the proportion of patients with normoxic tumors receiving experimental treatment as well as of patients with hypoxic tumors in the control group would increase.
Consequently, a multicenter study protocol should include mandatory measures for a standardized FMISO PET image acquisition and quantification. PET scanner cross-calibration could be performed by phantom measurements as proposed in the EARL accreditation scheme for FDG PET [Citation12]. The protocol should also include all details about patient preparation, patient positioning, imaging timepoints and PET image reconstruction [Citation15]. It may also be necessary to use identical software tools to process and analyze the data. Furthermore, the definition of background ROIs must be described in detail to ensure inter-observer reproducibility. An alternative to avoid error-prone background definition by multiple observers may be to define a background via blood samples taken at the imaging time point. Central image evaluation could be another option, though this would require central resources. In summary, it is challenging to standardize these aspects in a multicenter protocol to limit variations to below 10%.
An FMISO PET based treatment intervention, e.g. a dose escalation within the GTV, must as well be based on a standardized prescription outlined in the study protocol [Citation16]. Furthermore, the hypoxic escalation volume must be stable during the course of RT, which is the case for FMISO [Citation17,Citation18]. However, these aspects are out of the scope of this paper.
The results of this study also apply to hypoxia PET imaging during CRT. This is important because it has been concluded in a previous study that FMISO PET imaging after 20–30 Gy allows a more reliable prediction of local control [Citation5]. Comparable results were reported for FAZA with respect to the stability of hypoxic volumes [Citation19]. At this imaging time point image contrast is slightly lower than at baseline.
Conclusions
The impact of variability in FMISO PET quantitation has been investigated in this in silico study. A considerable reduction of predictive accuracy with respect to local control induced by offsets of ± 10% and ± 20% in TBRmax was observed. Consequently, in multicenter trials deviations from reference conditions between institutions should be restricted to below 10%. Careful standardization and harmonization of all steps from patient preparation to image analysis is necessary. It is likely that this conclusion applies to all nitroimidazole hypoxia PET tracers.
Declaration of interest: The authors report no conflicts of interest. The authors alone are responsible for the content and writing of the paper.
References
- Horsman MR, Mortensen LS, Petersen JB, Busk M, Overgaard J. Imaging hypoxia to improve radiotherapy outcome. Nat Rev Clin Oncol 2012;9:674–87.
- Kikuchi M, Yamane T, Shinohara S, Fujiwara K, Hori S, Tona Y, et al. 18F-fluoromisonidazole positron emission tomography before treatment is a predictor of radiotherapy outcome and survival prognosis in patients with head and neck squamous cell carcinoma. Ann Nucl Med 2011;25: 625–33.
- Rajendran JG, Schwartz DL, O’Sullivan J, Peterson LM, Ng P, Scharnhorst J, et al. Tumor hypoxia imaging with [F-18] fluoromisonidazole positron emission tomography in head and neck cancer. Clin Cancer Res 2006;12: 5435–41.
- Dirix P, Vandecaveye V, De Keyzer F, Stroobants S, Hermans R, Nuyts S. Dose painting in radiotherapy for head and neck squamous cell carcinoma: Value of repeated functional imaging with (18)F-FDG PET, (18)F-fluoromisonidazole PET, diffusion-weighted MRI, and dynamic contrast-enhanced MRI. J Nucl Med 2009;50:1020–7.
- Zips D, Zöphel K, Abolmaali N, Perrin R, Abramyuk A, Haase R, et al. Exploratory prospective trial of hypoxia- specific PET imaging during radiochemotherapy in patients with locally advanced head-and-neck cancer. Radiother Oncol 2012;105:21–8.
- Mortensen LS, Johansen J, Kallehauge J, Primdahl H, Busk M, Lassen P, et al. FAZA PET/CT hypoxia imaging in patients with squamous cell carcinoma of the head and neck treated with radiotherapy: Results from the DAHANCA 24 trial. Radiother Oncol 2012;105:14–20.
- Souvatzoglou M, Grosu AL, Röper B, Krause BJ, Beck R, Reischl G, et al. Tumour hypoxia imaging with 18F-FAZA PET in head and neck cancer patients: A pilot study. Eur J Nucl Med Mol Imaging 2007;34:1566–75.
- Thorwarth D, Eschmann SM, Paulsen F, Alber M. Hypoxia dose painting by numbers: A planning study. Int J Radiat Oncol Biol Phys 2007;68:291–300.
- Hoeben BAW, Bussink J, Troost EGC, Oyen WJG, Kaanders JHAM. Molecular PET imaging for biology-guided adaptive radiotherapy of head and neck cancer. Acta Oncol 2013;52:1257–71.
- Boellaard R. Standards for PET image acquisition and quantitative data analysis. J Nucl Med 2009;50:11S–20S.
- Boellaard R, Oyen WG, Hoekstra C, Hoekstra O, Visser E, Willemsen A, et al. The Netherlands protocol for standardisation and quantification of FDG whole body PET studies in multi-centre trials. Eur J Nucl Med Mol Imaging 2008; 35:2320–33.
- Boellaard R, Hristova I, Ettinger S, Sera T, Stroobants S, Chiti A, et al. EARL FDG-PET/CT accreditation program: Feasibility, overview and results of first 55 successfully accredited sites. J Nucl Med 2013;54:2052.
- Kikuchi M, Koyasu S, Shinohara S, Usami Y, Imai Y, Hino M, et al. Prognostic value of pretreatment 18F-fluorodeoxyglucose positron emission tomography/CT volume-based parameters in patients with oropharyngeal squamous cell carcinoma with known p16 and p53 status. Head Neck Epub 2014 Jul 21.
- Fahey FH, Kinahan PE, Doot RK, Kocak M, Thurston H, Poussaint TY. Variability in PET quantitation within a multicenter consortium. Med Phys 2010;37:3660–6.
- Sattler B, Lee JA, Lonsdale M, Coche E. PET/CT (and CT) instrumentation, image reconstruction and data transfer for radiotherapy planning. Radiother Oncol 2010; 96:288–97.
- Håkansson K, Specht L, Aznar MC, Rasmussen JH, Bentzen SM, Vogelius IR. Prescribing and evaluating target dose in dose-painting treatment plans. Acta Oncol 2014;53:1251–6.
- Bittner M-I, Wiedenmann N, Bucher S, Hentschel M, Mix M, Weber WA, et al. Exploratory geographical analysis of hypoxic subvolumes using 18F-MISO-PET imaging in patients with head and neck cancer in the course of primary chemoradiotherapy. Radiother Oncol 2013;108:511–6.
- Okamoto S, Shiga T, Yasuda K, Ito YM, Magota K, Kasai K, et al. High reproducibility of tumor hypoxia evaluated by 18F-fluoromisonidazole PET for head and neck cancer. J Nucl Med 2013;54:201–7.
- Bollineni VR, Koole MJB, Pruim J, Brouwer CL, Wiegman EM, Groen HJM, et al. Dynamics of tumor hypoxia assessed by 18F-FAZA PET/CT in head and neck and lung cancer patients during chemoradiation: Possible implications for radiotherapy treatment planning strategies. Radiother Oncol 2014;113:198–203.