
ABSTRACT
Background. Tumour hypoxia can be measured by FMISO-PET and negatively impacts local tumour control in patients with head and neck squamous cell carcinoma (HNSCC) undergoing radiotherapy. The aim of this post hoc analysis of a prospective clinical trial was to investigate the spatial variability of FMISO hypoxic subvolumes during radio-chemotherapy and the co-localisation of these volumes with later recurrences as a basis for individualised dose prescription trials with dose escalation defined by FMISO-PET.
Methods. Sequential FMISO scans of 12 (of 25) patients presenting residual hypoxia taken before (FMISOpre) and during (FMISOw1–FMISOw5) radio-chemotherapy were analysed regarding the stability of the FMISO subvolumes and, in case of local failure, their correlation to local relapse.
Results. Consecutive FMISO-PET positive volumes could be classified as moderately stable with Dice conformity indices of 62% and 58% up to the second week of treatment. Substantial volumetric variation during treatment was observed, with more than 20% geographic miss in all patients and more than 40% in half of the patients. The localisation of the maximum standardised uptake value (SUVmax) differed with a mean distance of 7.0 mm and 13.5 mm between the pre-therapeutic and first or second FMISO-PET during treatment. A stable hypoxic consensual volume (i.e. overlap of pre-therapeutic FMISO and intra-treatment FMISO subvolumes up to week two, generated by different contouring methods) was determined for six patients with imaging information of local recurrence. Three of these six local recurrences were located within this consensual volume.
Conclusions. Our data suggest that selective dose painting to hypoxic tumour subvolumes requires adaptation during treatment and sufficient margins. An alternative strategy is to escalate the dose to the gross tumour volume, accepting lesser escalation of dose outside hypoxic areas if indicated by constraints for organs at risk.
Despite progress in radio-(chemo)therapy (RCT) during the last decades, prognosis of locally advanced non-HPV-induced head and neck squamous cell carcinoma (HNSCC) is not satisfactory with overall survival below 50% after five years [Citation1]. Tumour hypoxia is a well recognised adverse prognostic factor after RCT in these tumours [Citation2–4]. Underlying reasons include the oxygen effect, i.e. higher radioresistance in the absence of oxygen [Citation5], which can be expressed by the oxygen enhancement ratio (OER). In addition it has been demonstrated that hypoxia mediated selection of resistant cells, e.g. cells with diminished apoptotic potential, may result in a more aggressive tumour biology and clinical phenotype [Citation6]. A non-invasive method to assess tumour hypoxia in patients is positron emission tomography (PET) with hypoxia-specific radiotracers, e.g. [18F]FMISO ([18F]fluoromisonidazole, in the following FMISO), [18F]FAZA, [64Cu]Cu-ATSM or [18F]EF5 [Citation7–9]. Several clinical studies have shown the prognostic value of hypoxia detection by PET for outcome of RCT [Citation8,Citation10]. Based on these findings, treatment intensification in tumours with high uptake of hypoxia tracers has been widely discussed [Citation11–13]. Strategies include application of hypoxia modifying or hypoxic cell sensitising drugs [Citation14], use of radiation qualities which show a lesser OER, such as neutron- or carbon-beams, or radiation dose escalation [Citation15]. The latter approach may be either directed exclusively to hypoxic tumour subvolumes by dose painting techniques [Citation11,Citation16,Citation17] or to the complete gross tumour volume [Citation4]. Of key importance to judge the relative merit of these two options are the questions whether the localisation of hypoxic subvolumes within the tumour remains stable during RCT and whether recurrences occur at the site of previous hypoxic tumour subvolumes. Several studies have shown that the spatial distribution of hypoxia before or during treatment may vary, although some recent studies indicated that the localisation of hypoxic tumour subvolumes is relatively constant at least in a proportion of patients [Citation18–20].
In an exploratory prospective clinical trial in patients treated by RCT for advanced HNSCC we have shown previously that residual tumour hypoxia determined by FMISO-PET during the second treatment week was associated with poor local tumour control (LC) and local progression-free survival (LPFS) [Citation21]. The present analysis focuses on patients from this trial who presented residual tumour hypoxia during treatment and therefore would be candidates for dose escalation. We assessed whether the localisation of FMISO-PET-positive subvolumes was stable during treatment and whether these hypoxic subvolumes may be indicative for the site of local failure.
Methods
Patients and treatment
Patients of our explorative prospective trial on the prognostic value of repeated hypoxia-specific FMISO-PET imaging during RCT have been evaluated in this post hoc analysis. Details have been reported previously [Citation21]. Briefly, 25 patients (22 males, three females) with indication for primary RCT in curative intent for locally advanced HNSCC received FMISO-PET before and during the course of RCT. All target volumes were defined in the pre-treatment FDG-PET/CT. Treatment was applied as three- dimensional (3D)-conformal or intensity-modulated radiotherapy with 72 Gy to the primary tumour and involved lymph nodes, 59.4 Gy to the lymphatic drainage, applied as accelerated and partly hyperfractionated schedule according to [Citation22] and simultaneous chemotherapy with 5-fluoruracil and either Cisplatin (21 patients) or Mitomycin C (four patients). The study (NCT00180180) was approved by the local ethics committee.
PET/CT-imaging
PET data acquisition in the trial was described in detail before [Citation21]. Briefly, a Biograph 16W PET/computed tomography (CT) (Siemens Medical Solutions Inc., Knoxville, TN, USA) containing a 16-slice CT scanner was used for image acquisition. The FMISO-PET tracer was synthetised by the Institute of Radiopharmaceutical Cancer Research at the Helmholtz-Zentrum Dresden-Rossendorf. For the present analysis, the static FMISO images acquired at 4 h post-injection (p.i.) after administration of 250–300 MBq were used, because they provided the highest contrast [Citation23]. For each dataset, one field of view (FOV; 15.8 cm in z-axis) was scanned for 15 min. Emission images with CT-based attenuation-correction were reconstructed. Before treatment and during follow-up visits, diagnostic whole body FDG-PET/CT scans, 60 min p.i. of 350 MBq [18F]FDG (FDG, GlucoRos®, Helmholtz-Zentrum Dresden-Rossendorf, Germany), were acquired for every patient. CT scans for attenuation correction, as well as for electron density determination, were performed in cranio-caudal direction from skull base to upper thighs. Before the start of RCT, a FDG-PET (FDG) and FMISO-PET (FMISOpre) scan were acquired. During treatment, three additional FMISO scans were performed: After the first (FMISOw1), second (FMISOw2) and fifth week of treatment (FMISOw5). All PETs before and during RCT were performed in treatment position using thermoplastic masks. Due to technical reasons, the FMISOw1 scan was not performed in Patient 5.
Follow-up
Follow-up comprised clinical examination and alternating FDG-PET/CT and/or magnetic resonance imaging (MRI) scans every three months for the first two years and every six months thereafter. All follow-up FDG PET/CTs were performed at the institution conducting the clinical trial. If clinically indicated, further endoscopy and/or histological examinations were performed.
Image analysis, delineation of volumes of interest and fusion of images
For the analysis of the FMISO scans, maximum standardised uptake value (SUVmax) was calculated and the determination of maximum tumour to background values (TBRmax) required the additional delineation of a volume of interest (VOI) within the deep neck muscles to define background activity. The rigid registration of the initial FDG and the sequential FMISO scans as well as the registration of the available imaging of tumour recurrences were manually performed by experienced physicians. To preclude inter-observer variation, all FMISO positive subvolumes were delineated manually by the same board-certified radiologist (NA) for the evaluation of stability of hypoxic subvolumes. However subvolumes delineated by the other investigators were similar and the selection of another reference delineator would not change the conclusions of this study. For the FDG volumes before treatment and, if available, of recurrent disease, delineation was performed by the automatic adaptive thresholding segmentation algorithm described by Hofheinz [Citation24] after delineation of an amply sphere around the primary tumour. According to the results of our trial [Citation21] the median TBRmax of 1.93 was used as cut-off to define residual hypoxia after the second week of RCT, thereby classifying 12 of the 25 patients as carrying “hypoxic tumours” at this time point. TBRmax was used as it was found out to be of highest prognostic relevance in multivariate analysis of our previously published prospective trial [Citation21].
The overlap of the sequential scans before and during RCT in the same patients was calculated as the Dice index. In addition the bilateral mean contour distance (BMCD) of the sequential FMISO scans was determined. The BMCD is obtained by summing up the average minimal distances of any voxel on one contour to the sequential contour and vice versa and finally calculating the mean distance [Citation25].
To evaluate whether the FMISO subvolume before RCT is a suitable target volume for a selective dose escalation approach (e.g. dose painting according to FMISO voxels) two methods were used. As a first approach, all FMISO contours during treatment (FMISOw1,w2,w5) were merged to one subvolume. This subvolume (FMISO during therapy) reflects all locations that were classified as hypoxic at any time during therapy. To quantify the proportion of the FMISO subvolume during therapy that would not be covered by the initial FMISOpre, the Geographic Miss index was calculated between the FMISOpre volume and the merged FMISO subvolume during therapy (without consideration of margins for PTV) analogously as described in the literature [Citation26]. This approach was used to estimate the proportion of the residual hypoxic subvolumes during treatment that would be localised outside a boost volume planned on FMISOpre. In a second approach we investigated whether stable hypoxic subvolumes are present during the initial part of the course of RCT (pretherapeutic to Week 2), that are observer-independent classified as hypoxic, and whether these subvolumes are associated with the location of local failures. This is of interest as it might be argued that temporary hypoxic regions have less prognostic relevance for local recurrence than hypoxic subvolumes with a stable localisation over a period of time. Therefore a consensual stable hypoxic core subvolume (c-s subvolume) was defined as hypoxic subvolume which is observer-independent and stable up to the second week of treatment. Stability was assessed by using the overlap of the hypoxic/FMISO-positive subvolumes in the FMISOpre, FMISOw1 and FMISOw2 scan. To obtain a consensual subvolume that would reproducibly be assigned as a potential target volume for a dose painting approach, the FMISO scans were delineated by NA, KZ, RP without knowledge of the other contours or patient outcomes. Subsequently, one automatic contouring algorithm [Citation27] was used for defining the FMISO subvolumes. The overlap of all four contours was classified as consensual subvolume. Additionally all hypoxic subvolumes (FMISO pre,w1,w2,w5) were merged and the percentage of this FMISO union of the pretherapeutic FDG tumour volume was calculated. As a consequence obtaining the relative tumour volume which was hypoxic at any time during treatment
To judge whether local failures occur within the previously hypoxic volumes, available imaging data of local relapse were rigidly registered to the initial FMISO- and FDG-scans and the FMISO scan after the first and second week of RCT. Seven of the 12 patients classified as having residual hypoxia at Week 2 presented with local recurrence. Imaging of the local recurrence was evaluable for six of these patients: five patients presented with early recurrence (two detected by CT, three by FDG-PET/CT) and one patient presented with late recurrence (39 months) in FDG-PET/CT. This latter recurrence showed minimal overlap with some FMISO-PET delineation volumes but not with all consensual volumes/FDG volume and therefore can reflect either local recurrence or second primary cancer. This patient is included in the present analysis (Patient 8). One patient had clinical and histological proven local relapse but no recognisable tumour recurrence in MRI. This patient had to be excluded from analysis because of lack of spatial information.
The six patients with residual hypoxia at Week 2 and imaging information of local recurrence were analysed regarding the overlap and the distance between geometric centres of the recurrent tumour volume and the FMISO and FDG subvolumes after rigid image registration. To exclude inaccuracies caused by rigid registration, the patients with minimal and average overlap (Patients 8 and 11) were also fused by non-rigid registration. For this purpose a Diffeomorphic Demon algorithm, implemented in 3D Slicer, was used [Citation28,Citation29].
Statistics and calculations
Comparison of contours and calculation of indices were performed using in-house software, which has been previously described in detail [Citation30]. GraphPad Prism 5 (Graphpad Software, La Jolla, CA, USA) was used for plotting of graphs and calculation of means and medians.
Results
The poor LPFS of patients with tumours showing residual hypoxia at Week 2 of treatment, i.e. after 18–20 Gy of RCT was confirmed as previously published (, for detailed patients’ characteristics see ).
Figure 1. Local progression-free survival for patients categorized as hypoxic during therapy with TBRmax > 1.93 in FMISOw2 (n = 12).
Table I. Patients' characteristics.
The size of the hypoxic tumour subvolumes varied during treatment in the individual patients, both increase and decrease were observed (). As depicted in the hypoxic volumes in sequential FMISO scans showed some but no complete overlap, as indicated by median Dice indices of 62% (range 17–76%; FMISO pre vs. w1), 58% (range 17–77%; FMISOw1 vs. w2) and 29% (range: 7–57%; FMISOw2 vs. w5). The median bilateral contour distance was 5.5 mm, 6.7 mm and 9.2 mm (), median distance of the SUVmax in the sequential scans was 7.0 mm, 13.5 mm and 8.2 mm (), respectively. Calculation of the Geographic Miss index between FMISOpre and the merged FMISO subvolumes during therapy revealed a miss greater than 20% for all patients (range 22–90.7%), the absolute hypoxic subvolumes outside the FMISOpre boost volume ranged from 5.2 to 176.7 ml (). The relative (based on FDG) tumour volume which was hypoxic at least for one timepoint during treatment reached from 36.4% to 296.8% with a high variability between individual patients (average 105%, median 62%).
Figure 2. FMISO stability during treatment, boxplot showing 50% quartiles, whiskers showing whole range. (A) Dice index (Dice) with percentage of overlap, (B) bilateral mean contour distance (BMCD) and (C) distance of SUVmax between corresponding sequential FMISO scans.
Table II. Variations of FMISO hypoxic subvolumes during treatment.
Table III. Stability of hypoxic subvolume.
The analysis of the localisation of local recurrence compared to hypoxic subvolumes before or during RCT in six patients with local recurrence is summarised in , Patients 1 and 8 are shown as an example in . For all patients stable consensual (c-s) hypoxic tumour subvolumes of FMISOpre, w1, w2 could be defined (mean c-s volume 1.0 ml, range 0.2–1.8 ml). Overlap of the c-s subvolume with the volume of recurrence was observed in three of six patients. The closest distance between contours of recurrent tumour and consensual region in the remaining three patients was 0.5 mm, 14.4 mm and 22.2 mm. The average distance between geometric centres of recurrent tumour volume and PET subvolumes was smallest for pretherapeutic FDG-PET (23.7 mm) and largest for consensual-stable FMISO subvolume (29.6 mm) (). To assess whether the spatial separation of the c-s hypoxic volumes from the recurrences is caused by rigid registration used in this study, additional non-rigid registration was performed for the patient with the maximum distance between the volumes (#8) and a patient with an average overlap (#11). The results of the non-rigid and rigid registration were similar, with no overlap in Patient 8 and remaining minimal overlap in Patient 11.
Figure 3. (A) Co-registration of FMISO subvolumes (FMISOpre = black, FMISOw1 = white, FMISOw2 = red, FMISOw5 = green) as delineated by one observer (NA) and projection of the location of maximum FMISO uptake (#) in serial FMISO-scans during therapy. Shown are the planning CTs with fusion of the FMISOw2-PET for two representative patients (# 1 and #8). Please note that the longitudinal distance between SUVmax (not shown here) substantially contributes to calculated distances. (B) Rigid co-registration of planning CT and PET-CT of local recurrence for the same patients with contours of FMISOpre (black) and FMISOw2 (red), pre-RT FDG-PET (light blue) and volume of recurrence (green). FMISO delineations of one observer (NA).
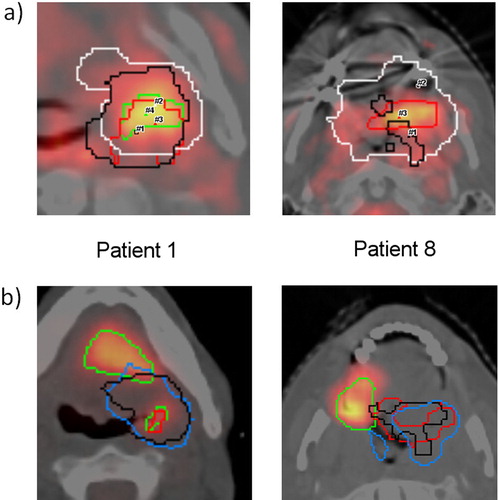
Table IV. Overlap and distances between geometric centres of recurrent tumour volume and FDG/FMISO PETs before/during treatment.
Discussion
While considerable evidence supports prognostic value of hypoxia-specific PET for patients' outcome [Citation4], the clinical implications of hypoxic subvolumes for biology-based treatment planning remains controversial. Initial studies found a lack of spatial reproducibility of the FMISO signal before radiotherapy [Citation18]. Recent investigations showed high to moderate reproducibility between repeated pre-therapeutic FMISO scans [Citation19] or between sequential FMISO scans during therapy [Citation20]. The question whether hypoxic tumour subvolumes remain spatially stable before and during radiotherapy is important for clinical trials on dose escalation using selective dose painting boost approaches [Citation17].
In our study the mean overlap of hypoxic subvolumes in sequential scans determined as Dice index was within the lower range of published values [Citation20]. However, determination of the Dice index has limitations for identification of spatially stable hypoxic subvolumes. For example, extension of the hypoxic subvolume over time may result in insufficient target coverage for hypoxia-adapted radiation dose distributions although the Dice index may remain high. Vice versa the Dice index may significantly decrease when hypoxic subvolumes shrink during treatment although they are still fully included in the initial hypoxic subvolume and would be fully covered by the prescribed radiation dose to hypoxic tumour areas. We therefore additionally determined the Geographic Miss index as the percentage of the hypoxic subvolume during therapy which is located outside the pre-treatment FMISO subvolume. The Geographic Miss index was higher than 20% in all patients (up to 91%), indicating that a dose painting approach based on the pre-treatment FMISO PET bears substantial risk of lesser dose then intended to all tumour volumes which are hypoxic at any time during the course of treatment. Of additional concern is that the position of the SUVmax varied considerably between the sequential FMISO scans, the mean distances were 9.3–19.0 mm (). This is a higher degree of variability than the mean value of 4 mm reported previously by others for repeated scans before treatment [Citation19]. Although SUVmax may be a less important parameter for radiation oncology compared to the FMISO positive volume, relevant variability in the position of this parameter may be important for voxel-based dose prescription [Citation11].
To address the question whether dose escalation to the hypoxic tumour subvolumes may be a promising strategy from a target definition point of view, we assessed whether recurrences occurred at the site of the hypoxic subvolumes identified in FMISOpre to FMISOw2 and compared it to pre-therapeutic FDG-PET in the six patients in which the site of local recurrence after radiotherapy was documented by imaging. This is to our knowledge the first study that correlates the pattern of local failure to FMISO subvolumes before and during treatment. The consensual hypoxic subvolumes determined by three independent observers and one automatic algorithm in the pretreatment scans overlapped partly with the volume of recurrence in four of six patients. Results were slightly better for hypoxic subvolumes determined in Week 1 (six overlaps) or Week 2 (five overlaps). A stable consensual hypoxic volume, i.e. consensual hypoxia at all three time points, could be calculated in all six patients (0.2–1.8 ml), suggesting that a small permanently hypoxic core subvolume was present in all patients with recurrence. This stable consensual hypoxic subvolume showed an overlap with three of six local recurrences. Analysis of the geometric centre distance between the recurrences revealed average distances of more than 2 cm to the hypoxic subvolumes at the different time points and the stable core hypoxic volume. Taken together our observations indicate that the recurrences originate in proximity but not necessarily within the hypoxic subvolumes identified during treatment. This suggests that selective dose escalation to the pretherapeutic hypoxic subvolume or by adaptive techniques to hypoxic tumour subvolumes during the course of treatment bears potential for improving LC rates, under the prerequisite that safety margins are sufficiently wide [Citation31,Citation32]. An alternative and somewhat more pragmatic strategy which is equally supported by the data presented here is to escalate the dose to the gross tumour volume, accepting heterogeneity with lesser escalation of dose outside hypoxic areas if indicated by constraints for organs at risk (OAR).
We acknowledge the limitations that not only the macroscopic visible hypoxic tumour subvolumes but also small hypoxic regions which currently escape imaging methods may cause local recurrence. An additional obstacle is that definition of hypoxia using PET imaging is not standardised and delineation of hypoxia shows considerable inter-observer and inter-algorithm heterogeneity [Citation33]. Furthermore volumes of radio-morphological or PET-functional recurrences were rather large and therefore the site of origin of tumour recurrence bears considerable uncertainties. Pragmatically, we therefore evaluated whether there was a volume overlap, based on the assumption that a missing overlap between FMISO volumes and recurrent tumour virtually excludes that the recurrence originated from that subvolume. Another limitation of the present study is the change of patient's anatomy after treatment especially as all patients presented with advanced T3/T4 tumours. The anatomical changes combined with the limitations of rigid image registration of the recurrent tumour volumes underline that the specification of percentage volume overlap of recurrent disease and (pre-) treatment imaging have exploratory character and smaller differences should not be overestimated.
From a biological point of view it has to be emphasised that PET imaging using misonidazole detects only hypoxia lower than 10 mmHg while intermediate hypoxia with higher pO2 values, which currently cannot be detected by FMISO-PET imaging, has been shown to be also relevant for LC after fractionated radiotherapy [Citation34]. Despite this limitation, the pronounced effect demonstrated for residual PET hypoxia on LC in our previous study [Citation21] supports that macroscopic hypoxic subvolumes either directly impact the probability of LC or are correlated with the magnitude of intermediate hypoxia or that both are surrogate markers of other parameters determining tumour radioresistance. The latter hypothesis is in line with data presented by Yaromina et al. that showed in a panel of HNSCC xenografts that tumour control dose 50% was significantly associated with the hypoxic fraction in untreated tumours when irradiation was given under clamped blood flow, i.e. under conditions of homogeneous complete hypoxia in all tumours [Citation5]. However, recent data by Schütze and colleagues in a preclinical tumour model, i.e. in tumours of the same genetic background, showed that dose escalation to microPET FMISO hypoxic tumours resulted in significant increase of LC [Citation35]. This result as well as previous investigation in the same and a large variety of other tumour models studied in different laboratories which demonstrated improved tumour control after application of hypoxic cell sensitisers, support that hypoxia also directly impacts LC after radiotherapy.
The high Geographic Miss index of pretherapeutic hypoxic subvolumes and the observation that recurrences originate in proximity but not necessarily within the hypoxic subvolumes identified before and during treatment suggest that selective dose painting to hypoxic tumour subvolumes requires adaptation during treatment and sufficient margins. An alternative strategy which would also be in line with the data presented here and is supported by a recent publication on FDG uptake and recurrence localisation [Citation36], is to escalate the dose to the gross tumour volume defined by FDG-PET, accepting lesser escalation of dose outside hypoxic areas if indicated by constraints for OAR. A multicentre trial within the German Cancer Consortium (DKTK) testing the latter approach is currently awaiting approval.
Acknowledgements
Anna Bandurska-Luque is acknowledged for collecting some follow-up data. The study was supported by the German Federal Ministry of Education and Research (BMBF contract 03ZIK42/OncoRay) and partially financed by the German Cancer Consortium (DKTK). The authors report no conflicts of interest. The authors alone are responsible for the content and writing of the paper.
Declaration of interest: The authors report no conflicts of interest. The authors alone are responsible for the content and writing of the paper.
References
- Begg AC. Predicting recurrence after radiotherapy in head and neck cancer. Semin Radiat Oncol 2012;22:108–18.
- Nordsmark M, Bentzen SM, Rudat V, Brizel D, Lartigau E, Stadler P, et al. Prognostic value of tumor oxygenation in 397 head and neck tumors after primary radiation therapy. An international multi-center study. Radiother Oncol 2005;77:18–24.
- Brizel DM, Sibley GS, Prosnitz LR, Scher RL, Dewhirst MW. Tumor hypoxia adversely affects the prognosis of carcinoma of the head and neck. Int J Radiat Oncol Biol Phys 1997;38:285–9.
- Horsman MR, Mortensen LS, Petersen JB, Busk M, Overgaard J. Imaging hypoxia to improve radiotherapy outcome. Nat Rev Clin Oncol 2012;9:674–87.
- Yaromina A, Thames H, Zhou X, Hering S, Eicheler W, Dörfler A, et al. Radiobiological hypoxia, histological parameters of tumour microenvironment and local tumour control after fractionated irradiation. Radiother Oncol 2010;96: 116–22.
- Graeber TG, Osmanian C, Jacks T, Housman DE, Koch CJ, Lowe SW, et al. Hypoxia-mediated selection of cells with diminished apoptotic potential in solid tumours. Nature 1996;379:88–91.
- Rasey JS, Koh WJ, Evans ML, Peterson LM, Lewellen TK, Graham MM, et al. Quantifying regional hypoxia in human tumors with positron emission tomography of [18F]fluoromisonidazole: A pretherapy study of 37 patients. Int J Radiat Oncol Biol Phys 1996;36:417–28.
- Mortensen LS, Johansen J, Kallehauge J, Primdahl H, Busk M, Lassen P, et al. FAZA PET/CT hypoxia imaging in patients with squamous cell carcinoma of the head and neck treated with radiotherapy: Results from the DAHANCA 24 trial. Radiother Oncol 2012;105:14–20.
- Koch CJ, Scheuermann JS, Divgi C, Judy KD, Kachur AV, Freifelder R, et al. Biodistribution and dosimetry of (18)F-EF5 in cancer patients with preliminary comparison of (18)F-EF5 uptake versus EF5 binding in human glioblastoma. Eur J Nucl Med Mol Imaging 2010;37:2048–59.
- Eschmann S-M, Paulsen F, Reimold M, Dittmann H, Welz S, Reischl G, et al. Prognostic impact of hypoxia imaging with 18F-misonidazole PET in non-small cell lung cancer and head and neck cancer before radiotherapy. J Nucl Med 2005;46:253–60.
- Thorwarth D, Eschmann S-M, Paulsen F, Alber M. Hypoxia dose painting by numbers: A planning study. Int J Radiat Oncol Biol Phys 2007;68:291–300.
- Hendrickson K, Phillips M, Smith W, Peterson L, Krohn K, Rajendran J. Hypoxia imaging with [F-18] FMISO-PET in head and neck cancer: Potential for guiding intensity modulated radiation therapy in overcoming hypoxia-induced treatment resistance. Radiother Oncol 2011;101:369–75.
- Hoeben BAW, Bussink J, Troost EGC, Oyen WJG, Kaanders JHAM. Molecular PET imaging for biology-guided adaptive radiotherapy of head and neck cancer. Acta Oncol 2013;52:1257–71.
- Rischin D, Peters LJ, O’Sullivan B, Giralt J, Fisher R, Yuen K, et al. Tirapazamine, cisplatin, and radiation versus cisplatin and radiation for advanced squamous cell carcinoma of the head and neck (TROG 02.02, HeadSTART): A phase III trial of the Trans-Tasman Radiation Oncology Group. J Clin Oncol 2010;28:2989–95.
- Lee NY, Mechalakos JG, Nehmeh S, Lin Z, Squire OD, Cai S, et al. Fluorine-18-labeled fluoromisonidazole positron emission and computed tomography-guided intensity-modulated radiotherapy for head and neck cancer: A feasibility study. Int J Radiat Oncol Biol Phys 2008;70:2–13.
- Dirix P, Vandecaveye V, De Keyzer F, Stroobants S, Hermans R, Nuyts S. Dose painting in radiotherapy for head and neck squamous cell carcinoma: Value of repeated functional imaging with (18)F-FDG PET, (18)F-fluoromisonidazole PET, diffusion-weighted MRI, and dynamic contrast-enhanced MRI. J Nucl Med 2009;50:1020–7.
- Chang JH, Wada M, Anderson NJ, Lim Joon D, Lee ST, Gong SJ, et al. Hypoxia-targeted radiotherapy dose painting for head and neck cancer using (18)F-FMISO PET: A biological modeling study. Acta Oncol 2013;52:1723–9.
- Nehmeh SA, Lee NY, Schröder H, Squire O, Zanzonico PB, Erdi YE, et al. Reproducibility of intratumor distribution of (18)F-fluoromisonidazole in head and neck cancer. Int J Radiat Oncol Biol Phys 2008;70:235–42.
- Okamoto S, Shiga T, Yasuda K, Ito YM, Magota K, Kasai K, et al. High reproducibility of tumor hypoxia evaluated by 18F-fluoromisonidazole PET for head and neck cancer. J Nucl Med 2013;54:201–7.
- Bittner M-I, Wiedenmann N, Bucher S, Hentschel M, Mix M, Weber WA, et al. Exploratory geographical analysis of hypoxic subvolumes using (18)F-MISO-PET imaging in patients with head and neck cancer in the course of primary chemoradiotherapy. Radiother Oncol 2013;108:511–6.
- Zips D, Zöphel K, Abolmaali N, Perrin R, Abramyuk A, Haase R, et al. Exploratory prospective trial of hypoxia- specific PET imaging during radiochemotherapy in patients with locally advanced head-and-neck cancer. Radiother Oncol 2012;105:21–8.
- Budach V, Becker E-T, Boehmer D, Badakhshi H, Jahn U, Wernecke K-D, et al. Concurrent hyperfractionated accelerated radiotherapy with 5-FU and once weekly cisplatin in locally advanced head and neck cancer. The 10-year results of a prospective phase II trial. Strahlenther Onkol 2014; 190:250–5.
- Abolmaali N, Haase R, Koch A, Zips D, Steinbach J, Baumann M, et al. Two or four hour [18F]FMISO-PET in HNSCC. When is the contrast best? Nukl Nucl Med 2011;50:22–7.
- Hofheinz F, Pötzsch C, Oehme L, Beuthien-Baumann B, Steinbach J, Kotzerke J, et al. Automatic volume delineation in oncological PET. Evaluation of a dedicated software tool and comparison with manual delineation in clinical data sets. Nukl Nucl Med 2012;51:9–16.
- Crum WR, Camara O, Hill DLG. Generalized overlap measures for evaluation and validation in medical image analysis. IEEE Trans Med Imaging 2006;25:1451–61.
- Muijs CT, Schreurs LM, Busz DM, Beukema JC, van der Borden AJ, Pruim J, et al. Consequences of additional use of PET information for target volume delineation and radiotherapy dose distribution for esophageal cancer. Radiother Oncol 2009;93:447–53.
- Haase R, Böhme H-J, Zips D, Abolmaali N. Swarm intelligence for medical volume segmentation: The contribution of self-reproduction. In: Bach J, Edelkamp S, editors. KI 2011: Advances in artificial intelligence. Berlin, Heidelberg: Springer Berlin Heidelberg; 2011. p. 111–21.
- H. Johnson, Y. Zhao. BRAINSDemonWarp: An application to perform demons registration. Insight J 2009;Jan-Jun.
- Fedorov A, Beichel R, Kalpathy-Cramer J, Finet J, Fillion-Robin J-C, Pujol S, et al. 3D Slicer as an image computing platform for the Quantitative Imaging Network. Magn Reson Imaging 2012;30:1323–41.
- Haase R, Abolmaali, N. A modular software system for image analysis in positron emission tomography. Workshop on Tomography, data processing and image reconstruction for medicine and engineering. 2012; Helmholtz-Zentrum Dresden-Rossendorf, Dresden.
- Sterpin E, Differding S, Janssens G, Geets X, Grégoire V, Lee JA. Generation of prescriptions robust against geometric uncertainties in dose painting by numbers. Acta Oncol 2015;54:253–60.
- Alber M, Thorwarth D. Multi-modality functional image guided dose escalation in the presence of uncertainties. Radiother Oncol 2014;111:354–9.
- Henriques de Figueiredo B, Merlin T, de Clermont-Gallerande H, Hatt M, Vimont D, Fernandez P, et al. Potential of [(18)F]-Fluoromisonidazole positron-emission tomography for radiotherapy planning in head and neck squamous cell carcinomas. Strahlenther Onkol 2013;189:1015–9.
- Wouters BG, Brown JM. Cells at intermediate oxygen levels can be more important than the “hypoxic fraction” in determining tumor response to fractionated radiotherapy. Radiat Res 1997;147:541–50.
- Schütze C, Bergmann R, Brüchner K, Mosch B, Yaromina A, Zips D, et al. Effect of [(18)F]FMISO stratified dose-escalation on local control in FaDu hSCC in nude mice. Radiother Oncol 2014;111:81–7.
- Due AK, Vogelius IR, Aznar MC, Bentzen SM, Berthelsen AK, Korreman SS, et al. Recurrences after intensity modulated radiotherapy for head and neck squamous cell carcinoma more likely to originate from regions with high baseline [18F]-FDG uptake. Radiother Oncol 2014;111:360–5.