
Abstract
Aim To explore the potential of scanned helium ion beam therapy (4He) compared to proton therapy in a comparative planning study focusing on pediatric patients. This was motivated by the superior biological and physical characteristics of 4He.
Material and methods For eleven neuroblastoma (NB), nine Hodgkin lymphoma (HL), five Wilms tumor (WT), five ependymoma (EP) and four Ewing sarcoma (EW) patients, treatment plans were created for protons and 4He. Dose prescription to the planning target volume (PTV) was 21 Gy [relative biological effectiveness (RBE)] (NB), 19.8 Gy (RBE) (HL), 25.2 Gy (RBE) for the WT boost volume and 54 Gy (RBE) for EP and EW patients. A pencil beam algorithm for protons (constant RBE = 1.1) and 4He was implemented in the treatment planning system Hyperion. For 4He the relative biological effectiveness (RBE) was calculated with a ‘zonal’ model based on different linear energy transfer regions.
Results Target constraints were fulfilled for all indications. For NB patients differences for kidneys and liver were observed for all dose-volume areas, except the high-dose volume. The body volume receiving up to 12.6 Gy (RBE) was reduced by up to 10% with 4He. For WT patients the mean and high-dose volume for the liver was improved when using 4He. For EP normal tissue dose was reduced using 4He with 12.7% of the voxels receiving higher doses using protons. For HL and EW sarcoma patients the combination of large PTV volumes with the position of the organs at risk (OARs) obliterated the differences between the two particle species, while patients with the heart close to the PTV could benefit from 4He.
Conclusion Treatment plan quality improved with 4He compared to proton plans, but advantages in OAR sparing were depending on indication and tumor geometries. These first results of scanned 4He therapy motivate comprehensive research on 4He, including acquisition of experimental data to improve modeling of 4He.
Physical, biological and clinical properties of different ion species were first examined for radiation oncology purposes in the early 1950s at the Lawrence Berkeley Laboratory (UCLBL) using protons and helium ions [Citation1]. Between 1975 and 1992 about 1700 patients were treated at the UCLBL with helium and neon ions [Citation2]. These particles were used for the treatment of meningioma, tumors of the skull base, bone sarcoma, adenocarcinoma and uveal melanoma and good results in terms of clinical outcome were reported [Citation3–5].
Today’s particle therapy facilities focus on protons and carbon ions mostly due to economical factors, e.g. moderate startup costs for protons.
Helium ions (4He), being in a similar linear energy transfer (LET) range as protons, offer an improved relative biological effectiveness (RBE) and oxygen enhancement ratio, while potentially allowing for less demanding biological modeling compared to carbon ions. Biological experiments for helium ions showed a higher RBE in the Bragg-Peak region of up to 1.6, and the OER at 10% survival was found to decrease from 2.9 to 2.6 in the peak region when compared to protons [Citation6–9]. These are certainly advantageous features for eradication of radio-resistant hypoxic tumors. Due to their physical and biological properties charged particles heavier than protons and lighter than carbon, like helium ions are an attractive option for achieving highest conformity while sparing the adjacent tissue [Citation3]. For protons the beam penumbra at greater depths is comparable to that of high energy photon beams while 4He having four times the mass of a proton, are less affected by multiple scattering. Beam broadening and range straggling is reduced by a factor of two [Citation9]. Consequently, this leads to a sharper beam penumbra at all depths potentially reducing the dose deposition perpendicular to the beam. Additionally the more pronounced Bragg peak and a steeper dose fall-off behind the Bragg peak could help to increase the conformity of the dose distribution [Citation10].
Especially for pediatric patients 4He could have the potential to reduce the volume of irradiated normal tissue, without bringing the disadvantage of additional dose caused by the fragmentation tail, like it is observed for carbon ions [Citation11]. This could not only improve the dose distribution for small tumor lesions, but also reduce the total overall dose for children suffering from large tumors, potentially reducing side effects and secondary cancer induction [Citation12–15]. In a treatment planning study the real clinical benefits of a 4He treatment for pediatric patients could be explored above the theoretical advantages predicted from the physical and biological properties.
In order to investigate the clinical benefits of 4He and to benchmark them against protons a treatment planning system (TPS) suitable to calculate biological and physical doses for organs at risk (OAR) and tumor tissue is essential. A research version of an 4He dose calculation algorithm was developed [Citation16] and implemented into a TPS, allowing biologically weighted dose calculation for protons and 4He [Citation17,Citation18].
For our first “in-silico” pre-clinical evaluation of 4He we focused on pediatric patients and tumor sites commonly treated with protons, i.e. Neuroblastoma (NB), Hodgkin lymphoma (HL), Wilms tumors (WT), ependymoma (EP) and Ewing sarcoma (EW). Based on these indications the difference between proton and 4He dose distributions and the resulting effects on OARs, the tumor volume and the surrounding normal tissue were investigated.
Materials and methods
Patients
Eleven pediatric patients diagnosed with NB (range 1.7–6.9 years), nine patients suffering from HL (7/9 between 15 and 18 years, two only 6 years old), five WT (range 3.3–7.7 years), five EP (2/5 younger than 5 years, three patients between 12 and 25 years) and four EW (3.8, 14.3, 24.9 and 25.7 years) patients were selected.
Clinical target volume (CTV) delineation for NB (CTVNB) and WT (CTVWTinital) patients included the pre-operative gross target volume (GTV) and areas of local lymph node enlargement. In case of WT patients an additional boost volume (CTVWTboost) was defined on the macroscopic tumor remainder after surgery. CTV definition for HL (CTVHL) patients included the GTV and the involved lymph nodes at diagnosis adapted to the post-chemotherapy anatomy. The EP CTV (CTVEP) included the tumor bed at the primary site and macroscopic residual tumor after surgery plus 0.5 cm uniform margin. For EW patients the tumor extent at diagnosis plus a 2 cm safety margin was irradiated. For NB, WT and HL additional margins were added to construct the planning target volume (PTV), consisting of 8 mm in anterior-posterior and lateral and 15 mm in cranio-caudal direction. The PTV margin for EP was 0.5 cm in all directions. For patients under the age of 14, the vertebral body including an isotropic margin of 5 mm was included into the PTV to avoid asymmetrical growth. All treatment volumes were defined according to international treatment protocols (European Low and Intermediate Risk Neuroblastoma Protocol: A SIOPEN Study, SIOP 2001/GPOH, EuroNet-PHL-C1; Ependymoma: SIOP Ependymoma II, ET-13-002; Ewing: Ewing2008, 2008-003658-13).
Due to the patient’s age the body volume varied essentially for the different patient groups, namely it ranged from 2221–6791 cm3, 6529–44012 cm3, 4208–6812 cm3, 4631–29352 cm3 and 4850–6305 cm3 for NB, HL, WT, EP and EW patients, respectively. Also the size of the PTVs showed essential differences that are depicted in and listed in . In general the OARs defined for plan evaluation and/or optimization depended on the tumor location and included the liver, kidneys, spinal cord, heart, lungs, and breasts and for brain tumors chiasma, optical nerves, hypophysis and eyes.
Figure 1. Axial and coronal CT slices of representative patients for all indications: (a) Neuroblastoma, (b) Wilms tumor, (c) Hodgkin Lymphoma (d) Ewing sarcoma, (e) Ependymoma. Color figure available online.

Table 1. Dosimetric evaluation of PTV coverage parameters (median values of all patients in the respective group and corresponding ranges) for protons and 4He. Mean PTV volumes including standard deviation (MV ± SD) and PTV ranges are given in the case column. *marks a p-value <0.05.
Treatment techniques
For NB the prescribed dose (Dpres) was 21.0 Gy (RBE) (14 fractions) [ICRU50], for HL 19.8 Gy (RBE) (11 fractions) and for EP 54 Gy (RBE) (30 fractions). Two dose levels were irradiated in WT patients, 14.4 Gy (RBE) to PTVWTinitial plus 10.8 Gy (RBE) to PTVWTboost in 14 fractions. EW sarcoma patients were separated in two groups, one patient was irradiated with two dose levels of 36 Gy (RBE) and a boost up to 54 Gy (RBE) and the other three patients with 54 Gy (RBE) in 30 fractions. Treatment plans were accepted if at least 95% of the respective PTV (PTVNB, PTVHL, PTVEP, PTVEW and PTVWTboost) was covered by 95% of the prescribed dose. In order to facilitate a reliable comparison the same beam configuration was used for protons and 4He ions. NB and HL patients received one single or two opposing beams from anterior (and posterior) direction, while WT, EP and EW patients were planned with one posterior and one or two lateral beams (90° or/and 270°).
All intensity-modulated treatment plans were based on spot scanning and created using a research version of the TPS Hyperion, which was modified to allow biologically optimized treatment planning for protons and 4He [Citation16].
Up to now, no clinical 4He beam line is in operation. Therefore, beam line characteristics for 4He and protons were simulated using Monte Carlo methods, assuming hypothetical beam data that were based on realistic geometries used in proton and carbon ion facilities.
Beam energies ranged up to 220 MeV/u were considered with an initial energy spread of 1.5 MeV/u and beam emittance and divergence were set to zero. For tumors located close to the surface a range shifter corresponding to 3 cm water equivalent material was assumed and modeled by the TPS. Spot sizes of the Gaussian shaped initial beams at Nozzle exit were taken as 3 mm approximately corresponding to a FWHM of 7 mm. The calculation grid size was 3 × 3×3 mm3, with beam spots arranged on a 4 × 4 mm2 grid.
For protons a constant RBE value of 1.1 was assumed [Citation19], while for 4He a depth-dependent “zonal” RBE model was employed [Citation18]. In the plateau region, i.e. up to approximately 15 mm of the residual range a RBE of 1.1 was assumed, followed by an increasing RBE up to 1.6 at the Bragg peak and a constant RBE of 1.6 distal to the Bragg peak region. The LET dependent RBE model was based on cell line experiments performed in passively scattered 4He beams in Japan [Citation7,Citation9] and on historical data from Berkeley [Citation8,Citation16,Citation20].
Treatment plan analysis
For each patient cohort PTV median (D50%), near minimum (D98%) and near maximum (D2%) RBE weighted doses were evaluated. D98% above 90% was aimed for Dpres, while the maximum allowed D2% was 107% of Dpres [Citation21]. Furthermore, the homogeneity index (HI) [Citation21]
and the conformity index (CI) [Citation22] were calculated
where VPTV98% represents the PTV sub-volume encompassed by the 95% isodose line, VPat95% the total volume of the patient encompassed by the 95% isodose line and VPTV the total volume of the PTV.
OAR doses were compared using averaged dose-volume histograms (DVH) and dosimetric parameters. D50%, D2% and the low- (LDVol), median- (MDVol), and high-dose (HDVol) volumes were considered, defined as the volumes receiving 20%, 50% and 80% of Dpres. For body structure evaluation various DVH points between 1% and 95% were statistically compared.
Furthermore, differences in dose distribution were analyzed using dose difference maps (DDM). Dose distributions for 4He treatment plans were subtracted voxel by voxel from the corresponding proton plan distributions. In any case, dose differences smaller than 1 Gy (RBE) were disregarded.
Statistical analysis
The signed Wilcoxon-Rank sum test was used for parameter comparison regarding the proton plans as reference. Results were assumed as significant for p-values smaller than or equal to 0.05. Median values were used for plan comparison while all results including the corresponding ranges are listed in and .
Table 2. Summary of DVH evaluation parameters for OARs comparing proton and 4He treatment plans (median values of all patients in the respective group and corresponding ranges). *marks a p-value <0.05.
Results
Target structures
summarizes all target-related volume and evaluation parameters for all indications.
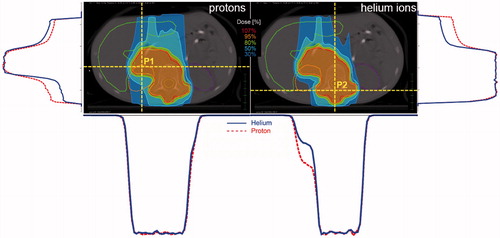
For NB patients the median D50% was 21.6 Gy (RBE) and did not exceed 103% for a single patient. Although both particle species covered the target well, a significantly improved V95% was found for 4He. Isodoses for representative NB patients are depicted in including the corresponding dose profiles. Comparable target coverage could be achieved for HL and EP patients using protons and 4He, whereas the PTV received a median D50% of 20.1 Gy (RBE) and 54.8 Gy (RBE), respectively, and never exceeded 102%. D50% for EW patients was comparable for both treatment techniques within 0.9 Gy (RBE) and never exceeded 102%. For NB, HL, EP and EW patients D2% and D98% did not differ between p and 4He and remained below 105% and above 90%, respectively. HI and CI were also comparable between 4He and protons for these four indications ranging from 0.09 to 0.13 and from 76.6% to 90.1%, respectively.
Figure 2. Isodose distributions (left: protons, right: 4He) of a representative Neuroblastoma patient. Corresponding horizontal and vertical dose profiles for two positions on the depicted slice are shown as well. The profiles on the left side (vertical profile) and below the proton isodose distribution (horizontal profile) belong to P1, the one on the right side (vertical profile) and below the 4He distribution (horizontal profile) belong to P2. The solid lines (blue) of the dose profiles represent 4He, the dotted (red) protons. Color figure available online.
Results differed for the WT patients having two dose levels (PTVWTinitial and PTVWTboost). Using 4He resulted in V95%=96.2% for PTVboost and V95%=95.1% for protons. D98% for PTVWTboost showed better values for 4He and was always above 90%. D2% was 104% for both treatment modalities. The dose fall-off between PTVWTboost and PTVWTinital was found to be steeper for 4He, which was also reflected in a superior HI. For PTVWTinitial-PTVWTBoost the median D50% was 108% for 4He and protons.
Organs at risk
It was found that differences in OAR and body doses were mainly correlated with the size of the tumor and the patient’s body size, resulting in most pronounced variations for NB and EP patients having the smallest PTV and body volumes. Detailed dose-volume parameters and significance levels (with respect to the proton plan) are summarized in .
Neuroblastoma patients
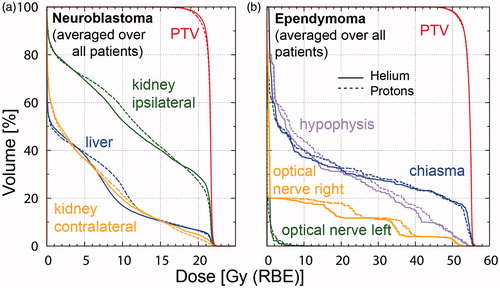
Kidneys, liver and spinal cord were of peculiar interest for the NB patients. The spinal cord could not be spared explicitly since the vertebral body was included in the PTV for all patients. MDVol for the ipsilateral and contralateral kidneys and the liver was significantly reduced using 4He, i.e. by 11%, 15% and 39%, respectively. For LDVol pronounced differences comparing the single patients were observed, whereas for the HDVol area protons and 4He performed equally well. DVH curves averaged over all NB patients are shown in .
Figure 3. DVH curves for (a) Neuroblastoma patients (averaged over all patients) showing PTV (red), liver (blue) and kidneys (contralateral: orange and ipsilateral: green); (b) Ependymoma (averaged over all patients) displaying PTV (red), optical nerves (left: green and right: orange), hypophysis (purple) and chiasma (blue). The solid lines represent 4He and the dotted lines protons. Color figure available online.
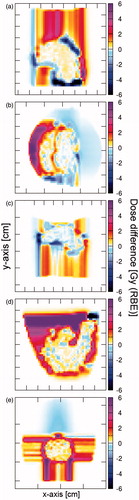
Also the body volume receiving 0.2–12.6 Gy (RBE) was significantly reduced by 1–15% for 4He-based treatment plans. This was underlined by the DDM demonstrating that 9.1% (range 4.9–18.3%) of the voxels receive a higher dose in the proton plans and only 4.5% (range 2.7–10.9%) in the 4He plan (p < 0.05). Voxels receiving higher doses in the 4He-based treatment plans were located within or at the border of the PTV. Voxels with higher doses in the proton plan were dominantly located in the surrounding tissue, as illustrated in for a representative patient.
Figure 4. Dose difference maps of a representative patient for all indications: (a) Neuroblastoma, (b) Wilms tumor, (c) Hodgkin lymphoma, (d) Ewing sarcoma, (e) Ependymoma. The red shaded areas represent the voxel receiving more dose in the proton plans, the blue shaded ones receiving more dose in the 4He plan. Color figure available online.
Hodgkin lymphoma patients
For lungs, thyroid and heart no significant difference could be observed when comparing 4He and proton plans. LDVol, MDVol and HDVol for the contralateral lung could be reduced by 6% using 4He. Body volumes receiving up to 11.9 Gy (RBE) did not differ significantly, while differences between proton and 4He were on average 4% for the median HDVol. When comparing the dose distribution for 6/9 patients more voxel received higher doses in the proton plan than in the 4He plan, demonstrated in for a representative patient.
Wilms tumor patients
Relevant OARs for WT patients were liver, contralateral kidney and spinal cord. The ipsilateral kidney and the spinal cord were located within the target volume or the vertebral body, respectively, and therefore not considered for the dosimetric evaluation. For the contralateral kidney MDVol was reduced by 1–17% using 4He. For the included patients the HDVol of the liver were reduced by 6–35% comparing 4He and proton plans.
The evaluation of the dose distribution in the whole body showed median differences up to 14%. Only the body volume receiving 0.3 Gy (RBE) was 29% higher in 4He plans when compared to proton plans, exemplarily depicted in . As PTVWTinitial covered large parts of the thorax region, i.e. between 674 and 1548 cm3, a big part of the normal tissue received high doses, e.g. V7.6Gy (RBE) ranged from 20% to more than 50% for the patients included in this study.
Ependymoma patients
The chiasma, optical nerves, eyes and the hypophysis were considered in the OAR dose evaluation. In 4/5 patients D50% to the eyes and optical nerves was lower than 0.8 Gy (RBE) with no significant difference between protons and 4He. The median LDVol, MDVol and HDVol of the hypophysis over all five EP patients were lower by 13–22% for the 4He plans. No difference was observed for the chiasma comparing the two treatment modalities. DVH curves averaged over all EP patients are shown in .
The comparison of the DDM showed better results for 4He with 12.7% (range 6.0–14.1) of the voxels receiving a higher dose in the proton plans and only 0.5% (range 0.2–4.6) in the 4He plan, depicted in . The same tendency was observed for the normal tissue volumes receiving 1–48.6 Gy (RBE) with volumes smaller up to 13% in the 4He plans.
Ewing sarcoma
Comparable to the HL patients, the relevant OARs for the EW sarcoma patients were the spinal cord, heart, vertebral body and the lungs. The spinal cord as well as the vertebral body were located within the PTV for 2/4 patients and close to the PTV for the other two cases resulting in comparable doses for protons and 4He. The heart to PTV distance was larger than five computed tomography (CT) slices in 2/4 patients, in the other two D50% was reduced by more than 4.5 Gy (RBE) when using 4He. The mean dose to the contralateral lung never exceeded 4.5 Gy (RBE). Up to 7% larger ipsilateral lung LDVol, MDVol and HDVol were irradiated in the proton plans. Dose difference map analysis () revealed no difference between proton and 4He plans and also the dose in the remaining body (body volume minus PTV and OARs) was comparable.
Discussion
Treatment plan creation using 4He was feasible with the same treatment planning software and resulted in slightly better plans with respect to OAR sparing for selected patients and tumor geometries when compared to proton plans. Especially for the young NB patients the dose to the liver, the kidney and the total body volume could be reduced essentially (). DDM () showed that most voxels in the surrounding tissue and the OARs received less dose for 4He beam therapy. Similar reductions were also observed for Ependymoma patients.
Dosimetric differences in treatment plans between 4He and proton therapy were smaller than expected from literature that focused on single beams and physical and biological properties [Citation9,Citation10], especially in the target region. Previous investigations of the physical properties of 4He ions showed a reduction in beam broadening due to scattering of a factor of two as well as a considerably sharper beam penumbra and Bragg peak. For the larger volumes investigated in this study these properties showed only limited influence on the final treatment plans. This might be explained by the choice of the patient collective and the multiple beam arrangements.
Although recent debates about the optimal particle species with focus on helium ions are ongoing, so far no beam data for spot scanning helium ion beam lines was published. To have assumptions as comparable as possible, the same spot size after the Nozzle exit was employed for 4He as it is used for protons in clinical conditions. This is a conservative approach, as due to the reduced scattering of helium ions, smaller beam sizes compared to protons should be achievable. This might contribute to the underestimation of the differences observed in the treatment planning study.
The biological model implemented for helium ions was based on the hypothesis that for low LET radiation (LET lower than 20 keV/μm) simpler models suffice [Citation18]. No golden standard for a biological model could be established in ion beam therapy facilities that are in operation at the moment [Citation6]. For carbon ions, two main biological models, MKM and LEM are in use. LEM is clinically used in version I and was steadily improved to the most recent version LEM IV. For protons the clinical practice is to use a constant RBE of 1.1, which so far could not be refuted by clinical results or biological experiments. However, a dose dependent RBE for protons is increasingly discussed. Overall a strong request exists within the particle therapy community for finding an international consensus and standard for biologically effective dose calculation in ion beam treatment planning [Citation6].
Uncertainties and differences exist in currently established biological models for carbon ion therapy. Adapting such biological models for helium ions outweighs the benefit of applying such a model at this stage, especially due to the lack of clinical and biological data for 4He.
In the absence of experimental evidence of a significant dose dependence of RBE for helium ions, only an implicit LET dependence was modeled [Citation18] which is the current clinical practice for protons. A dose and tissue dependency of the RBE could potentially have a non-negligible effect for slowly proliferating tumors, especially with respect to hypofractionation. Therefore, the applied RBE model for 4He is a limitation of the current study, which is hard to overcome with the existing published 4He data.
The beam spot energies showed a Gaussian distribution and the mean energy was about 120 MeV/u for all indications. These low energies were mainly caused by the superficial tumor position and the rather small body volumes. For example, up to energy of approximately 140 MeV/u, differences in beam width are below 3 mm, even though beam broadening is noticeably smaller for 4He than for protons. For higher energies required for deep-situated tumors this difference in lateral beam broadening increases up to 8 mm [Citation10]. Considering the clinically used calculation grid and CT resolution this difference might potentially have more influence on dose distributions. Dose profiles showed most pronounced variations in the entrance region for those parts of the tumor that were not positioned at the surface of the body (see ).
Differences observed between protons and 4He can be explained by improved biological effectiveness of 4He in the Bragg peak region as well as the physical characteristics, as shown by our evaluations employing extended dose plateaus. Dose reductions in the beam entrance region due to improved physical characteristics of 4He accounted for one third of the total dose reduction compared to protons.
Treatments with 4He or 3He are theoretically possible at (existing) synchrotron-based facilities. Due to medical arguments and the reduced lateral straggling in matter 4He seems to be the better choice over 3He. For the use of 4He in a clinical setting a retuning of the beam line and bending magnets as well as a new ion source are required [Citation11]. Gantries designed for carbon ions can be adapted for 4He. Even existing proton gantries could be used for bending 4He in the low energy area, e.g. a gantry designed for 250 MeV protons should be capable of delivering 4He up to 125 MeV/u. Further, it should be noted that moving towards 4He might also require new dosimetry protocols, which is also a topic currently under investigation [Citation23].
Every ion species brings advantages and drawbacks. For example, an increasing atomic number leads to reduced scattering and consequently more pronounced dose fall-offs, allowing in theory more conformal treatment. However, disadvantages are an additional dose deposition behind the Bragg peak due to fragmentation, increased LET values outside the target area and a decreased RBE at the distal part of the spread-out Bragg peak [Citation24]. In general organ geometry, energies required for target coverage and biological tumor characteristics might influence the choice of the optimal ion species. The selection of the ion type to modulate the isoeffective dose for specific clinical conditions is a promising but theoretical approach for optimizing the RBE distribution over the target and for sparing the adjacent tissue in an optimal way. The increased LET, the varying RBE and for heavier ions the better oxygen enhancement ratio make particles like protons, helium, carbon, neon or oxygen ions suitable for such new concept [Citation9,Citation25–28], which requires continuous research. Focusing on these possibilities one may not forget that the biological uncertainties have to be considered, which may be an exclusion criteria for some patients who may not benefit from ion beam therapy at its current stage.
Further investigation and treatment planning comparisons are essential to identify clinical situations that could profit from the use of 4He ions. Another limitation of this study was the optimizer implemented in the Hyperion TPS struggling with dose optimization in the steep dose fall of area that might have caused the decreased target conformity for the helium ion plans. Large tumor sizes located close to the surface considered in this study might have obliterated differences between 4He and protons. Only hypothetical beam data with a literature-based biological model was available as basis for treatment plan calculation. However, both limitations can be overcome by implementing data of a clinical helium ion beam line in our research TPS as soon as one becomes available.
Acknowledgments
The financial support by the Federal Ministry of Science, Research and Economy and the National Foundation for Research, Technology and Development is gratefully acknowledged.
References
- Blakely EA, Ngo FQH, Curtis SB, Tobias CA. Heavy-Ion Radiobiology: Cellular Studies. Adv Radiat Biol. 1984;11:295–389.
- Orecchia R, Zurlo A, Loasses A, Krengli M, Tosi G, Zurrida S, et al. Particle beam therapy (hadrontherapy): basis for interest and clinical experience. Eur J Cancer. 1998;34:459–68.
- Kaplan ID, Castro JR, Phillips TL. Helium charged particle radiotherapy for meningioma: experience at UCLBL. University of California Lawrence Berkeley Laboratory. Int J Radiat Oncol Biol Phys. 1994;28:257–61.
- Linstadt D, Quivey JM, Castro JR, Andejeski Y, Phillips TL, Hannigan J, et al. Comparison of helium-ion radiation therapy and split-course megavoltage irradiation for unresectable adenocarcinoma of the pancreas. Final report of a Northern California Oncology Group randomized prospective clinical trial. Radiology. 1988;168:261–4.
- Char DH, Kroll SM, Castro J. Ten-year follow-up of helium ion therapy for uveal melanoma. Am J Ophthalmol. 1998;125:81–9.
- Kamada T, Tsujii H, Blakely EA, Debus J, De Neve W, Durante M, et al. Carbon ion radiotherapy in Japan: an assessment of 20 years of clinical experience. Lancet Oncol. 2015;16:e93–e100.
- Kase Y, Kanai T, Matsumoto Y, Furusawa Y, Okamoto H, Asaba T, et al. Microdosimetric measurements and estimation of human cell survival for heavy-ion beams. Radiat Res. 2006;166:629–38.
- Raju MR, Amols HI, Bain E, Carpenter SG, Cox RA, Robertson JB. A heavy particle comparative study. Part III: OER and RBE. Br J Radiol. 1978;51:712–9.
- Kempe J, Gudowska I, Brahme A. Depth absorbed dose and LET distributions of therapeutic 1H, 4He, 7Li, and 12C beams. Med Phys. 2007;34:183–92.
- Ströbele J, Schreiner T, Fuchs H, Georg D. Comparison of basic features of proton and helium ion pencil beams in water using GATE. Z Med Phys. 2012;22:170–8.
- Winkelmann T, Cee R, Haberer T, Naas B, Peters A. Test bench to commission a third ion source beam line and a newly designed extraction system. Rev Sci Instrum. 2012;83:02B904
- Knausl B, Lutgendorf-Caucig C, Hopfgartner J, Dieckmann K, Kurch L, Pelz T, et al. Can treatment of pediatric Hodgkin's lymphoma be improved by PET imaging and proton therapy? Strahlenther Onkol. 2013;189:54–61.
- Holtzman A, Flampouri S, Li Z, Mendenhall NP, Hoppe BS. Proton therapy in a pediatric patient with stage III Hodgkin lymphoma. Acta Oncol. 2013;52:592–4.
- Jorgensen AY, Maraldo MV, Brodin NP, Aznar MC, Vogelius IR, Rosenschold PM, et al. The effect on esophagus after different radiotherapy techniques for early stage Hodgkin's lymphoma. Acta Oncol. 2013;52:1559–65.
- Mu X, Bjork-Eriksson T, Nill S, Oelfke U, Johansson KA, Gagliardi G, et al. Does electron and proton therapy reduce the risk of radiation induced cancer after spinal irradiation for childhood medulloblastoma? A comparative treatment planning study. Acta Oncol. 2005;44:554–62.
- Fuchs H, Ströbele J, Schreiner T, Hirtl A, Georg D. A pencil beam algorithm for helium ion beam therapy. Med Phys. 2012;39:6726–37.
- Fuchs H, Knäusl B, Diekmann K, Georg D. OC-0393 Can particle beam therapy be improved using helium ions? - A treatment planning study focusing on pediatric patients. Radiother Oncol. 2014;111.
- Fuchs H, Alber M, Schreiner T, Georg D. Implementation of spot scanning dose optimization and dose calculation for helium ions in Hyperion. Med Phys. 2015;42:5157–66.
- ICRU ICRU Report 78, Prescribing, Recording, and Reporting Proton Beam Therapy. J Icru 2007.
- Raju MR, Gnanapurani M, Martins B, Howard J, Lyman JT. Measurement of oxygen effect and biological effectiveness of a 910 MeV helium ion beam using cultured cells. Technical Report. California Univ., Berkeley. Lawrence Radiation Lab., 1970 Dec. Report No.: UCRL–20190; CONF-701103–7.
- ICRU ICRU Report 83, Prescribing, Recording, and Reporting Intensity-Modulated-Photon-Beam Therapy(IMRT). J Icru 2010.
- Paddick I. A simple scoring ratio to index the conformity of radio-surgical treatment plans. Technical note. J Neurosurg 2000;93:219–22.
- Spindeldreier K. First energy loss and fragmentation measurements of therapeutic 4He ion beams with a small detector. Ptcog 2014;53:47.
- Kantemiris I, Karaiskos P, Papagiannis P, Angelopoulos A. Dose and dose averaged LET comparison of 1H, 4He, 6Li, 8Be, 10B, 12C, 14N, and 16O ion beams forming a spread-out Bragg peak. Med Phys. 2011;38:6585–91.
- Remmes NB, Herman MG, Kruse JJ. Optimizing normal tissue sparing in ion therapy using calculated isoeffective dose for ion selection. Int J Radiat Oncol Biol Phys. 2012;83:756–62.
- Brahme A. Recent advances in light ion radiation therapy. Int J Radiat Oncol Biol Phys. 2004;58:603–16.
- Friedrich T, Durante M, Scholz M. Particle species dependence of cell survival RBE: Evident and not negligible. Acta Oncol. 2013;52:589–603.
- Bassler N, Toftegaard J, Luhr A, Sorensen BS, Scifoni E, Kramer M, et al. LET-painting increases tumour control probability in hypoxic tumours. Acta Oncol. 2014;53:25–32.