
Abstract
Background Preventive measures are needed to counteract the increasing burden of cutaneous malignant melanoma (CMM). As a basis for rational melanoma prevention, we investigated geographic differences and impact from socioeconomic factors related to incidence, clinical stage at diagnosis and outcome.
Material and methods All patients with primary invasive CMM diagnosed in 2004–2013 in the southern and the western Swedish health care regions with a population of 2.9 million adults were eligible for the study. Population-based data were obtained from the national Cancer Register and the national Melanoma Quality Register. Geographic and socioeconomic differences in incidence per stage at diagnosis were mapped and correlated to excess mortality.
Results Disease mapping based on 9743 cases in 99 municipalities and 20 metropolitan districts showed marked, regional disparities in stage-specific incidence of CMM. The incidence of stage I–II tumors was higher in the western health care region, whereas the incidence of stage III–IV CMMs was higher in the southern region. The divergent incidence patterns per stage at diagnosis were consistent across population strata based on educational level. The geographic disparities in CMM stage influenced relative survival with an excess five-year mortality ratio in the southern region versus the western region of 1.49 (95% confidence interval 1.22–1.82). The excess mortality ratio for patients with low versus high educational level was 1.81 (1.37–2.40).
Conclusion Residential region and educational level influenced CMM stage and, thereby, excess mortality. These observations suggest that geographic as well as socioeconomic data should be considered in prevention of CMM.
Increasing incidence rates have been reported for cutaneous malignant melanoma (CMM) in many western countries over the past 50 years [Citation1]. In Sweden, the total number of melanomas has increased by nearly 75% during the last decade, corresponding to a 5% annually increased incidence. Australia has been a frontrunner in melanoma prevention and a decline in melanoma mortality on the population level has been demonstrated for individuals born after about 1958 [Citation2]. Several other countries, including New Zealand, the US, Canada and Norway, have succeeded in halting the incidence of melanoma in younger age groups, primarily thorough awareness programs related to the risk associated with sun exposure [Citation1]. Recently, mortality rates from CMM have leveled off, which is likely explained by improved diagnostic methods, earlier detection and new treatment possibilities, also for advanced stage disease [Citation3,Citation4].
Socioeconomic status (SES) with disparities related to education, income and occupational status have been described in relation to CMM incidence, morbidity and mortality. High SES has been associated with an increased incidence and low SES has been linked to late diagnosis and an adverse prognosis [Citation5,Citation6].
Screening for CMM has been advocated based on data suggesting that regular skin examinations allow for diagnosis of early-stage tumors and lead to reduced mortality rates [Citation7–10]. Recent reports from Germany have, however, questioned the benefit [Citation11,Citation12]. General population screening for CMM has not been implemented in Sweden, though dermatography and open-access outpatient clinics have recently been established on local or regional basis to increase access for patients with skin lesions suspected of CMM. It is of concern that SES and residential area influence participation in screening initiatives, which implies a need to ensure participation also in high-risk groups [Citation8]. With the aim to provide data to support rational CMM prevention programs, we assessed melanoma-related health disparities in relation to residential area and SES based on population-based data for 9743 CMM diagnosed 2004–2013 in southern and western Sweden, with follow-up data until the end of 2014.
Materials and methods
Study area
The study comprised the adult (≥15 years of age) population of the southern and the western health care regions in Sweden, with a population of 1.45 million and 1.49 million adult inhabitants, respectively (2013).
Patient data
Based on unique Swedish identity numbers [Citation13] cases from the population-based national Cancer Register were linked to additional data from the national Swedish Melanoma Quality Register and the Statistics Sweden’s registers. The total number of individual records in the national Melanoma Quality Register was 46 685 at the end of 2013, with a 98% coverage 1990–2013. Eligible for this study were all patients aged 15 years or older who resided in the study area at the time of diagnosis and who developed a first, primary invasive CMM diagnosed between 1 January 2004, and 31 December 2013. Data on diagnosis, sex, age and residential municipality were obtained from the Cancer Register. For the patients who lived in the two metropolitan areas of Malmö and Gothenburg, Statistics Sweden provided information on residential district (10 districts in each metropolitan area). Data on educational level were obtained from Statistics Sweden and were classified in relation to the number of school years completed at the end of diagnosis year: low ≤9 years (primary school), intermediate 10–12 years (gymnasium/pre-university level) and high ≥13 years (university level). Information on TNM stage and histopathology, according to the 2002 American Joint Committee on Cancer system [Citation14], was obtained from the Swedish Melanoma Register. Information on vital status was obtained from Statistics Sweden and the follow-up data were assessed by the survival times censored at date of emigration or 31 December 2014. Also data on CMM in situ were available from the Cancer Register and these data were separately analyzed.
Population data
Statistics Sweden provided the population data needed for incidence calculations, i.e. population size by municipality/district, year, sex and five-year age groups. We also had regional level population data which allowed for additional population stratification by educational level (for age groups ≥30 years).
Ethical approval
The study was approved by the Regional Ethical Review Board in Lund, Sweden.
Statistical analyses
Disease maps depicting how the incidence of first, primary invasive CMM in relation to clinical stage at diagnosis varied across the 99 municipalities and 20 metropolitan districts were produced by hierarchical Bayes estimation of the standardized incidence ratios. Stage III and IV were combined due to low numbers. More precisely, for all stages (total incidence) and stage I, II and III–IV, respectively, the expected number of cases in each residential area was calculated from the year, sex and age (15–19, 20–24, …, 85–89, 90+) specific incidences in the total population. The standardized incidence ratios, λi (area i=1, 2, …, 119), were estimated based on the Besag-York-Mollié (BYM) model [Citation15], which is a benchmark model in disease mapping studies [Citation16]. The BYM model specifies the hierarchical Bayes procedure, which yields “shrinkage” of the conventional observed-to-expected ratios – in line with principles for multi-level modeling [Citation17]. Moreover, the BYM model produces locally smoothed estimates. Along with a disease map, the corresponding statistical certainty map was produced based on the posterior probabilities: Each residential area with Pr(λi>1|data) > 0.80 was colored red, each area with Pr(λi<1|data) > 0.80 was colored green and the remaining areas were colored yellow. The choice of 0.80 for identifying an elevated/lowered incidence area has been shown to provide a cutoff with reasonable sensitivity and high specificity [Citation16].
By stratifying the population/case data on educational level, the regional variation in CMM incidence per stage at diagnosis was examined within each educational level group.
We calculated absolute incidences rates for specified population groups. We report age-standardized rates using the European standard population (ASR Europe; including all age groups 0–4, 5–9, 10–14, …, 85+).
The effects of the patient characteristics sex, age, residential area and educational level on the excess five-year mortality were estimated by a maximum likelihood method. The expected mortality was based on the Swedish population with life tables stratified by calendar year, age, sex and educational level (ages ≥30 years). Furthermore, the mortality impact of differential stage at diagnosis distributions related to residential area as well as to educational level was evaluated by stage standardizing to the most advantageous residential area/educational level group. This approach is according to the stage-standardized survival calculations demonstrated by Rutherford et al. [Citation6]. However, we performed stage standardization of observed relative survival curves, without fitting parametric models for residential area, educational level and stage at diagnosis. We calculated 95% confidence intervals (CIs) around the differences in the stage-standardized relative five-year survival estimates between relevant residential area/educational level groups by employing a bootstrapping method, replicating the relative survival estimates 10 000 times.
The Rapid Inquiry Facility and R programs were used for the disease mapping and statistical computations [Citation18–20].
Results
Patients included
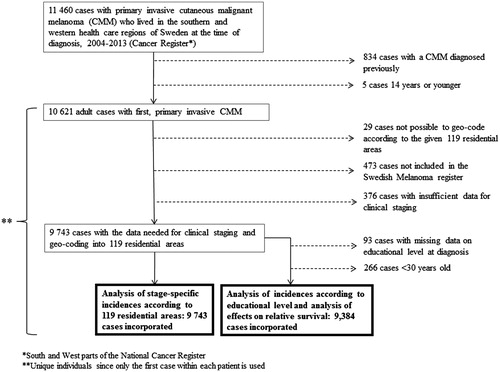
Of the 11 460 primary CMM, 10 621 eligible study patients remained after exclusion of children and patients with previous CMM. After further exclusion of 878 cases with missing geo-coding data or register data, 9743 cases remained for the study. All data analyses with regard to educational level were based on 9384 patients ≥30 years at the time of diagnosis. provides a flow chart leading to the numbers of patient included in the present analyses.
Figure 1. Identification and inclusion of study patients.
Total incidence according to residential area
The geographic variation in the incidence of first, primary invasive CMM is visualized in the disease map (). The smoothed standardized incidence ratios varied between 0.61 and 1.67 across the 119 residential areas. Overall, the disease map along with the statistical certainty map demonstrate a higher total CMM incidence in the western Swedish health care region compared to the southern health care region. The age-standardized incidence rates (ASR Europe, including all age groups) were 26.5 (95% CI 25.8–27.2) and 18.9 (18.3–19.4) per 100 000/year in the western and southern health care region, respectively. The variation in the total CMM incidence within each region appeared subordinate to the variation between the two regions ().
Figure 2. Disease map along with statistical certainty map showing geographic variation in primary invasive cutaneous malignant melanoma over 119 residential areas within the southern and western health care regions in Sweden (data from 2004–2013; range of expected number of cases across the areas: 15.2–361.6). The certainty map visualizes the posterior probabilities based on the hierarchical Bayes-smoothed standardized incidence ratios, SIR [elevated incidence area, i.e. Pr(SIR > 1|data) > 0.80, colored red; lowered incidence area, i.e. Pr(SIR < 1|data) > 0.80, colored green; the remaining areas colored yellow]. The thicker borderlines demarcate the western and southern health care regions. The two metropolitan areas with 10 districts each are enlarged.
![Figure 2. Disease map along with statistical certainty map showing geographic variation in primary invasive cutaneous malignant melanoma over 119 residential areas within the southern and western health care regions in Sweden (data from 2004–2013; range of expected number of cases across the areas: 15.2–361.6). The certainty map visualizes the posterior probabilities based on the hierarchical Bayes-smoothed standardized incidence ratios, SIR [elevated incidence area, i.e. Pr(SIR > 1|data) > 0.80, colored red; lowered incidence area, i.e. Pr(SIR < 1|data) > 0.80, colored green; the remaining areas colored yellow]. The thicker borderlines demarcate the western and southern health care regions. The two metropolitan areas with 10 districts each are enlarged.](/cms/asset/ea1f2ca1-808b-4929-a191-7f86889a3a5a/ionc_a_1144934_f0002_c.jpg)
Stage distribution
Stage distribution was I: 69.4%, II: 24.3%, III: 5.2% and IV: 1.1%. Stage II–IV tumors were statistically significantly overrepresented in men, at higher age and in patients with lower education (). From 2004–2008 to 2009–2013, the proportion of stage II tumors decreased (26.6% vs. 22.6%), while the proportion of III–IV tumors increased (5.7% vs. 6.7%). Early-stage tumors were more common in the western health care region, with 28% more stage I tumors and 17% more stage II tumors, and conversely 74% more stage III–IV CMMs were diagnosed in the southern health care region (). The age-adjusted stage-specific incidence rates in the total western population were stage I: 18.3 (95% CI 17.7–18.9) per 100 000/year, stage II: 5.0 (4.7–5.3) and stage III–IV: 1.0 (0.9–1.2) and in the southern region they were stage I: 12.4 (11.9–12.9), stage II: 3.6 (3.4–3.8) and stage III–IV: 1.5 (1.4–1.7).
Table 1. Number of study patients by clinical stage at diagnosis of cutaneous malignant melanoma, on the one hand, and socio-demographic characteristics, time period of diagnosis and health care region, on the other hand.
CMM in situ was diagnosed in 2557 and 3982 persons in the southern and western Swedish health care regions, respectively, which corresponded to ASR of 10.9 (95% CI 10.5–11.4) versus 18.1 (17.5–18.7) per 100 000/year.
Stage-specific CMM incidences in relation to residential area and educational level
The geographic variations in the stage-specific CMM incidences are visualized by the statistical certainty maps (). The geographic patterns of the stage I–II CMM incidences predominantly reflect the above-mentioned regional differences. Also, the geographic pattern of the stage III–IV CMM incidence reflects a predominantly regional difference.
Figure 3. Statistical certainty maps showing geographic variation in cutaneous malignant melanoma per stage at diagnosis over 119 residential areas within the southern and western health care regions in Sweden (data from 2004–2013; ranges of expected number of cases across the areas, stage I: 10.4–251.6, stage II: 3.8–87.5, stage III–IV: 1.0–22.6). Each certainty map visualizes the posterior probabilities based on the hierarchical Bayes-smoothed standardized incidence ratios, SIR [elevated incidence area, i.e. Pr(SIR > 1|data) > 0.80, colored red; lowered incidence area, i.e. Pr(SIR < 1|data) > 0.80, colored green; the remaining areas colored yellow]. The thicker borderlines demarcate the western and southern health care regions. The two metropolitan areas with 10 districts each are enlarged.
![Figure 3. Statistical certainty maps showing geographic variation in cutaneous malignant melanoma per stage at diagnosis over 119 residential areas within the southern and western health care regions in Sweden (data from 2004–2013; ranges of expected number of cases across the areas, stage I: 10.4–251.6, stage II: 3.8–87.5, stage III–IV: 1.0–22.6). Each certainty map visualizes the posterior probabilities based on the hierarchical Bayes-smoothed standardized incidence ratios, SIR [elevated incidence area, i.e. Pr(SIR > 1|data) > 0.80, colored red; lowered incidence area, i.e. Pr(SIR < 1|data) > 0.80, colored green; the remaining areas colored yellow]. The thicker borderlines demarcate the western and southern health care regions. The two metropolitan areas with 10 districts each are enlarged.](/cms/asset/7a03862c-4971-40e6-a475-68eb0eee2e11/ionc_a_1144934_f0003_c.jpg)
The divergent incidence patterns per stage between the two regions were systematically consistent across population strata based on educational level (). Educational level also influenced the total CMM incidence in each region, with around 30% higher standardized incidence ratio in individuals with high educational level as compared to those with low educational level ().
Table 2. Standardized incidence ratios for first, primary cutaneous malignant melanoma, per stage at diagnosis and totallyTable Footnotea.
Impact on excess mortality
After a median follow-up time of 4.2 years 1975 deaths were registered among the 9384 patients analyzed (ages ≥30 years). Thirty-seven cases were lost to follow-up due to emigration. The relative survival was worse for patients in the southern health care region in comparison to the western region () and the excess five-year mortality ratio (EMR) was 1.55 (95% CI 1.22–1.95) (). The relative survival increased in relation to educational level (), with an EMR of 2.46 (95% CI 1.83–3.31) for patients with low versus high educational level (). The multivariate model, including also patient’s age and sex, estimated an EMR of 1.49 (95% CI 1.22–1.82) for the southern versus the western region and an EMR of 1.81 (1.37–2.40) for patients with low versus high educational level ().
Figure 4. Stage-standardized relative survival for residential region (upper panel) and educational level (lower panel). The left figures are stage-standardized to the observed stage distribution (these curves are nearly identical to the observed relative survival). The other figures relate to alternative standardizations, showing relative survival estimates across regional/educational level groups that would be achieved if the stage distribution could be improved to match that of the western region (the middle figure, upper panel), the persons with high educational level (the middle figure, lower panel) or the persons in the western region with high educational level (the right figures).
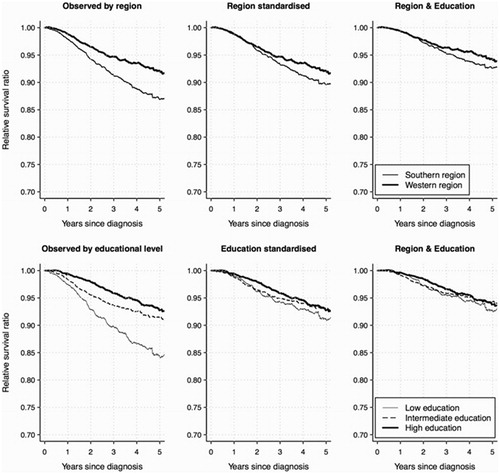
Table 3. Estimated effects of patient characteristics on the excess mortality at 5 years after diagnosis of first, primary cutaneous malignant melanoma. Reference population mortality rates were stratified by year of diagnosis, age, sex and educational level.
Stage at diagnosis is an intermediate factor for the above-mentioned effects on survival of residential region and educational level. The stage-standardized relative survival curves indicate the impact of removing the observed inequalities in the stage distributions (). If the stage distribution for the disadvantageous regional/educational level groups could be improved to match that of the “advantageous” persons in the western region with high educational level, the divergences in the relative survival curves would be reduced largely [the difference at five years since diagnosis between the regions was thereby estimated to decrease from 5.2% (95% CI 2.5–7.7%) to 1.6% (-0.7–4.0%) and the corresponding difference for high vs. low educational level was estimated to decrease from 8.5% (95% CI 4.9–12.0%) to 1.1% (-2.3–4.5%)].
Discussion
Disease mapping and excess mortality analysis for southern and western Sweden based on 9743 first, primary CMM reveal geographic differences in incidence, stage distribution and outcome. Though a higher total incidence (26.5/100 000) of CMM was found in the western health care region compared to the southern region (18.9/100 000), the incidence of stage III–IV CMMs was 50% higher in southern than in western Sweden. Municipalities or metropolitan districts with an elevated overall incidence of CMM (7/61 areas in the southern Swedish health care region and 31/58 areas in the western region; ) differ from areas with an elevated risk for advanced (stage III–IV) CMMs (59/61 areas in the southern region and none in the western region; ). The differences demonstrated are pronounced with a 66% higher incidence rate of in situ CMM and a 40% higher incidence of invasive CMM in the western health care region, linked to nearly 33% lower excess five-year mortality. The geographically disparate stage distribution is relevant to consider in relation to preventive strategies. A multitude of factors may contribute to these observations, e.g. UV-exposure, risk behavior, awareness, access to primary health care and dermatologists and diagnostic strategies, including pathologists’ principles for tumor staging. During the study period, neither guidelines to suggest CMM screening/surveillance nor structured awareness program were implemented. Data on health care access were not available. Disease mapping did not account for migration effects, but whereas latency periods are important in primary prevention [Citation18], their roles are limited in secondary prevention. Yet, temporal variations in the geographic patterns of stage-specific incidences and outcome might be an issue of concern as recent temporal changes may have an impact on secondary prevention strategies.
Educational level influences CMM stage distribution with low SES linked to melanoma thickness and advanced stage at diagnosis in studies from Europe, the US, Australia and New Zealand [Citation5,Citation6]. In accord with those previous observations, we demonstrated an inverse relationship between stage distribution and educational level with significantly higher fraction of stage I tumors in patients with higher education. These findings imply that secondary preventive programs aimed at detection of early-stage tumors should consider correction for socio-demographic disparities to promote equal use of health care resources. The divergent regional incidence patterns per stage at diagnosis were systematically consistent across the population strata based on educational level. In Sweden, the remaining life expectancy at age 30 is about five years shorter for individuals with low educational level compared to those with high educational level. In CMM, disparities related to SES also translate to disease-specific mortality [Citation21,Citation22]. We demonstrated 81% higher excess mortality five years after diagnosis for patients with low versus high educational level. Also, after correction for the death risk linked to SES (through population stratification on educational level), our result demonstrates that within each region patients with low educational level were at a higher risk of death from CMM. Excess mortality rates were also influenced by age (2.5-fold higher for age ≥70 vs. 30–49 years) and sex (1.8-fold higher for men) (). Melanoma outcome has also been demonstrated to relate to ethnicity and marital/cohabitation status [Citation23–26].
The stage-standardized relative survival curves reflect the potential for improvement if the unfavorable stage distributions could be eliminated (). These results reinforce that the differences in CMM mortality related to region and educational level were predominantly caused by the disparities in CMM stage at detection.
In summary, population-based data from southern and western Sweden demonstrate that both residential area and educational level influence CMM incidence, stage distribution and outcome. Disease maps show that a high frequency of early-stage CMM largely explains the geographical areas with the highest incidence of CMM, whereas a significantly increased risk for advanced stage CMM applies to other residential areas. Stage-specific CMM risks that take residential area as well as educational level into consideration are relevant to consider in the design of potential melanoma prevention programs as geographic as well as socioeconomic disparities cause excess mortality from CMM.
Disclosure statement
The authors report no conflicts of interest. The authors alone are responsible for the content and writing of the paper. The authors would like to thank Christian Ingvar, Johan Lyth, Hanna Eriksson and Nosrat Shahsavar for invaluable help with data from the Swedish Melanoma Register.
Related Research Data
References
- Erdmann F, Lortet-Tieulent J, Schüz J, Zeeb H, Greinert R, Breitbart EW, et al. International trends in the incidence of malignant melanoma 1953-2008-are recent generations at higher or lower risk? Int J Cancer 2013;132:385–400.
- Sneyd MJ, Cox B. A comparison of trends in melanoma mortality in New Zealand and Australia: the two countries with the highest melanoma incidence and mortality in the world. BMC Cancer 2013;13:372
- Mayer JE, Swetter SM, Fu T, Geller AC. Screening, early detection, education, and trends for melanoma: current status (2007-2013) and future directions: Part I. Epidemiology, high-risk groups, clinical strategies, and diagnostic technology. J Am Acad Dermatol 2014;71:599.e1–.e12.
- Ugurel S, Röhmel J, Ascierto PA, Flaherty KT, Grob JJ, Hauschild A. Survival of patients with advanced metastatic melanoma: The impact of novel therapies. Eur J Cancer 2015;53:125–34.
- Jiang AJ, Rambhatla PV, Eide MJ. Socioeconomic and lifestyle factors and melanoma: a systematic review. Br J Dermatol 2015;172:885–915.
- Rutherford MJ, Ironmonger L, Ormiston-Smith N, Abel GA, Greenberg DC, Lyratzopoulos G, et al. Estimating the potential survival gains by eliminating socioeconomic and sex inequalities in stage at diagnosis of melanoma. Br J Cancer 2015;112(Suppl 1):S116–23.
- Swetter SM, Geller AC. Perspective: catch melanoma early. Nature 2014;515:S117
- Aitken JF, Elwood M, Baade PD, Youl P, English D. Clinical whole-body skin examination reduces the incidence of thick melanomas. Int J Cancer 2010;126:450–8.
- Swetter SM, Pollitt RA, Johnson TM, Brooks DR, Geller AC. Behavioral determinants of successful early melanoma detection: Role of self and physician skin examination. Cancer 2012;118:3725–34.
- Katalinic A, Waldmann A, Weinstock MA, Geller AC, Eisemann N, Greinert R, et al. Does skin cancer screening save lives?: an observational study comparing trends in melanoma mortality in regions with and without screening. Cancer 2012;118:5395–402.
- Katalinic A, Eisemann N, Waldmann A. Skin cancer screening in Germany. Dtsch Arztebl Int 2015;112:629–34.
- Stang A, Jöckel K-H. Does skin cancer screening save lives? A detailed analysis of mortality time trends in Schleswig-Holstein and Germany. Cancer 2016;122:432–7.
- Ludvigsson JF, Otterblad-Olausson P, Pettersson BU, Ekbom A. The Swedish personal identity number: Possibilities and pitfalls in healthcare and medical research. Eur J Epidemiol 2009;24:659–67.
- Balch CM, Buzaid AC, Soong SJ, Atkins MB, Cascinelli N, Coit DG, et al. Final version of the American Joint Committee on Cancer staging system for cutaneous melanoma. J Clin Oncol 2001;19:3635–48.
- Besag J, York J, Mollié A. Bayesian image restoration with applications in spatial statistics. Ann Inst Math Stat 1991;43:1–20.
- Richardson S, Thomson A, Best N, Elliott P. Interpreting posterior relative risk estimates in disease-mapping studies. Environ Health Perspect 2004;112:1016–25.
- Greenland S. Principles of multilevel modelling. Int J Epidemiol 2000;29:158–67.
- Beale L, Abellan JJ, Hodgson S, Jarup L. Methodologic issues and approaches to spatial epidemiology. Environ Health Perspect 2008;116:1105–10.
- R Core Team. 2014 R: A language and environment for statistical computing. R Foundation for Statistical Computing, Vienna, Austria. URL http://www.R-project.org/
- Maja Pohar Perme. 2013 relsurv: Relative survival. R package version 2.0-4. http://CRAN.R-project.org/package=relsurv
- Sarfati D, Blakely T, Pearce N. Measuring cancer survival in populations: relative survival vs cancer-specific survival. Int J Epidemiol 2010;39:598–610.
- Baade PD, Fritschi L, Eakin EG. Non-cancer mortality among people diagnosed with cancer (Australia). Cancer Causes Control 2006;17:287–97.
- Pollitt RA, Clarke CA, Shema SJ, Swetter SM. California Medicaid enrollment and melanoma stage at diagnosis: A population-based study. Am J Prev Med 2008;35:7–13.
- Youl PH, Baade PD, Parekh S, English D, Elwood M, Aitken JF. Association between melanoma thickness, clinical skin examination and socioeconomic status: Results of a large population-based study. Int J Cancer 2011;128:2158–65.
- Baumert J, Plewig G, Volkenandt M, Schmid-Wendtner MH. Factors associated with a high tumour thickness in patients with melanoma. Br J Dermatol 2007;156:938–44.
- Eriksson H, Lyth J, Månsson-Brahme E, Frohm-Nilsson M, Ingvar C, Lindholm C, et al. Later stage at diagnosis and worse survival in cutaneous malignant melanoma among men living alone: a nationwide population-based study from Sweden. J Clin Oncol 2014;32:1356–64.