
Abstract
Background Adaptive radiotherapy is introduced in the management of urinary bladder cancer to account for day-to-day anatomical changes. The purpose of this study was to determine whether an adaptive plan selection strategy using either the first four cone beam computed tomography scans (CBCT-based strategy) for plan creation, or the interpolation of bladder volumes on pretreatment CT scans (CT-based strategy), is better in terms of tumor control probability (TCP) and normal tissue sparing while taking the clinically applied fractionation schedules also into account. Material and methods With the CT-based strategy, a library of five plans was created. Patients received 55 Gy to the bladder tumor and 40 Gy to the non-involved bladder and lymph nodes, in 20 fractions. With the CBCT-based strategy, a library of three plans was created, and patients received 70 Gy to the tumor, 60 Gy to the bladder and 48 Gy to the lymph nodes, in 30–35 fractions. Ten patients were analyzed for each adaptive plan selection strategy. TCP was calculated applying the clinically used fractionation schedules, as well as a rescaling of the dose from 55 to 70 Gy for the CT-based strategy. For rectum and bowel, equivalent doses in 2 Gy fractions (EQD2) were calculated. Results The CBCT-based strategy resulted in a median TCP of 75%, compared to 49% for the CT-based strategy, the latter improving to 72% upon rescaling the dose to 70 Gy. A median rectum V30Gy (EQD2) of 26% [interquartile range (IQR): 8–52%] was found for the CT-based strategy, compared to 58% (IQR: 55–73%) for the CBCT-based strategy. Also the bowel doses were lower with the CT-based strategy. Conclusions Whereas the higher total bladder TCP for the CBCT-based strategy is due to prescription differences, the adaptive strategy based on CT scans results in the lowest rectum and bowel cavity doses.
External beam radiotherapy provides an effective organ preserving treatment option for muscle-invasive bladder cancer [Citation1]. However, due to substantial interfractional changes in bladder shape and size, large margins are required to ensure target coverage throughout the course of radiotherapy. These result in a higher dose to the normal tissue, which in turn leads to bowel and rectum morbidity [Citation2]. Recently, it has been shown that adaptive radiotherapy (ART) may reduce normal tissue dose by selecting an optimal plan from a patient-specific plan library, according to daily patient anatomy [Citation3–7]. Several plan selection strategies have been proposed, all of which are based on creating multiple treatment plans prior to or during treatment, by imaging multiple anatomical variations [Citation3–7]. For every treatment fraction, the plan best fitting the daily bladder volume as assessed on cone beam computed tomography (CBCT) is selected.
In general, two ART strategies are currently applied to obtain target volumes for the multiple plans: using multiple planning CT scans [Citation3–5], or using the CBCT scans acquired during the first week of treatment [Citation5–7]. Currently, no consensus exists regarding the best adaptive strategy. Furthermore, two groups of fractionation schedules are commonly used for bladder cancer: a conventional schedule of 60–64 Gy in 30–32 fractions, or a moderate hypofractionation schedule with 50–57.5 Gy delivered in 20 fractions. Each fractionation schedule is inherently associated with a different adaptive strategy, due to differences between the strategies. Any comparison of these strategies therefore necessarily includes a comparison between fractionation schedules as well. Radiotherapy dose response models, i.e. so-called biological models, provide estimates of clinical outcomes and therefore enable comparison between different fractionation schedules and treatment strategies. This may be performed by calculating the tumor control probability (TCP) [Citation8] or recalculating the delivered dose to a biological equivalent dose to obtain comparable dose-volume parameters [Citation9].
The aim of this study was therefore to compare two ART strategies that represent the currently used main approaches to adaptive plan selection for bladder cancer: a CT- and CBCT-based strategy, along with their clinically used fractionation schedules, in terms of TCP and normal tissue sparing. Additionally, the influence of fractionation on the resulting TCP for bladder cancer was investigated.
Material and methods
Patient and image data
Ten patients treated for muscle-invasive bladder cancer from each of the two participating institutes [Academic Medical Center (AMC), Amsterdam, the Netherlands, and Aarhus University Hospital (AUH), Aarhus, Denmark] were used in this study. Patient and treatment characteristics are detailed in Supplementary Table 1 (available online at http://www.informahealthcare.com). All patients had cystoscopically placed fiducial markers [Citation10,Citation11]. Ten consecutive patients were selected from the AMC, who were treated between 2013 and 2014, with plan selection ART based on the CT-based strategy. For each of these patients, two planning CT scans and 20 CBCT scans were available. For the CBCT-based strategy, we selected 10 patients from the AUH, previously included in a feasibility study on fiducial marker based image-guided radiotherapy [Citation11]. These patients were treated between 2008 and 2013 with a non-adaptive treatment strategy. The adaptive strategy for the present study was simulated using the two planning CT scans and 35 CBCT scans that were available per patient. For both strategies, patients were selected based on the presence of at least one cystoscopically placed fiducial marker around the tumor, and availability of two planning CT scans and all daily CBCT scans. As both strategies were designed to deliver a boost to a solitary tumor, patients with multiple tumors or carcinoma in situ were excluded. Patients with two metal hip replacements were excluded as well, as for these patients a different method of planning was used.
Plan selection strategies and fractionation
A schematic representation of the two plan selection strategies is shown in . Simulating the CT-based strategy, patients were treated with a full bladder and received 40 Gy to the bladder and lymph nodes, and an additional 15 Gy tumor boost. In addition, for the adaptive strategy two planning CT scans were acquired [Citation3]. The first CT scan was acquired with a full bladder, after which the patient voided, and a second CT scan was acquired immediately afterwards. These planning CT scans were used to generate the additional contours (using Erasmus RTStudio, part of Erasmus MatterhornRT, software platform for radiotherapy research and advanced treatment) [Citation12], resulting in five target volumes for the plan selection library (). This is in contrast to simulation of the CBCT-based strategy, in which the first 5 fractions were used to deliver the separate sequential boost to the tumor. The CBCT scans acquired during the first 4 fractions could then be used to generate the contours needed to create the adaptive plans [Citation6] (), which were used from the second week onwards. Patients were treated with an empty bladder for all fractions, and received 48 Gy to the lymph nodes, 60 Gy to the bladder and an additional 10 Gy tumor boost dose. Both strategies have been described in further detail previously [Citation3,Citation6,Citation11]; the CBCT-strategy was a combination of the strategy as described by Vestergaard et al. [Citation6], and an unpublished dose escalation study.
![Figure 1. Schematic representation for the two adaptive strategies. The left panel shows the CBCT-based strategy [Citation6] and the right panel shows the CT-based strategy [Citation3]. Margins to create the PTV volumes from the library of structures are listed in Table 1.](/cms/asset/8e5be12b-6729-410f-89ef-eb21b33f41ac/ionc_a_1151548_f0001_b.jpg)
Treatment planning
For both strategies, a planning target volume (PTV)elective and a PTVboost were generated, with different dose prescriptions. The PTVelective was split into a high- and low-risk PTVelective, consisting of the bladder and the lymph nodes, respectively. shows the different margins applied to the contours that were created for each strategy. In addition to the PTVs, the rectum and bowel cavity were delineated for both strategies on the planning CT scan according to RTOG delineation guidelines [Citation13]. For each set of PTVs, a dual arc volumetric modulated arc therapy (VMAT) plan was created, with standard planning objectives to aim for homogenous doses to the PTVs, while keeping dose to the organs at risk (OARs) as low as possible. Treatment constraints for the OARs can be found in Supplementary Table 2 (available online at http://www.informahealthcare.com). For the CT-based strategy, plans were created using the treatment planning system Oncentra v.4.3 (Elekta AB, Stockholm, Sweden), whereas the CBCT-based strategy plans were generated using Eclipse v.11 (Varian Medical Systems, Palo Alto, CA, USA).
Table 1. Margins to create PTVboost and PTVelective from bladder, lymph node and GTV delineations.
Simulation of adaptive plan selection
The best fitting plan was selected using the daily acquired CBCT for both strategies, which was matched to the planning CT based on bony anatomy. For the CT-based strategy, prior to treatment the smallest PTVelective still encompassing the entire bladder was selected. Minor adaptations (<7 mm) to the bony anatomy match were allowed to ensure coverage of the tumor markers on CBCT by the PTVboost. For the CBCT strategy, the created bladder target volumes were used for plan selection purposes (Bladdersmall, Bladdermedium and Bladderlarge, see ). Plan selection was simulated for each CBCT by selecting the smallest bladder target volume still encompassing the bladder.
Dose summation
All CT scans with corresponding structure sets, plans and dose files, along with all CBCT scans, were imported into MIM Maestro v.6.4.4 (MIM Software Inc., Cleveland, OH, USA). On each daily CBCT scan the bladder was delineated. To evaluate the total dose to the gross tumor volume (GTV), bladder, bowel cavity and rectum, three different summed dose distributions were calculated as follows (later referred to as dose distributions A, B and C, respectively):
| A. | GTV: As the tumor was not visible on CBCT, and the boost dose was delivered using a match on tumor markers, it was assumed that the tumor received the planned dose. For the CBCT-based strategy, the planned dose was calculated by summating the dose distribution of the five boost fractions, with the dose distribution of the large backup plan. For the CT-based strategy, the dose distribution for the full bladder plan (100% plan) was chosen, as analysis was performed on the full bladder CT scan. | ||||
| B. | Non-involved bladder: For each day, the dose distribution corresponding to the chosen plan was scaled to a single fraction and translated to the frame of reference of the daily CBCT, using the clinically used daily rigid registration between the planning CT and CBCT scan. A deformable registration was then performed between the CBCT and CT to account for bladder deformations, using the bladder delineations available from the planning CT. This registration was performed using the contour-based deformable registration option in MIM. Comparing each deformed bladder with the respective bladder from the planning CT, resulted in a median Dice similarity index of 0.91 [interquartile range (IQR): 0.89–0.94]. Subsequently, this registration was applied to the dose distribution, thereby transferring the deformed dose to the CT. Finally, all daily dose distributions were accumulated in the CT frame of reference. The dose was evaluated in the non-involved bladder wall; this structure was created by subtracting the GTV from a 3 mm thick bladder wall. | ||||
| C. | Rectum and bowel cavity: Deformation algorithms do not perform sufficiently for the rectum and the bowel cavity [Citation14]. Consequently, accumulation of un-deformed doses may be more accurate than summation based on deformation. Therefore, for both strategies, dose distributions for all plans were summed on the planning CT scan, taking into account the number of times each plan was selected for the individual patients. Couch shifts with respect to the bony anatomy registration were also taken into account, by translating the isocenter of the dose distribution when required. The dose was assessed on the bowel cavity and rectum delineations on the planning CT. | ||||
Tumor control probability
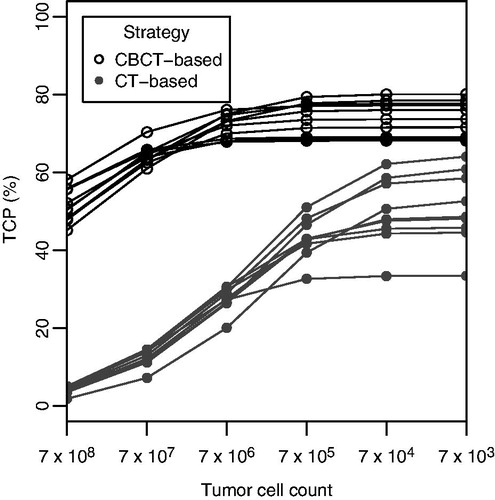
The TCP was calculated according to the method presented by Wright et al. [Citation8]. In short, this method assumed a fixed clonogenic cell density in the tumor, i.e. 107 cells/cm3, and simulated a varying cell density in the non-involved bladder wall, i.e. 103–107 cells/cm3, to account for microscopic tumor spread. To account for variations in radiosensitivity between patients, the linear radiosensitivity parameter α was assumed to be normally distributed with a mean of 0.29 Gy−1, and a standard deviation of 0.08 Gy−1. An α/β ratio of 13 Gy was chosen [Citation8]. TCP was calculated for the GTV and for the non-involved bladder wall separately, as well as a combined TCP, using the equations and parameters of the Linear-Quadratic model described by Wright et al. [Citation8] (Supplementary Table 3, available online at http://www.informahealthcare.com). The bladder wall itself was not always well defined on CBCT, and therefore a fixed bladder wall thickness of 3 mm was assumed when creating each non-involved bladder wall structure on CBCT. As the CT-based strategy is designed to treat patients with a full bladder, the volume of the bladder wall was generally larger for the CT-based strategy compared to the CBCT-based strategy. For a given tumor cell density, this would result in an unequal number of tumor cells for both strategies, leading to an unfair comparison in terms of TCP. Therefore, the method of Wright et al. was adapted slightly: instead of varying the cell density (from 103 to 107 cells/cm3), the total number of tumor cells in the bladder wall was varied (from 7 × 10⁴ to 7 × 10⁸ cells). In this way, for a typical bladder wall volume of 70 cm3, the same cell density range is covered. For the TCP calculation, dose distributions A and B were used for GTV and non-involved bladder wall, respectively. To investigate the effect of the different dose prescriptions on the TCP, the CT-based strategy dose was scaled to 70 Gy in 35 fractions, and TCP for the GTV was recalculated.
Normal tissue sparing
Normal tissue complication probability (NTCP) models may be beneficial for comparison of normal tissue sparing between several radiation treatment strategies [Citation9]. However, NTCP models for bowel, bladder and rectum toxicity are either not very well established, or only apply to complications that occur at higher OAR doses than are present in bladder radiotherapy [Citation9,Citation15,Citation16]. The use of dose-volume histograms (DVH) parameters is a better established method concerning normal tissue constraints, and these parameters can be compared when they are based on equivalent dose in 2 Gy fractions (EQD2). We therefore calculated the EQD2 for each voxel of the dose distribution, using MIM. For bowel cavity and rectum, dose distribution C was used, and α/β values of 8 and 5 Gy [Citation17] were chosen, respectively. For the non-involved bladder wall, an α/β value of 5 Gy was chosen [Citation17] and dose distribution B was used. DVHs were calculated using the EQD2 distributions. From this, the V45Gy for bowel cavity was extracted, i.e. the bowel volume receiving at least 45 Gy. In addition, the V30Gy for the rectum and D99% for the non-involved bladder wall, i.e. the dose delivered to at least 99% of the volume, were extracted.
To further understand the normal tissue sparing potential of both adaptive strategies, the average volume of the PTVelective over the course of treatment was compared to a single, non-adaptive PTVelective. For the CT-based strategy, this non-adaptive PTVelective consisted of the full bladder and lymph node delineations with 13 mm margin ventrally and cranially to the bladder, and 7 mm margin in all other directions. This is comparable to the non-adaptive bladder treatment at the AMC before implementation of ART [Citation3]. For the CBCT-based strategy, the non-adaptive PTVelective was similar to the PTVelective from the large plan. To calculate the average volume of PTVelective over the course of treatment, later referred to as the course-averaged PTVelective, all daily PTVelective volumes were summated and divided by the number of days. This was subtracted from the non-adaptive PTVelective, to compensate for inherent volume differences based on the full or empty bladder protocol.
Statistical analysis
Differences between both strategies were tested using the Mann-Whitney U-test for the following parameters: median TCP for the GTV, V45Gy for bowel cavity, V30Gy for the rectum, D99% for the non-involved bladder wall, and difference in PTVelective. A p-value <0.05 was considered significant. Statistical analysis was performed using R v.3.1.0 (The R Foundation for Statistical Computing, Vienna, Austria).
Results
The median TCP for GTV alone was 49% for patients treated with the CT-based strategy, and 75% for the CBCT-based strategy (p < 0.01). The combined TCP was higher for all patients treated with the CBCT-based strategy compared to the CT-based strategy, regardless of the number of tumor cells in the bladder wall (). With lower density of tumor cells in the non-involved bladder wall, the difference in TCP between both strategies decreased, but remained in favor of the CBCT-based strategy. Scaling the dose from the CT-based strategy to 70 Gy to the tumor in 35 fractions, increased the median TCP for the GTV alone to 72% (rescaled DVHs are depicted in Supplementary Figure 1, available online at http://www.informahealthcare.com).
Figure 2. TCP for a varying tumor cell count in the bladder wall, for both strategies, for all patients. For a low tumor cell count in the bladder wall, the TCP approaches the TCP predicted for the GTV alone.
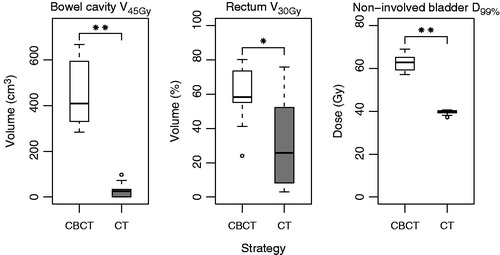
Using the EQD2 distributions, the median bowel cavity V45Gy was 26 cm3 (IQR: 0–34 cm3) for the CT-based strategy compared to 409 cm3 (IQR: 330–593 cm3) for the CBCT-based strategy (). For rectum, a median V30Gy of 26% (IQR: 8–52%) was found for the CT-based strategy, as opposed to 58% (IQR: 55–73%) for the CBCT-based strategy. For the non-involved bladder wall, the median D99% for the CT and CBCT strategies were 39.9 Gy (IQR: 39.3–40.3 Gy) and 62.8 Gy (IQR: 59.3–65.1 Gy), respectively. All differences were statistically significant.
Figure 3. Dose and irradiated volume for the OARs, for both strategies. Significant differences are indicated with an asterisk: * p < 0.05, ** p < 0.01. Parameters were obtained from 2 Gy equivalent dose distributions.
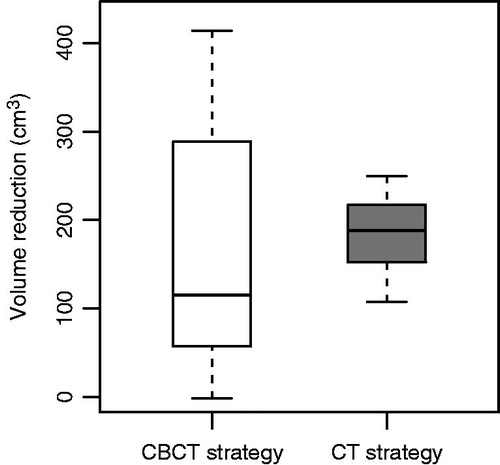
Both strategies showed a decrease in the average volume of PTVelective (). The CT-based strategy resulted in the largest median PTVelective reduction, however, the difference between the strategies was not significant. For the CT-based strategy, sparing was always present, as opposed to the CBCT-based strategy. This is caused by the fact that the CT-based strategy resulted in PTVelective volumes that, on average, matched the daily bladder volumes better compared to the CBCT-based strategy (further elucidated in Supplementary Figure 2, available online at http://www.informahealthcare.com). However, sparing for the CT-based strategy was not always as large as for the CBCT-based strategy, due to the smaller PTV margins for the latter.
Figure 4. Volume of PTVelective for the non-adaptive strategy, minus the course-averaged volume of PTVelective for either adaptive strategy, representing the reduction in irradiated volume.
Discussion
Previous treatment planning studies have compared different techniques to create PTVs in adaptive plan selection radiotherapy [Citation5,Citation18]. This study is the first to compare two clinically implemented ART strategies for bladder cancer directly, using both TCP modeling and calculation of normal tissue parameters from EQD2 distributions. We found a higher total bladder TCP for the CBCT-based strategy compared to the CT-based strategy, as opposed to a lower dose to the OARs for the CT-based strategy. The different fractionation schedules have a strong influence on the TCP, as a rescaling of doses resulted in similar TCP values.
The separate adaptive strategies would be easier to compare directly if the same dose prescriptions were used for the different PTVs. Using the AUH dose schedule (70 Gy to the tumor, 60 Gy to the bladder, and 48 Gy to the lymph nodes, in 35 fractions) for the CT-based strategy patients is not possible, as only 20 CBCT scans were available for these patients whereas 35 were required. Furthermore, for delivery of a high dose of 60 Gy to the bladder, the treatment volume should be as small as possible. Therefore an empty bladder protocol is required. Using the AMC dose schedule (55 Gy to the tumor, 40 Gy to the bladder and lymph nodes in 20 fractions) entails that the boost dose is delivered simultaneously and consists of a fraction dose of 2.75 Gy. Sparing the non-involved bladder from this higher fraction dose is beneficial in terms of bladder morbidity [Citation19], and is only possible using a full bladder approach [Citation3]. Furthermore, when only 20 fractions are delivered, the effect of ART diminishes when the first 5 fractions are needed for adaptive plan generation. Therefore, it was chosen to use the clinically applied dose schedules, as these are inherently connected to the adaptive strategies.
For both strategies, it has been proven previously that clinical target volume (CTV) coverage is at least comparable to a non-adaptive approach [Citation3,Citation18]. However, the differences between both strategies in terms of TCP were large. Median TCP for the GTV alone was 26% higher for the CBCT-based strategy, and also total bladder TCP was higher, independent of tumor cell count in the bladder wall. However, when the dose from the CT-based strategy was scaled to 70 Gy to the tumor in 35 fractions, the median TCP for the GTV alone increased to 72%, which is comparable to the median TCP of 75% of the CBCT-based strategy. The remaining difference could be caused by the fact that on average, the GTV volumes for the patients in the CT-based strategy are larger compared to the patients treated with the CBCT strategy (Supplementary Table 1). In addition, two studies with fractionation schedules and dose prescriptions similar to what was used in the current study, apart from the additional boost in the CBCT-based strategy, report 3-year local control rates of 55% and 64% [Citation20,Citation21], for the CT- and CBCT-based strategy, respectively. This difference is not as large as the difference in TCP found in the present study (49% vs. 75%), which can be explained by the additional boost delivered for the CBCT-based strategy. In addition, the used TCP model as described by Wright et al. does not take into account repopulation. Repopulation is expected to have an effect on the TCP when the overall treatment time is changed. As both schedules have a different overall treatment time, omitting repopulation in the TCP model could have a beneficial effect on the TCP for the CBCT-based strategy. Hence, taking into account that TCP models are subject to uncertainties in the parameters, it can be concluded that the previously mentioned local control rates are in agreement with the TCP values we found. We therefore suggest that differences in TCP are caused by a difference in dose prescription, and were not influenced by the choice of adaptive strategy.
The observed differences in DVH parameters for bowel cavity, rectum and non-involved bladder depend partially on the dose prescription, as a higher prescribed dose to the target will inherently also result in a higher dose to the OARs. Muren et al. have shown that the NTCP predictions for small bowel and rectum are equally low for both schedules, independent of the dose prescriptions [Citation22]. shows that for the CT-based strategy, the PTVelective is always smaller compared to a non-adaptive approach. As the interpolation and extrapolation between a full and empty bladder captures almost all volume and shape changes of the bladder, a backup plan with large population based margins is not required. This is in contrast to the CBCT-based strategy, for which the large backup plan has to be selected for a larger bladder or shape changes. When the backup plan is selected often, sparing compared to a non-adaptive approach is limited, which is seen in approximately 50% of patients (). This is likely the cause for the large difference seen in rectal V30Gy and bowel cavity V45Gy between both strategies.
To minimize the risk of acute small bowel toxicity ≥ grade 2, the V45Gy for bowel cavity should be limited to 195 cm3 [Citation23]. While this constraint is satisfied for all patients planned with the CT-based strategy, it is not achieved in any of the patients planned with the CBCT-based strategy. For rectal toxicity, DVH constraints are usually for dose values >50 Gy [Citation24]. The V50Gy should be smaller than 50%, which was the case for all patients from both strategies. For more differentiation, we therefore evaluated the V30Gy, which is reported to be mildly associated with overall rectal toxicity [Citation25]. Moderate to severe toxicity is unlikely for a V30Gy <60%, which was the case for eight patients treated with the CT-based strategy, and six patients treated with the CBCT-based strategy. For either strategy, extensive rectal toxicity is not expected.
Maximum doses to the bladder of 65 Gy have been proposed to minimize focal injury [Citation19], as well as mean total bladder doses of 50–60 Gy to minimize global injury [Citation19]. Due to the different dose prescriptions, the risk for both global and focal injury is higher for the CBCT-based strategy, which is reflected in morbidity data from literature. Bladder morbidity grade ≥2 for prescriptions similar to the CT and CBCT strategies was reported in 13% and 63% of patients, respectively [Citation20,Citation26].
Dose summation for the bladder wall was performed by employing a deformable registration between each CBCT scan and the planning CT scan. Depending on the anatomical accuracy of this registration, the voxel-based summation of dose will closely match the actually delivered dose [Citation14]. For bladder, it has been evaluated that a structure-based algorithm is sufficient for dose accumulation [Citation27]. This has not been established for rectum and bowel cavity yet. In addition, intensity-based deformation algorithms are currently not accurate enough for dose accumulation purposes [Citation14,Citation27].
When implementing an adaptive plan selection strategy, workflow and possibilities at the clinical department are of great importance [Citation28]. The CT-based strategy requires dedicated software for the interpolation of bladder and GTV contours, which is not widely available. However, the CBCT-based strategy requires a major adaptation of the workflow, due to the additional planning after start of treatment. In case of a hypofractionated schedule with a simultaneously integrated boost, the benefit of the CBCT-based adaptive strategy might be limited as the plan selection phase will not start before fraction 6.
In conclusion, for an adaptive plan selection strategy based on interpolation of bladder volumes on CT, we found a lower rectum V30Gy and bowel cavity V45Gy, compared to a strategy based on the use of the first four CBCTs for plan creation. Differences in dose prescription and fractionation resulted in a higher TCP and bladder D99% for the CBCT-based strategy. The actual choice of adaptive strategy will depend on the preferred dose prescription and workflow, as well as software availability.
Supplementary_material.pdf
Download PDF (337.6 KB)Acknowledgments
The authors would like to thank Dr. M. Hoogeman (Erasmus MC, Rotterdam) for making available Erasmus RTStudio, an application of the Erasmus MatterhornRT Software Development Platform.
Disclosure statement
Lotte Lutkenhaus is assigned on an Elekta sponsored project regarding adaptive radiotherapy. Arjan Bel is project leader of several Elekta sponsored projects. Elekta had no involvement in study design, data collection and analysis.
Related Research Data
References
- Efstathiou J, Spiegel DY, Shipley WU, Heney NM, Kaufman DS, Niemierko A, et al. Long-term outcomes of selective bladder preservation by combined-modality therapy for invasive bladder cancer: The MGH experience. Eur Urol 2012;61:705–11.
- Fokdal L, Høyer M, Meldgaard P, Von Der Maase H. Long-term bladder, colorectal, and sexual functions after radical radiotherapy for urinary bladder cancer. Radiother Oncol 2004;72:139–45.
- Lutkenhaus LJ, Visser J, de Jong R, Hulshof MCCM, Bel A. Evaluation of delivered dose for a clinical daily adaptive plan selection strategy for bladder cancer radiotherapy. Radiother Oncol 2015;116:51–6.
- Tuomikoski L, Collan J, Keyriläinen J, Visapää H, Saarilahti K, Tenhunen M. Adaptive radiotherapy in muscle invasive urinary bladder cancer–an effective method to reduce the irradiated bowel volume. Radiother Oncol 2011;99:61–6.
- Webster GJ, Stratford J, Rodgers J, Livsey JE, Macintosh D, Choudhury A. Comparison of adaptive radiotherapy techniques for the treatment of bladder cancer. Br J Radiol 2013;86:20120433
- Vestergaard A, Muren LP, Lindberg H, Jakobsen KL, Petersen JBB, Elstrøm UV, et al. Normal tissue sparing in a phase II trial on daily adaptive plan selection in radiotherapy for urinary bladder cancer. Acta Oncol 2014;53:997–1004.
- Foroudi F, Wong J, Kron T, Rolfo A, Haworth A, Roxby P, et al. Online adaptive radiotherapy for muscle-invasive bladder cancer: Results of a pilot study. Int J Radiat Oncol Biol Phys 2011;81:765–71.
- Wright P, Muren LP, Høyer M, Malinen E. Evaluation of adaptive radiotherapy of bladder cancer by image-based tumour control probability modelling. Acta Oncol 2010;49:1045–51.
- Muren LP, Jebsen N, Gustafsson A, Dahl O. Can dose-response models predict reliable normal tissue complication probabilities in radical radiotherapy of urinary bladder cancer? The impact of alternative radiation tolerance models and parameters. Int J Radiat Oncol Biol Phys 2001;50:627–37.
- Pos F, Bex A, Dees-Ribbers HM, Betgen A, van Herk M, Remeijer P. Lipiodol injection for target volume delineation and image guidance during radiotherapy for bladder cancer. Radiother Oncol 2009;93:364–7.
- Søndergaard J, Olsen KØ, Muren LP, Elstrøm UV, Grau C, Høyer M. A study of image-guided radiotherapy of bladder cancer based on lipiodol injection in the bladder wall. Acta Oncol 2010;49:1109–15.
- Wognum S, Bondar L, Zolnay aG, Chai X, Hulshof MCCM, Hoogeman MS, et al. Control over structure-specific flexibility improves anatomical accuracy for point-based deformable registration in bladder cancer radiotherapy. Med Phys 2013;40:021702
- Gay HA, Barthold HJ, Meara EO, Bosch WR, Sc D, Naqa IE, et al. Pelvic Normal Tissue Contouring Guidelines for Radiation Therapy: A Radiation Therapy Oncology Group Consensus Panel Atlas. Radiat Oncol Biol 2012;83:e353–62.
- Thor M, Bentzen L, Elstrøm UV, Petersen JBB, Muren LP. Dose/volume-based evaluation of the accuracy of deformable image registration for the rectum and bladder. Acta Oncol 2013;52:1411–16.
- Gulliford SL, Partridge M, Sydes MR, Webb S, Evans PM, Dearnaley DP. Parameters for the Lyman Kutcher Burman (LKB) model of normal tissue complication probability (NTCP) for specific rectal complications observed in clinical practise. Radiother Oncol 2012;102:347–51.
- Kvinnsland Y, Muren LP. The impact of organ motion on intestine doses and complication probabilities in radiotherapy of bladder cancer. Radiother Oncol 2005;76:43–7.
- Dörr W. Pathogenesis of normal-tissue side-effects. In: Joiner M, Van der Kogel A (eds). Basic Clin Radiobiol Fourth Edition,: Boca Raton: CRC Press, 2009:169–90.
- Vestergaard A, Søndergaard J, Petersen JB, Høyer M, Muren LP. A comparison of three different adaptive strategies in image-guided radiotherapy of bladder cancer. Acta Oncol 2010;49:1069–76.
- Marks LB, Carroll PR, Dugan TC, Anscher MS. The response of the urinary bladder, urethra, and ureter to radiation and chemotherapy. Int J Radiat Oncol Biol Phys 1995;31:1257–80.
- Pos FJ, van Tienhoven G, Hulshof MCC, Koedooder K, González González D. Concomitant boost radiotherapy for muscle invasive bladder cancer. Radiother Oncol 2003;68:75–80.
- Yavuz AA, Yavuz MN, Ozgur GK, Colak F, Ozyavuz R, Cimsitoglu E, et al. Accelerated superfractionated radiotherapy with concomitant boost for invasive bladder cancer. Int J Radiat Oncol Biol Phys 2003;56:734–45.
- Muren LP, Redpath AT, McLaren DB. Treatment margins and treatment fractionation in conformal radiotherapy of muscle-invading urinary bladder cancer. Radiother Oncol 2004;71:65–71.
- Kavanagh BD, Pan CC, Dawson La, Das SK, Li XA, Ten Haken RK, et al. Radiation dose-volume effects in the stomach and small bowel. Int J Radiat Oncol Biol Phys 2010;76:101–7.
- Marks LB, Yorke ED, Jackson A, Ten Haken RK, Constine LS, Eisbruch A, et al. Use of normal tissue complication probability models in the clinic. Int J Radiat Oncol Biol Phys 2010;76:S10–19.
- Stenmark MH, Conlon ASC, Johnson S, Daignault S, Litzenberg D, Marsh R, et al. Dose to the inferior rectum is strongly associated with patient reported bowel quality of life after radiation therapy for prostate cancer. Radiother Oncol 2014;110:291–7.
- Søndergaard J, Holmberg M, Jakobsen AR, Agerbæk M, Muren LP, Høyer M. A comparison of morbidity following conformal versus intensity-modulated radiotherapy for urinary bladder cancer. Acta Oncol 2014;53:1321–28.
- Wognum S, Heethuis SE, Rosario T, Hoogeman MS, Bel a. Validation of deformable image registration algorithms on CT images of ex vivo porcine bladders with fiducial markers. Med Phys 2014;41:071916
- Boejen A, Vestergaard A, Hoffmann L, Ellegaard M, Rasmussen A-M, Møller D, et al. A learning programme qualifying radiation therapists to manage daily online adaptive radiotherapy. Acta Oncol 2015;54:1697–1701.