
Abstract
Everolimus has been used widely in cancer patients and is associated with the development of hyperglycemia. Due to confounding factors, its specific impact on hyperglycemia has not been well understood. We performed a meta-analysis of randomized controlled trials to determine the risk of hyperglycemia attributable to everolimus in cancer patients of varying tumor types.
Material and methods: PubMed and American Society of Clinical Oncology conference abstracts up to June 2015 were systematically searched. Eligible studies included randomized controlled trials (RCTs) in which everolimus was compared to placebo in cancer patients with or without other agents. Heterogeneity tests were performed to examine between-study differences in hyperglycemia, and the incidence and relative risk of all- and high-grade hyperglycemia attributable to everolimus were determined using both random- or fixed-effects models.
Results: A total of seven phase III and two phase II RCTs with various tumors, encompassing a total of 3879 cancer patients, were included in our analysis. Everolimus significantly increased the risk of all-grade (RR =2.60, 95% CI 2.03–3.31, p < 0.001) and high-grade (RR =3.0, 95% CI 1.72–5.23; p < 0.001) hyperglycemia. The incidences of all- and high-grade hyperglycemia attributable to everolimus were 6.8% (95% CI 3.4–13.2%) and 2.5% (95% CI 1.2–4.9%), respectively. The everolimus-specific risk of all-grade hyperglycemia varied significantly with tumor types (p < 0.001), with the highest incidence seen in renal cell carcinoma (RCC) (27.2%, 95% CI 22.2–32.8%) and the lowest in breast cancer (3.3%, 95% CI 1.3–8.2%). No significant variation was found between everolimus alone or everolimus in combination with other agents. Similar results were also found for the risk of high-grade hyperglycemia attributable to everolimus.
Conclusion: The specific risk of hyperglycemia attributable to everolimus may vary significantly with tumor types. Close monitoring should be given to patients at high risk, such as RCC.
Everolimus is an orally administered rapamycin analog that has been approved by the Food and Drug Administration for the treatment of a number of cancers, ranging from renal cell carcinoma (RCC) and subependymal giant cell astrocytoma to hormone-receptor-positive advanced breast cancer (BC) and pancreatic neuroendocrine tumors [Citation1]. Everolimus was found to contribute to increased progression-free survival in RCC (4.0 vs. 1.9 months) [Citation2], carcinoid syndrome neuroendocrine tumors (16.4 vs. 11.3 months) [Citation3], pancreatic neuroendocrine tumors (11.0 vs. 4.6 months) [Citation4], HER2-positive BC (7.0 vs. 5.78 months) [Citation5], and hormone-receptor-positive advanced BC (6.9 vs. 2.8 months) [Citation6].
While it is relatively well tolerated, everolimus is associated with several adverse events including anemia, stomatitis, infection, pneumonitis, and hyperglycemia. Of particular interest is the link between everolimus and hyperglycemia. Despite the prolonged progression-free survival conferred by everolimus, a considerable number of cancer patients receiving the drug experience hyperglycemia, one of the most important comorbidities affecting the cancer patient population. The association of everolimus with hyperglycemia is especially concerning because glucose is considered a potentially important driving force in cancer progression [Citation7,Citation8]. A number of recent studies have found that high glucose levels contribute to the proliferation of tumor cell lines corresponding to colon, colorectal, breast, prostate, and bladder cancers [Citation8,Citation9]. Particularly when hyperglycemia is severe, the toxicity of high glucose levels in the blood increases the risk of a myriad of both macrovascular and microvascular diseases, ranging from cardiovascular, cerebrovascular, and arterial pathologies to retinopathy, neuropathy, and nephropathy, in addition to acute toxicity, such as weight loss, polyuria, and dehydration [Citation10].
Despite the dangers of hyperglycemia in cancer patients, our understanding of everolimus-induced hyperglycemia at the clinical level remains limited. While a strong relationship has been found between hyperglycemia and the usage of related mTOR inhibitors, such as sirolimus in the non-cancer patient population (e.g. transplant recipients) [Citation11], a wide variation in hyperglycemia incidence has been reported in everolimus clinical trials for cancer patients, with hyperglycemia incidence rates ranging from as low as 1–5% [Citation12,Citation13] to as high as 50% [Citation2]. Research is thus needed to examine the underlying causes of the heterogeneity observed in the everolimus-hyperglycemia association. Such a relationship could be due to many confounding factors, such as comorbidities, concurrent medications, tumor types, everolimus doses, or everolimus’ combination with other agents. In addition, most clinical studies to date have reported the overall hyperglycemia incidence rates associated with everolimus and have not examined the risk of hyperglycemia specifically attributable to the drug, thus potentially overestimating everolimus’ contribution to hyperglycemia.
In order to understand the heterogeneity of drug-associated hyperglycemia in cancer patients, we have performed a systematic review and meta-analysis of randomized controlled trials (RCTs) to determine the risk of hyperglycemia specifically attributable to everolimus. In conducting a subgroup analysis based on tumor type, everolimus dose, and everolimus therapy type (combination vs. single agent), our study has analyzed the risk factors of everolimus-specific hyperglycemia. The results of this analysis have the potential to help clinicians to identify high-risk patients and improve outcomes in patients taking mTOR inhibitors.
Material and methods
Data source
The PubMed database (www.pubmed.gov) was searched for all results up to 14 June 2015 using the key words “everolimus” or “RAD001” and “cancer”. In addition, all abstracts presented at American Society of Clinical Oncology (ASCO) conferences up to June 14, 2015 were searched using the same keywords. We reviewed all selected abstracts and publications for information on drug safety and efficacy. We consequently verified them to ensure that the versions identified were up-to-date and complete.
Study selection
We sought to include all placebo-RCTs in which hyperglycemia incidence rates were directly compared between patients who received everolimus and those who did not receive the drug. We excluded all non-RCTs, which includes preclinical studies, phase I trials, phase I–II trials, single-group phase II studies, observational studies, commentaries, review papers, meta-analyses, case studies, pilot studies, research proposals, and letters. Trials that were phase II or III prospective RCTs examining cancer patients (diagnosed with any type of cancer) receiving everolimus were included for analysis. Studies without data comparing hyperglycemia between patients who received and did not receive everolimus were excluded. All included studies had mandatory blood glucose monitoring as part of study protocol.
Even though the RCTs selected for this study used other cancer therapeutics besides everolimus, we were careful to select studies in which the everolimus and non-everolimus treatment conditions were identical with the sole exception of everolimus receipt. For example, in one selected study [Citation12], exemestrane was given to patients in addition to everolimus. As exemestrane was given to both the everolimus and non-everolimus groups (everolimus + exemestrane vs. exemestrane by itself), we did not need to worry about exemestrane’s confounding of everolimus’ treatment effects.
In order to assess study quality, we used the seven-item Jadad Scale. The Jadad Score uses a seven-item scale with scores that range from 0 to 5. Points are given for studies that specify randomization, denote the specific method of randomization, mention double-blind trial design, explain appropriateness of double blinding, and describe the study’s dropouts and withdrawals [Citation14]. Our interpretation of study quality using the Jadad score is consistent with meta-analyses in the literature [Citation15,Citation16].
Clinical end points and statistical analysis
The clinical outcome variable for this study was hyperglycemia, measured by the number of patients presenting with symptoms of both all-grade (G1–G4) and high-grade (G3–G4 only) hyperglycemia, as defined by the Common Terminology Criteria for Adverse Events (CTCAE) version 4.0 [Citation17]. Grade 1 was defined as upper limits of normal (ULN) < 160 mg/dl or 8.9 mmol/l, grade 2 as ULN 160–250 mg/dl or 8.9–13.9 mmol/l, grade 3 as ULN 250–500 mg/dl or 13.9–27.8 mmol/l, and grade 4 as ULN 500 + mg/dl or 27.8 + mmol/l or acidosis. All included studies used CTCAE version 3.0 for reporting of adverse effects, whose criteria for hyperglycemia were identical to that of CTCAE version 4.0. No differences in study protocol surrounding the monitoring of glucose were found among included studies.
Statistical analyses were performed using Comprehensive MetaAnalysis program version 2.0 (Biostat, Englewood, NJ, USA). We entered collected data into a Microsoft Excel sheet. For each study, the hyperglycemia (all- and high-grade) incidence rate was calculated. The relative risk of hyperglycemia, along with an associated 95% confidence interval (CI), was calculated.
As the RCTs selected in this meta-analyses were designed to have a control group, we also calculated risk of hyperglycemia specifically attributable to everolimus (attributable event rate = event rate with everolimus minus event rate with control). Fixed-effects (weighted with inverse variance) or random-effects models were used to examine summary results. Cochran’s Q statistic and I2 were calculated to assess the assumption of heterogeneity among the studies included in this meta-analysis. The assumption of homogeneity was considered invalid for the p-value of Cochran’s Q statistic <0.1, and consequently results from the random-effects model were reported; results from fixed-effects models were reported otherwise. Publication bias was assessed by the Begg’s test. A two-tailed p-value of <0.05 was considered statistically significant.
Results
Search results
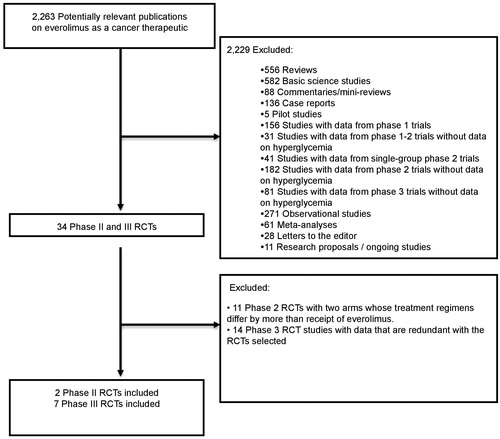
Our literature search culminated in a total of 2263 potentially relevant studies of everolimus as a cancer therapeutic (), of which 34 phase II and III RCTs were identified. Ultimately, two phase II RCTs [Citation18,Citation19] and seven phase III RCTs [Citation2–6,Citation12,Citation13] were included in our final analysis. details our criteria for exclusion.
Figure 1. Selection of randomized controlled trials (RCTs) included in the meta-analysis. RCTs: randomized controlled trials.
Based on an independent review that we conducted, six of the nine studies selected received the highest Jadad score of a 5. The Huober et al. 2013 and Baselga et al. 2012 studies received a score of 3. One study (Besse et al. 2014) received a Jadad score of a 2 because although randomized, it was an open-label study. The results of our analysis were consistent across studies of varying Jadad scores.
Patients
A total of 3879 cancer patients were available for our analysis, including 1954 (50.3%) patients who had BC, 546 (14.1%) HCC, 836 (21.6%) neuroendocrine tumors, 133 (3.4%) non-small cell lung cancer, and 410 (10.6%) RCC. In total 2223 patients (57.3%) received everolimus, while 1656 patients (42.7%) were included in the control condition.
Of those who received everolimus, 1313 patients (59.1%) received everolimus at dose 10 mg per day, 548 (24.7%) at dose 5 mg per day, and 362 (16.3%) at dose 7.50 mg per day. Of those who received everolimus, 841 patients (37.8%) received it as a single agent, and 1382 patients (62.1%) received everolimus as a combination therapy.
Relative risk of hyperglycemia
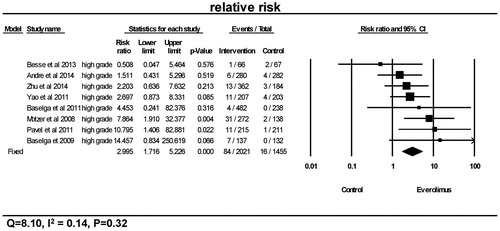
As seen in and , a total of 280 from 2223 patients receiving everolimus presented with the events of all-grade hyperglycemia, and 84 of 2021 patients receiving everolimus presented with high-grade hyperglycemia. Overall, the relative risks of hyperglycemia were significantly higher in the everolimus treatment group in comparison to the control group for both all-grade (p < 0.0001, RR =2.60, 95% CI 2.03–3.31) and high-grade (p < 0.0001, RR =3.0, 95% CI 1.72–5.23). Using a fixed-effects model, tests for heterogeneity revealed no differences among the studies with regards to the relative risks of all-grade (Q = 8.43, I2=0.05, p = 0.39) and high-grade hyperglycemia (Q = 8.10, I2=0.14, p = 0.32).
Figure 2. Relative risk of all-grade hyperglycemia. CI: confidence interval; RR: relative risk. RR of all-grade hyperglycemia was calculated using fixed-effects models. The RR and 95% CI for each trial and the final combined results are demonstrated numerically on the left and graphically as a forest plot on the right. For individual trials: filled-in square, relative risk; lines, 95% CI; diamond plot, overall results of the included trials.
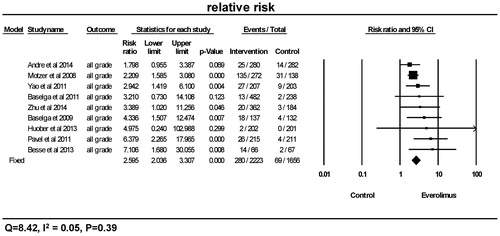
Figure 3. Relative risk of high-grade hyperglycemia. CI: confidence interval; RR: relative risk. RR of high-grade hyperglycemia was calculated using fixed-effects models. The RR and 95% CI for each trial and the final combined results are demonstrated numerically on the left and graphically as a forest plot on the right. For individual trials: filled-in square, relative risk; lines, 95% CI; diamond plot, overall results of the included trials.
Risk of all-grade hyperglycemia attributable to everolimus
In order to determine the everolimus-specific impact on hyperglycemia, we determined the absolute risk attributable to everolimus. The overall attributable risk was 6.8% (95% CI 3.4–13.2%), as seen in . Using a random-effects model, significant differences among the studies in terms of all-grade hyperglycemia were revealed by a heterogeneity test in the risk attributable to hyperglycemia (Q = 143.09, I2=0.94, p < 0.001). We further determined the underlying causes of the heterogeneity. There was significant variation among different tumor types, as shown in . While the attributable risk of hyperglycemia due to everolimus was 3.3% (95% CI 1.3–8.2%) in the BC group and 3.9% (95% CI 2.3–6.5%) in the HCC group, the risk was 9.4% (95% CI 7.0–12.6%) in the neuroendocrine tumor group, 18.2% (95% CI 10.6–29.4%) in the non-small cell lung cancer group, and 27.2% (95% CI 22.2–32.8%) in the RCC group.
Figure 4. Attributable risk of all-grade hyperglycemia. CI: confidence interval. Attributable risk of all-grade hyperglycemia was calculated using random-effects models. The attributable risk and 95% CI for each trial and the final combined results are demonstrated numerically on the left and graphically as a forest plot on the right. For individual trials: filled-in square, attributable risk; lines, 95% CI; diamond plot, overall results of the included trials.
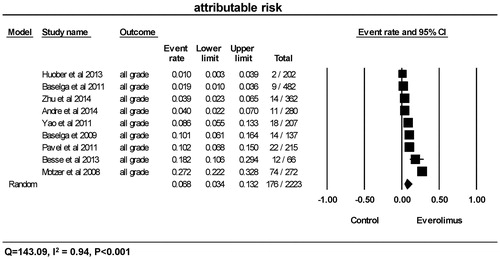
Table 1. Attributable risk of all-grade (top panel) and high-grade hyperglycemia by cancer type, dosing, and everolimus formulation.
No significant differences (p = 0.26) were found regarding the attributable risk of all-grade hyperglycemia among varying everolimus doses (5.0, 7.5, and 10 mg per day); in addition, there was no significant difference between single agent everolimus and its combination with other anti-cancer agents (p = 0.41). Tests for publication bias regarding all-grade hyperglycemia were negative (Begg’s test, two-tailed p = 0.251).
Risk of high-grade hyperglycemia attributable to everolimus
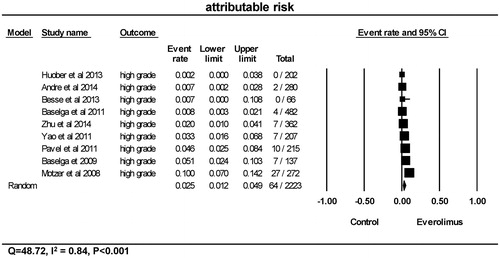
As shown in , the overall attributable risk to everolimus was 2.5% (95% CI 1.2–4.9%). Using a random-effects model, heterogeneity tests also revealed significant differences among the studies in terms of high-grade hyperglycemia (Q = 48.72, I2=0.84, p < 0.001).
Figure 5. Attributable risk of high-grade hyperglycemia. CI: confidence interval. Attributable risk of high-grade hyperglycemia was calculated using random-effects models. The attributable risk and 95% CI for each trial and the final combined results are demonstrated numerically on the left and graphically as a forest plot on the right. For individual trials: filled-in square, attributable risk; lines, 95% CI; diamond plot, overall results of the included trials.
Likewise, significant variation with tumor types was also found with regards to high-grade hyperglycemia attributable to everolimus treatment (p < 0.001), as shown in . While the attributable risk of high-grade hyperglycemia due to everolimus was 1.2% (95% CI 0.3–4.0%) in the BC group, 0.7% (95% CI <0.1%–10.8%) in the non-small cell lung cancer group, 2.0% (95% CI 1.0–4.1%) in the HCC group, and 4.0% (95% CI 2.5–6.4%) in the neuroendocrine tumor group, the risk was 10.0% (95% CI 7.0–14.2%) in the RCC group.
Significant variation with different doses was found in the risk of high-grade hyperglycemia (p = 0.02) attributable to everolimus. Suggestive of a dose-response relationship, patients with doses of 5 mg per day had a 0.6% (95% CI 0.2–1.8%) risk of high-grade hyperglycemia compared to 2.0% (95% CI 1.0–4.1%) and 5.8% (95% CI 4.4–7.4%) for the 7.5 mg per day and 10 mg per day everolimus groups, respectively.
No differences were found with regards to the attributable risk of all-grade (p = 0.41) and high-grade (p = 0.20) hyperglycemia among studies that used everolimus in combination therapy, as opposed to single agent therapy. Tests for publication bias regarding high-grade hyperglycemia were negative (Begg’s test, two-tailed p = 0.175).
Discussion
Our study has demonstrated that everolimus significantly increased the overall risk of hyperglycemia in cancer patients. We found that the risks of all- and high-grade hyperglycemia increased in the everolimus treatment group in comparison to the control group with relative risks of 2.60 (95% CI 2.03–3.31) and 3.0 (95% CI 1.72–5.23), respectively. More importantly, we have shown that the risk of hyperglycemia attributable to everolimus varied substantially by tumor types, with the highest seen in RCC and the lowest seen in BC. In particular, we observed heterogeneity in everolimus' hyperglycemic effects such that RCC patients had much higher attributable risks for both all-grade and high-grade hyperglycemia than BC, HCC, and NET patients. To our knowledge, this is the first study to illustrate tumor-dependent heterogeneity in the relationship between everolimus and hyperglycemia. This study will help us to identify cancer patients at high risk for hyperglycemia while undergoing everolimus therapy and provide a basis for close monitoring. Optimal control of high blood sugar levels will reduce the morbidity of hyperglycemia and reduce the interruption and discontinuation of everolimus use associated with high-grade hyperglycemia.
While the exact mechanism of everolimus-associated hyperglycemia in cancer patients is not clear, our study’s finding of a robust hyperglycemia-everolimus relationship is consistent with previous literature showing that the activation of the PI3K/AKT/mTOR pathway culminates in the inhibition of gluconeogenesis by insulin [Citation20]. A considerable body of research has found that mTOR signaling pathways are upregulated in cancer, contributing to a decrease in PI3K signaling via the inactivation of insulin-response sequence proteins by the mTOR target p70S6K [Citation21,Citation22]. It is likely that dysregulation of insulin signaling thus contributes to hyperglycemia upon patients’ receipt of everolimus.
Much recent progress has been made in elucidating the molecular mechanisms underlying the everolimus and hyperglycemia relationship, and numerous theories have been proposed to explain the everolimus-hyperglycemia association. On one hand, studies have found that mTOR inhibitors, such as everolimus, can suppress insulin output via AMP-activated protein kinase (AMPK)/c-Jun N-terminal kinase (JNK)/FoxO signaling [Citation23]. Another body of research has found evidence of mTOR inhibitors’ induction of peripheral insulin resistance, suggesting that long-term exposure to rapamycin may cause impairment of insulin-receptor substrate signaling [Citation24]. Finally, there has been considerable evidence indicating that mTOR inhibitors may modulate the positive feedback of insulin-stimulated insulin release [Citation25].
Our study’s discovery of heterogeneity among tumor types, culminating in higher hyperglycemia risk attributable to everolimus among patients with RCC, constitutes a novel and intriguing finding at the clinical level. While future studies should seek to clarify the role that dosing and treatment duration may play in the relationship between hyperglycemia risk and RCC, the dosing of everolimus provided to RCC patients (10 mg per day) and duration of treatment (95 days) in our study was consistent with that provided to patients who had other tumor types. It is possible that destruction to the kidney’s tubules and interstitium stemming from RCC [Citation26], may contribute to dysfunctional reabsorptive processes and concomitant hyperglycemia. In addition, while the role that the kidney plays in the excretion of everolimus is minor [Citation27], the majority of RCC patients in our study had undergone nephrectomies [Citation2], raising the possibility of impaired renal elimination of everolimus. The mechanisms underlying the unfavorable hyperglycemic outcomes seen in this study remain unclear and undoubtedly necessitate further study.
In comparison to the worsened hyperglycemic outcomes in patients with RCC, patients with BC and HCC tended to have lower risks of hyperglycemia attributable to everolimus. The finding of relatively low hyperglycemia among patients with HCC is especially consistent with the past literature that has found a loss of liver cell mass from hepatic metastasis compromising glucose production (gluconeogenesis, glycogenolysis) and ultimately leading to hypoglycemia [Citation28].
Our study’s finding of increased high-grade hyperglycemia among patients with RCC has significant implications for patients using everolimus. While there is limited research on specific interventions to treat hyperglycemia among cancer patients, patients using everolimus who experience grade 3 hyperglycemia have been advised to undergo a temporary dose interruption, while those who experience grade 4 hyperglycemia have been recommended to discontinue everolimus [Citation29]. While patients receiving everolimus who experience low-grade (grade 1 and 2) hyperglycemia may likely benefit from interventions ranging from diet adjustment, physical exercise, and medical therapies to counter high blood sugar, research is needed to elucidate the efficacy of such interventions in the cancer population.
Our study has several limitations. First, a limitation of our study is that its finding of increased hyperglycemia among patients with RCC is based on the results of one study that had relatively high statistical power in our analysis (N = 410) [Citation2], illustrating the need for more research to specifically examine the relationship between RCC and hyperglycemia. The cancer types examined were not equally represented, contributing to larger sample sizes and greater statistical power for some cancers relative to others. In addition, our meta-analysis literature search was limited to studies that had data comparing patients who received everolimus and those who did not. Consequently, a number of studies examining astrocytomas and lung cancers—which did not have hyperglycemia constitute a primary endpoint—were excluded from the study, limiting our analysis’ generalizability. In addition, because our meta-analysis provides a retrospective examination of published prospective trials that did not intend for hyperglycemia to be a primary endpoint, we were not able to examine the role that tumor staging and preexisting comorbidities that may confound the hyperglycemia-everolimus relationship; data on such preexisting comorbidities and tumor staging were not published in the original clinical trials. Future analyses should consider multivariate analyses in controlling for such mediating and confounding variables in the everolimus-hyperglycemia relationship.
In conclusion, we have demonstrated that everolimus significantly increased the risk of hyperglycemia in cancer patients. Suggestive that tumor type may be a risk factor for hyperglycemia stemming from everolimus, our study finds that the increased risk of both all- and high-grade hyperglycemia is much more evident in patients with RCC and several other tumors. It is likely that patients of certain tumor types, such as RCC, would benefit from close monitoring and management of their hyperglycemia.
Acknowledgments
SW and KYX conceptualized the study. KYX compiled the data, while SW analyzed the data. KYX wrote the manuscript’s first draft and developed the arguments for the paper together with SW and RS. KYX, SW, and RS contributed to the revision of the manuscript, agreed with interpretation of results, and approved the final version of the manuscript.
Disclosure statement
SW is a speaker for Astella-Medivation, Pfizer and Novartis. No financial support was provided for this study.
Funding
SW is supported by the Research Foundation of the State University of New York (SUNY).
References
- FDA Approval for Everolimus. 2016.
- Motzer RJ, Escudier B, Oudard S, Hutson TE, Porta C, Bracarda S, et al. Efficacy of everolimus in advanced renal cell carcinoma: a double-blind, randomised, placebo-controlled phase III trial. Lancet 2008;372:449–56.
- Pavel ME, Hainsworth JD, Baudin E, Peeters M, Horsch D, Winkler RE, et al. Everolimus plus octreotide long-acting repeatable for the treatment of advanced neuroendocrine tumours associated with carcinoid syndrome (RADIANT-2): a randomised, placebo-controlled, phase 3 study. Lancet 2011;378:2005–12.
- Yao JC, Shah MH, Ito T, Bohas CL, Wolin EM, Van Cutsem E, et al. Everolimus for advanced pancreatic neuroendocrine tumors. N Engl J Med 2011;364:514–23.
- Andre F, O'regan R, Ozguroglu M, Toi M, Xu B, Jerusalem G, et al. Everolimus for women with trastuzumab-resistant, HER2-positive, advanced breast cancer (BOLERO-3): a randomised, double-blind, placebo-controlled phase 3 trial. Lancet Oncol 2014;15:580–91.
- Baselga J, Campone M, Piccart M, Burris HA, 3rd, Rugo HS, Sahmoud T, et al. Everolimus in postmenopausal hormone-receptor-positive advanced breast cancer. N Engl J Med 2012;366:520–9.
- Beckner ME, Stracke ML, Liotta LA, Schiffmann E. Glycolysis as primary energy source in tumor cell chemotaxis. J Natl Cancer Inst 1990;82:1836–40.
- Duan W, Shen X, Lei J, Xu Q, Yu Y, Li R, et al. Hyperglycemia, a neglected factor during cancer progression. BioMed Res Int 2014;2014. doi:http://dx.doi.org/10.1155/2014/461917.
- Masur K, Vetter C, Hinz A, Tomas N, Henrich H, Niggemann B, et al. Diabetogenic glucose and insulin concentrations modulate transcriptome and protein levels involved in tumour cell migration, adhesion and proliferation. Br J Cancer 2011;104:345–52.
- Kawahito S, Kitahata H, Oshita S. Problems associated with glucose toxicity: role of hyperglycemia-induced oxidative stress. World J Gastroenterol 2009;15:4137–42.
- Bloom RD, Crutchlow MF. Transplant-associated hyperglycemia. Transplant. Transplant Rev (Orlando) 2008;22:39–51.
- Huober J, Fasching PA, Hanusch C, Rezai M, Eidtmann H, Kittel K, et al. Neoadjuvant chemotherapy with paclitaxel and everolimus in breast cancer patients with non-responsive tumours to epirubicin/cyclophosphamide (EC) +/- bevacizumab - results of the randomised GeparQuinto study (GBG 44). Eur J Cancer 2013;49:2284–93.
- Zhu AX, Kudo M, Assenat E, Cattan S, Kang YK, Lim HY, et al. Effect of everolimus on survival in advanced hepatocellular carcinoma after failure of sorafenib: the EVOLVE-1 randomized clinical trial. JAMA 2014;312:57–67.
- Jadad AR, Moore RA, Carroll D, Jenkinson C, Reynolds DJ, Gavaghan DJ, et al. Assessing the quality of reports of randomized clinical trials: is blinding necessary? Control Clin Trials 1996;17:1–12.
- Ranpura V, Hapani S, Wu S. Treatment-related mortality with bevacizumab in cancer patients: a meta-analysis. JAMA 2011;305:487–94.
- Shameem R, Lacouture M, Wu S. Incidence and risk of rash to mTOR inhibitors in cancer patients-a meta-analysis of randomized controlled trials. Acta Oncol 2015;54:124–32.
- Institute NC. Common Toxicity Criteria (CTC), Common Terminology Criteria for Adverse Events Version 4.0, 2009.
- Baselga J, Semiglazov V, van Dam P, Manikhas A, Bellet M, Mayordomo J, et al. Phase II randomized study of neoadjuvant everolimus plus letrozole compared with placebo plus letrozole in patients with estrogen receptor-positive breast cancer. J Clin Oncol 2009;27:2630–7.
- Besse B, Leighl N, Bennouna J, Papadimitrakopoulou VA, Blais N, Traynor AM, et al. Phase II study of everolimus-erlotinib in previously treated patients with advanced non-small-cell lung cancer. Ann Oncol 2014;25:409–15.
- Barthel A, Schmoll D. Novel concepts in insulin regulation of hepatic gluconeogenesis. Am J Physiol Endocrinol Metab 2003;285:E685–92.
- Cho DC, Cohen MB, Panka DJ, Collins M, Ghebremichael M, Atkins MB, et al. The efficacy of the novel dual PI3-kinase/mTOR inhibitor NVP-BEZ235 compared with rapamycin in renal cell carcinoma. Clin Cancer Res 2010;16:3628–38.
- Um SH, Frigerio F, Watanabe M, Picard F, Joaquin M, Sticker M, et al. Absence of S6K1 protects against age- and diet-induced obesity while enhancing insulin sensitivity. Nature 2004;431:200–5.
- Fuhrer DK, Kobayashi M, Jiang H. Insulin release and suppression by tacrolimus, rapamycin and cyclosporin A are through regulation of the ATP-sensitive potassium channel. Diabetes Obes Metab 2001;3:393–402.
- Di Paolo S, Teutonico A, Leogrande D, Capobianco C, Schena PF. Chronic inhibition of mammalian target of rapamycin signaling downregulates insulin receptor substrates 1 and 2 and AKT activation: A crossroad between cancer and diabetes? J Am Soc Nephrol 2006;17:2236–44.
- Leibiger IB, Leibiger B, Moede T, Berggren PO. Exocytosis of insulin promotes insulin gene transcription via the insulin receptor/PI-3 kinase/p70 s6 kinase and CaM kinase pathways. Mol Cell 1998;1:933–8.
- Johnson EK, Klotz AD, Vaze AA, Grasso V. Nephrologic and Urologic Emergencies. In: Yeung SJ, Escalante CP, editors. Oncologic Emergencies. Hamilton, ON, Canada: B. C. Decker Inc; 2002. p. 280–303.
- Grgic T, Mis L, Hammond JM. Everolimus: a new mammalian target of rapamycin inhibitor for the treatment of advanced renal cell carcinoma. Ann Pharmacother 2011;45:78–83.
- Kahn CR. The riddle of tumour hypoglycaemia revisited. Clin Endocrinol Metab 1980;9:335–60.
- Novartis. Full prescribing information for Affinitor, 2015.