
Abstract
Bone’s mineral properties, such as particle thickness and degree of alignment have been associated with bone quality. Bone formation, remodeling, aging of the tissue and mineral homeostasis influence mineral particle properties leading to specific patterns across bone. Scanning small angle X-ray scattering (sSAXS) with synchrotron radiation is a powerful tool, which allows us to study bone’s nanoscale mineral properties in a position-resolved way. We used sSAXS, fluorescence light microscopy and backscattered electron (BSE) imaging to study bone’s mineral properties at the tibial midshaft of in vivo-loaded mice. By combining these techniques, we could detect local changes in mineral properties. Regions labeled with calcein fluorochrome have lower mean mineral thickness and degree of mineral alignment. We also observed thinner and less aligned mineral particles near blood vessels. We conclude that mineral properties (i) are altered by fluorochrome labeling and (ii) depend on the proximity to blood vessels.
Introduction
Bone has a hierarchical structure defined at the nanometer-scale as a composite material constituted by a collagen-rich organic matrix in which mineral crystals with a thickness of only a few nanometers are embedded (Citation1,Citation2). The mineral phase is known to act as an ion reservoir and to confer stiffness and hardness to the bone (Citation3). Bone’s material quality is closely associated with the mineral crystal properties, such as size and arrangement (Citation2).
Some studies indicate that mineral crystal size increases with aging (Citation4). Newly formed tissue can be identified based on fluorochrome labeling, since these agents selectively bind to sites of new mineralized tissue formation, and are incorporated into the mineralization front. Although this technique has been routinely used for decades, it remains unclear why this selective binding occurs, although some studies suggest that this is due to the smaller crystal size formed in the initial phase of mineralization, in comparison with older mineralizing sites (Citation5).
We previously studied the bone’s adaptive response to in vivo tibial loading in female mice (Citation6). These mice were given calcein to label new tissue formed in response to loading and growth. Our aim in the present study was to investigate mineral particle properties of this new tissue by using various high-resolution methods. Synchrotron sSAXS (1 μm monochromatic X-ray beam) was combined with fluorescence and BSE imaging, to analyze mean mineral thickness and degree of alignment.
Methods
In vivo loading and sample preparation
Female 10, 26 and 78 week old C57Bl/6J mice underwent in vivo cyclic compressive loading of the left tibia (1200 µε) as previously described (Citation6), their right tibia was an internal control (n = 2/age). Calcein was given via intraperitoneal injection, 12 and 3 d before euthanasia. Both tibiae were fixed in 100% ethanol, embedded in polymethyl methacrylate and sectioned using a microtome (Leica SM2500S; knife: Leica VMH 400, Nussloch, Germany). One, 10 µm thick longitudinal section from each tibia was analyzed using BSE and sSAXS. Animal experiments were approved by the local legal animal welfare representative (LAGeSo Berlin, G0333/09).
sSAXS data acquisition, correction and analysis
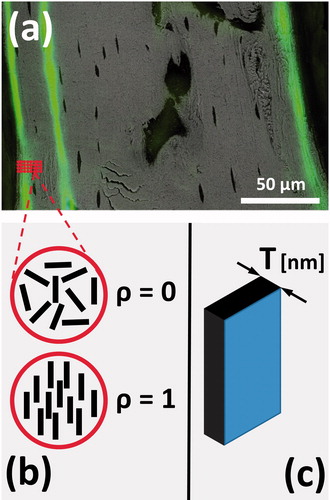
Prior to sSAXS measurements, samples were imaged with fluorescence microscopy (Leica DMRB, Munich, Germany) to identify calcein labeled regions, which enabled us to distinguish between newly formed and mature bone (). A region of the tibial midshaft (125–300 µm × 30–77.5 µm) was examined by sSAXS at the Nanofocus beamline (ID 13) of the European Synchrotron Radiation Facility (ESRF). A monochromatic high energy X-ray beam with a wavelength of 0.0812 nm (E = 15 keV) and a diameter of 1 µm was used to scan samples, with a step size of 1 µm within the plane perpendicular to the incident beam. The sSAXS patterns were captured with an ESRF FReLoN detector (pixel size: 51.7 µm × 51.5 µm, exposure time: 0.6 to 0.8 s). Up to 28 700 sSAXS intensity patterns were collected per sample. All 2D sSAXS patterns were corrected for dark current (CCD readout noise) and for incoming beam intensity fluctuations from ESRF source. 2D sSAXS patterns were radially and azimuthally integrated to obtain I(q) and I(χ), respectively with custom-made software (Autofit, MPI-CI, Potsdam, Germany), with I being the scattering intensity, q the scattering length and χ the azimuthal angle. From the resulting sSAXS intensity function I(q) and based on Porod’s law, the T parameter, the average mineral particle thickness in the scattering volume (), was derived (Citation7). The function I(χ) was used to calculate ρ parameter, the degree of mineral particle alignment within the plane perpendicular to the primary beam. This parameter varies between 0 and 1 (Citation7) ().
Figure 1. (a) Merged BSE and fluorescence image of tibial midshaft; (b) ρ parameter varies between 0 (randomly oriented mineral particles) and 1 (perfectly aligned mineral particles); (c) T parameter corresponds to mean mineral thickness.
BSE imaging
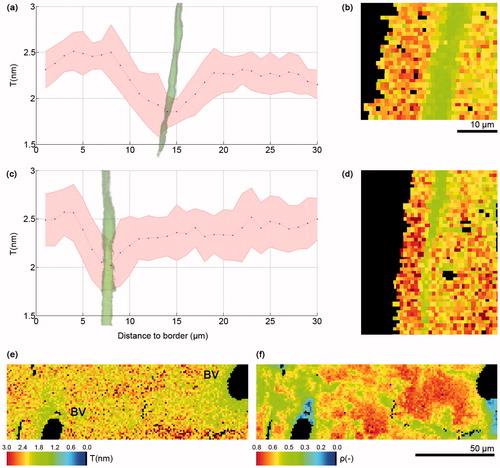
After sSAXS measurements and to visualize the degree of mineralization (mineral content) within the bone, the entire longitudinal section of each tibia was imaged with an environmental scanning electron microscope (FEI FEG-ESEM Quanta 600, Hilsboro, OR) in BSE mode (Citation2) under low vacuum (0.8 Torr). An operating voltage of 12.5 kV and working distance of 10 mm was used. Images collected using these multiple methods were overlaid onto each other to correlate the degree of mineralization and calcein label location () with sSAXS maps of mean mineral thickness () and degree of mineral alignment () from the same regions.
Figure 2. Graph of T parameter profile 30 µm through cortex starting at periosteal border in a loaded tibiae of a (a) 26 week old and (c) 78 week old mouse, the red line in the graphs corresponds to the average T parameter, while the shadowed pink area above and below the red line represents the standard deviation; (b) (d) T parameter map of first 30 µm of the tibial section; Lower T (e) and ρ parameter (f) near blood vessels in control tibia of a 10 week old mouse. BV, blood vessel.
Results
Areas labeled with calcein had lower T and ρ parameters
Calcein-labeled regions within the bone corresponded to regions of lower mean mineral thickness and degree of mineral alignment (). When plotting changes in T and ρ parameters along the first 30 µm from the bone surface, we detected a peak of low T and ρ at approximately 30, 15 and 8 µm in tibia from 10, 26 () and 78 week old () mice, respectively, which corresponded to the calcein label location. Correlating T and ρ maps with fluorescence microscopy images also indicated that this pattern corresponded to the location of the calcein label itself. One tibia from a 10 week old mouse with a diffuse calcein label did not adhere to this same pattern.
Mineral particles around blood vessels have lower T and ρ parameters
We observed that the regions surrounding blood vessels corresponded to areas with lower mean mineral particle thickness () and lower degree of alignment of mineral particles (). This pattern could be observed around all the scanned blood vessels and for mice of all ages: 10 (3 blood vessels), 26 (1 blood vessel) and 78 (2 blood vessels) week old mice.
Discussion
Our results showed lower mean mineral thickness and degree of mineral particle alignment where calcein fluorochrome labels were located. A study in rats labeled with different fluorochromes also showed a decrease in the degree of mineral alignment, but not in mean mineral thickness on the border between new and old bone (Citation8). However, an in vitro study showed a direct relationship between alizarin red concentration and apatite like crystal size and growth kinetics (Citation9). Our results indicate that the calcein might not only bind to mineralizing surfaces, but also interfere with mineral growth. The calcein may act in a similar manner as noncollagenous proteins in governing mineral growth. Interestingly, BSE imaging on selected samples did not show different mineral content at the calcein label sites (), but this would need to be studied further using quantitative methods such as quantitative backscattered electron imaging (qBEI) (Citation2). We observed that the regions surrounding blood vessels have thinner and less aligned mineral particles. In contrast to our findings at the calcein label location, the presence of thinner and less aligned mineral particles near the blood vessels was likely mainly related to the age of this tissue rather than alterations in crystal growth.
Due to the high resolution and time restrictions during synchrotron measurements, our sample size was limited and thus further studies examining a larger number of mice are needed to confirm these results. Also, studies examining human bone biopsies have shown different fluorochromes have different binding affinities, so other fluorochromes should be studied, including tetracycline which is used clinically (Citation10).
Conclusion
Using a multi-method approach, we have shown that the mean mineral particle thickness and degree of alignment were lower in the areas where particles were bound with calcein labeling. These findings suggest that fluorochrome labeling might not only bind to mineralizing surfaces, but also alters mineral properties, including stunting their growth, and thus affect bone mineral quality. We also showed that thinner and less aligned particles were present near blood vessels, indicating this tissue is younger.
Declaration of interest
This study was funded by the German Federal Ministry (BMBF; Osteopath grant/TP6), German Research Foundation (DFG; WI 3761/1-1 and FR 2190/4-1 Gottfried Wilhelm Leibniz-Preis 2010) and the ESRF. All authors have no conflicts of interest.
Acknowledgments
The authors thank Michael Reynolds, Marzena Princ, Tobias Thiele and Annette Birkhold for assistance.
References
- Weiner S, Wagner H. The material bone: structure mechanical function relations. Ann Rev Mater Sci 1998;28:271–98
- Fratzl P, Gupta HS, Paschalis EP, Roschger P. Structure and mechanical quality of the collagen-mineral nano-composite in bone. J Mater Chem 2004;14:2115–23
- Buehler MJ. Molecular nanomechanics of nascent bone: fibrillar toughening by mineralization. Nanotechnology 2007;18:183–6
- Gourion-Arsiquaud S, Burket JC, Havill LM, DiCarlo E, Doty SB, Mendelsohn R, Van der Meulen MC, Boskey AL. Spatial variation in osteonal bone properties relative to tissue and animal age. J Bone Miner Res 2009;24:1271–81
- Erben RG. Bone-labeling techniques. In: An YH, Martin KL, eds. Handbook of histology methods for bone and cartillage. Totowa: Humana Press; 2003:99–117
- Willie BM, Birkhold AI, Razi H, Thiele T, Aido M, Kruck B, Schill A, Checa S, Main RP, Duda GN. Diminished response to in vivo mechanical loading in trabecular and not cortical bone in adulthood of female C57Bl/6 mice coincides with a reduction in deformation to load. Bone 2013;55:335–46
- Rinnerthaler S, Roschger P, Jakob HF, Nader A, Klaushofer K, Fratzl P. Scanning small angle X-ray scattering analysis of human bone sections. Calcif Tissue Int 1999;64:422–9
- Bünger MH, Oxlund H, Hansen TK, Sørensen S, Bibby BM, Thomsen JS, Langdahl BL, Besenbacher F, Pedersen JS, Birkedal H. Strontium and bone nanostructure in normal and ovariectomized rats investigated by scanning small-angle X-ray scattering. Calcif Tissue Int 2010;86:294–306
- Ibsen CJ, Birkedal H. Modification of bone-like apatite nanoparticle size and growth kinetics by alizarin red S. Nanoscale 2010;2:2478–86
- Lindsay R, Zhou H, Cosman F, Nieves J, Dempster D. Double and quadruple tetracycline labeling of bone: impact of the label itself. J Bone Miner Res 2013;28:222–3