
Abstract
Objectives. Accumulation of extracellular matrix (ECM) components is an early sign of diabetic nephropathy. Also the glycosaminoglycan hyaluronan (HA) is elevated in the renal interstitium during experimental diabetes. The mammalian target of rapamycin (mTOR) pathway participates in the signaling of hyperglycemia-induced ECM accumulation in the kidney, but this has not yet been investigated for HA. We hypothesized that interstitial HA accumulation during diabetes may involve mTOR activation.
Methods. Diabetic rats (6 weeks post-streptozotocin (STZ)) were treated with rapamycin to inhibit mTOR or vehicle for 2 additional weeks. Kidney function (glomerular filtration rate, renal blood flow, urine output) and regional renal HA content were thereafter analyzed. The ability of the animals to respond to desmopressin was also tested.
Results. Diabetic animals displayed hyperglycemia, proteinuria, hyperfiltration, renal hypertrophy, increased diuresis with reduced urine osmolality, and reduced weight gain. Cortical and outer medullary HA was elevated in diabetic rats. Urine hyaluronidase activity was almost doubled in diabetic rats compared with controls. The ability to respond to desmopressin was absent in diabetic rats. Renal blood flow and arterial blood pressure were unaffected by the diabetic state. In diabetic rats treated with rapamycin the proteinuria was reduced by 32%, while all other parameters were unaffected.
Conclusion. Regional renal accumulation of the ECM component HA is not sensitive to mTOR inhibition by rapamycin, while proteinuria is reduced in established STZ-induced diabetes. Whether the diabetes-induced renal accumulation of HA occurs through different pathways than other ECM components, or is irreversible after being established, remains to be shown.
Introduction
In diabetic nephropathy (DN) renal hypertrophy and an accumulation of extracellular matrix (ECM) components are evident early in the disease process (Citation1-4). The excessive ECM accumulation results in glomerular and tubular basement membrane thickening, mesangial expansion, and glomerular hypertrophy, leading to progressive scarring and fibrosis of the kidney parenchyma (Citation5-7) and interstitial edema (Citation8). Major ECM components that are affected during DN are collagen (types I, IV, V, and VI), laminin, fibronectin, and hyaluronan (HA) (Citation4,9-11).
The mammalian target of rapamycin (mTOR) senses and mediates environmental cues, e.g. on hyperglycemia in the extracellular space, to the nucleus of the cell, thereby inducing increased ECM synthesis (Citation3,4,12). In a study by Kultti et al. (Citation13) it was demonstrated that HA synthesis by hyaluronan synthase-2 (HAS2) in MCF-7 cells (human breast cancer) was attenuated by the mTOR inhibitor rapamycin, suggesting an involvement of this pathway. However, the connection between hyperglycemia, mTOR, and accumulation of kidney HA has not yet been investigated. The negatively charged interstitial glycosaminoglycan HA does not contain protein or sulphate groups, as the other ECM components listed above, which implies that the regulatory pathways may differ. Whereas other glycosaminoglycans are synthesized in the Golgi apparatus, HA is synthesized in the plasma membrane. HA has large water-attracting ability (Citation14), and, in the kidney, it is predominantly found in the inner medulla during normal physiological conditions (Citation15-18). In the diseased kidney, such as during renal failure, tubulointerstitial fibrosis, or renal transplant rejection, the cortical amount of HA increases. This gives rise to interstitial inflammation and edema, with consequences for fluid transport (Citation8,16,19,20). During hyperglycemia, several kidney cells (proximal tubular cells, renal fibroblasts, mesangial cells) in culture produce HA at an increased rate (Citation21-24). Furthermore, in diabetes in both rats (Citation9,25) and humans (Citation26,27) increased kidney HA content has been demonstrated. This implies that diabetes promotes HA production in the kidney, which subsequently plays a pathogenic role in the development of DN due to changes in matrix composition and properties. We hypothesized that interstitial HA accumulation during diabetes involves mTOR signaling and therefore treated established streptozotocin (STZ)-diabetic rats with the mTOR inhibitor rapamycin, an immunosuppressant used to prevent rejection of e.g. renal transplants, and thereafter measured kidney function and HA content.
Materials and methods
Animals
All experiments were approved by the Animal Care and Use Committee of Uppsala University and were performed in accordance with the NIH guidelines for use and care of laboratory animals. The animals were kept in a room with controlled temperature of 24°C and a 12-h cycle of light and dark, and had free access to tap water and standard rat chow. All chemicals were purchased from Sigma-Aldrich (St. Louis, MO, USA) unless otherwise stated.
Male Sprague–Dawley rats (n = 40, body weight ∼270 g; Charles River, Sulzfeld, Germany) were divided into four groups. Half the animals were made diabetic by an intravenous dose of STZ (50 mg/kg body weight; Sigma-Aldrich, St. Louis, MO, USA) into the tail vein. The diabetic state (blood glucose above 20 mmol/L) was monitored by blood glucose test strips (MediSense, Bedford, MA, USA) in blood from a small cut in the tail tip. Blood glucose was tested 2 days after STZ, and weekly throughout the experiment, together with body weight, for a total of 8 weeks. The diabetic and control groups were given either rapamycin (0.45 mg/kg body weight/day; Rapamune, Pfizer, New York City, NY, USA) or sham treatment by oral gavage once per day, from diabetic week 7 through 8.
After 8 weeks of diabetes and 2 weeks of rapamycin or sham treatment, the rats were anesthetized with an intraperitoneal injection of thiobutabarbital (Inactin, 120 mg/kg body weight) and were placed on a heating pad to maintain a core temperature of 37.5°C.
Surgery
The anesthetized rats were tracheotomized, and polyethylene catheters were inserted into the right femoral vein and artery. The venous catheter was used for infusion. The arterial catheter was used for measurement of mean arterial blood pressure (MAP) and blood sampling. The urinary bladder was catheterized through a suprapubic incision for urine sampling. The left kidney was exposed through a subcostal flank incision and immobilized in a plastic cup, lined with saline-soaked cotton wool. The kidney surface was covered with paraffin oil (Apoteksbolaget, Gothenburg, Sweden). The surgery was followed by a post-surgery 45 min equilibration period.
Experimental protocol
The equilibration period was followed by a 30 min measurement period for establishment of baseline parameters. The glomerular filtration rate (GFR) was estimated from fluorescein isothiocyanate (FITC)-inulin clearance. For this purpose FITC-inulin dissolved in Ringer acetate (Fresenius Kabi, Bad Homburg, Germany) was infused (Controls: 5 mL/kg body weight/h; Diabetic animals: 10 mL/kg body weight/h) from the start of the equilibration period, at a final concentration of 0.375%.
The FITC-inulin infusion was prepared from a stock solution of 1.5% concentration, prepared in PBS, and filtered through a 0.45 µm syringe filter. The solution was then dialyzed in 2000 mL PBS at 4°C overnight, using a 1000 Da cut-off dialysis membrane (Spectra/Por® 6 Membrane, Spectrum Laboratories Inc., Rancho Dominguez, CA, USA). The dialyzed inulin solution was filtered through a 0.22 µm syringe filter before its dilution in Ringer to the final concentration, in preparation for use. The FITC solution was protected from light at all times during preparation, use, and after the experiment.
After the baseline period followed two measurement periods of 30 min each, with the infusion supplemented with desmopressin (dAVP; Minirin, Ferring, Saint-Prex, Switzerland) to challenge the water concentrating ability. The dAVP infusion was initiated by a bolus dose of 0.1 mL of a 60 ng/mL solution. The bolus dose was flushed into the system with 0.3 mL, and followed by a maintenance infusion of 4 ng/mL of dAVP dissolved in the FITC-inulin Ringer solution.
After completion of the two experimental periods, the kidneys were excised and weighed. Samples were taken from the cortex, outer medulla, and inner medulla (papilla) and frozen for subsequent analysis of HA content.
Measurement of HA content
The frozen kidney samples were dried at 68°C overnight, then disrupted in 0.5 mol/L NaCl (FP120, Thermo Electron Corporation, Marietta, OH, USA). The disrupted HA samples were left to extract overnight at 4°C. Protein content of the samples was measured using a commercial assay (DC Protein Assay, Bio-Rad Laboratories, Hercules, CA, USA). The HA samples were then centrifuged at 2700g for 15 min. The HA content of the supernatant was measured by a commercial ELISA kit and following the instructions provided by the manufacturer (Echelon Biosciences Inc., Salt Lake City, UT, USA).
Measurement of GFR, renal blood flow, and urine parameters
GFR was approximated from clearance of FITC-inulin. The FITC-inulin was given as a continuous infusion, dissolved in Ringer solution. GFR was approximated from inulin clearance and calculated by the formula GFR = U × V/P, where U and P denote the fluorescence of FITC-inulin in the urine and plasma, respectively, and V denotes the urine flow rate. The original plasma samples of 2 µL were diluted with 68 µL HEPES buffer (pH 7.4), and the urine samples were loaded similarly, but diluted another 10 times before adding HEPES. The samples were loaded onto a black 384-well microplate (Greiner Bio-One GmbH, Kremsmuenster, Austria) and measured in the plate reader (Safire II, Tecan Austria GmbH, Grödig, Austria) at 496 nm excitation and 520 nm emission.
The renal blood flow (RBF) was measured by an ultrasound probe (Transonic Systems, Ithaca, NY, USA), placed around the renal artery of the left kidney. Both RBF and MAP were measured continuously and recorded by a PowerLab instrument (AD Instruments, Hastings, UK). The urine volume was measured gravimetrically. Urine osmolality was estimated from the depression of the freezing point (Model 210, The Fiske Micro-Sample Osmometer Advanced Instruments, Norwood, MA, USA).
Urine hyaluronidase activity and creatinine
HA from rooster comb and all reagents for the polymerization of electrophoretic gels were obtained from Wako Pure Chemical Industries (Osaka, Japan); Alcian blue 8GX from Fluka Chemical (Buchs, Switzerland), and Actinase E from Kaken Pharmaceutical (Tokyo, Japan).
Urinary hyaluronidase (HYAL) activity was determined by quantitative zymography (Citation28) with a slight modification. Briefly, rat urine was diluted 1–5-fold with 0.15 mol/L NaCl containing 0.1 mg/mL BSA and mixed with an equivalent volume of Laemmli’s sample buffer containing 4% SDS and no reducing reagent. After incubation for 1 h at 37°C, 5–15 μL of the mixture (urine: 1–5 μL, and serum: 0.05–0.15 μL) were applied to 7% SDS-polyacrylamide gels containing 0.17 mg/mL HA. After an electrophoretic run at 20 mA for approximately 90 min at 4°C, gels were rinsed with 2.5% Triton X-100 for 80 min at room temperature and incubated with 0.1 mol/L formate buffer (pH 3.5 and containing 0.03 mol/L NaCl) for 15 h at 37°C on an orbital shaker. Gels were then treated with 0.1 mg/mL Actinase E in 20 mmol/L Tris–HCl buffer (pH 8.0) for 2 h at 37°C. To visualize digestion of HA, gels were stained with 0.5% Alcian blue in 25% ethanol–10% acetic acid. After destaining, gels were counterstained with Coomassie brilliant blue R-250. For the determination of HYAL activity, the stained gel was scanned on an Image Scanner (GE Healthcare Japan, Tokyo, Japan) and scans were analyzed using Image J 1.42q software (National Institutes of Health, USA, http://rsb.info.nih.gov/ij/). The relative band intensities of rat urinary HYAL were calculated from the ratios of the band intensity of HYAL from 0.05 μL of a control rat serum, as a standard on the same gel.
Creatinine in urine was determined colorimetrically using a commercial assay kit and following the instructions provided by the manufacturer (LabAssayTM Creatinine, Wako Pure Chemical Industries). The blank values originating in FITC-inulin were subtracted.
Statistical analysis
Data are given as mean values ± SEM. The comparison between groups was evaluated with two-way ANOVA followed by Fisher LSD post-hoc test. A P value of <0.05 was considered statistically significant.
Results
Diabetic animals developed hyperglycemia, increased diuresis with reduced urine osmolality, renal hypertrophy, hyperfiltration, and reduced body weight gain, as compared with corresponding controls (). Arterial blood pressure and renal blood flow were, however, similar in diabetics and vehicle controls. Rapamycin treatment did not affect any of these values during control or diabetic conditions, although a tendency was seen towards a reduced arterial blood pressure.
Table I. Control and diabetic rats treated with vehicle or the mTOR inhibitor rapamycin (Rapa).
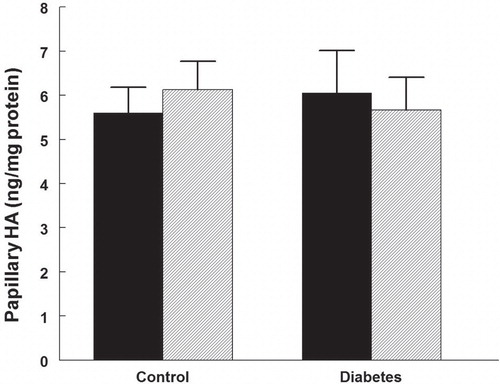
HA was regionally accumulated in the kidneys of diabetic rats. The cortical HA content increased more than twice (), while that of the outer medulla increased more than 3-fold (). Papillary HA content was not different between control and diabetic rats (). Rapamycin treatment did not alter the diabetes-induced HA accumulation in any part of the kidney, and did also not affect the HA in controls.
Figure 1. Cortical hyaluronan (HA) content in control and diabetic rats treated with vehicle (black bars) or rapamycin (hatched bars). *P < 0.05 versus corresponding control group. n = 10 in each group.
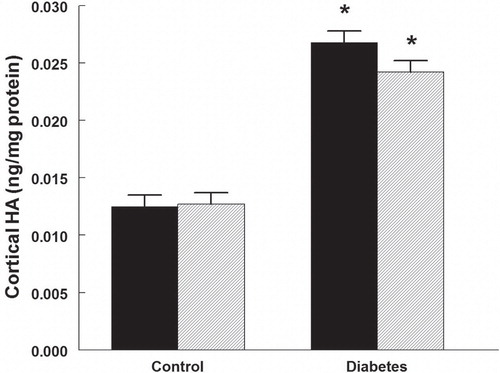
Figure 2. Outer medullary hyaluronan (HA) content in control and diabetic rats treated with vehicle (black bars) or rapamycin (hatched bars). *P < 0.05 versus corresponding control group. n = 10 in each group.
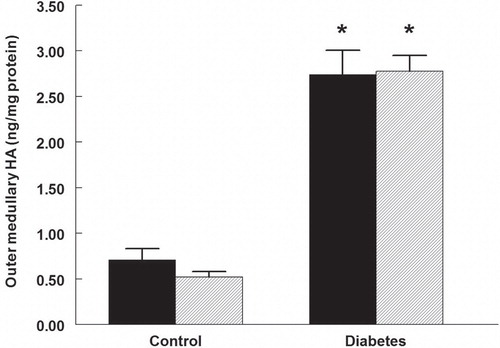
Figure 3. Papillary hyaluronan (HA) content in control and diabetic rats treated with vehicle (black bars) or rapamycin (hatched bars). n = 10 in each group.
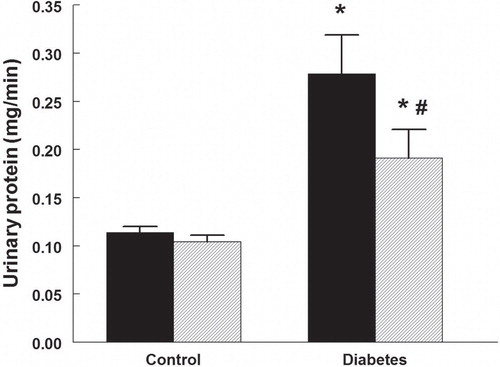
Urine protein excretion was higher in diabetic rats () and was reduced by 32% in those treated with rapamycin. Rapamycin did not alter protein excretion in control rats.
Figure 4. Urinary protein excretion in control and diabetic rats treated with vehicle (black bars) or rapamycin (hatched bars). *P < 0.05 versus corresponding control group; # P < 0.05 versus vehicle-treated diabetics. n = 10 in each group.
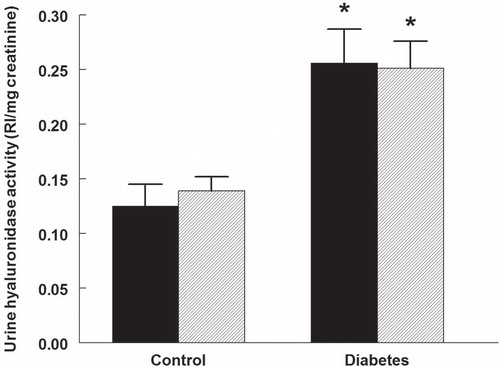
The urine HYAL activity was 95% higher in diabetic rats, compared with controls (). No change occurred in the activity in animals of either group treated with rapamycin.
Figure 5. Urine hyaluronidase activity in control and diabetic rats treated with vehicle (black bars) or rapamycin (hatched bars). *P < 0.05 versus corresponding control group. n = 10 in each group. RI = Relative intensity.
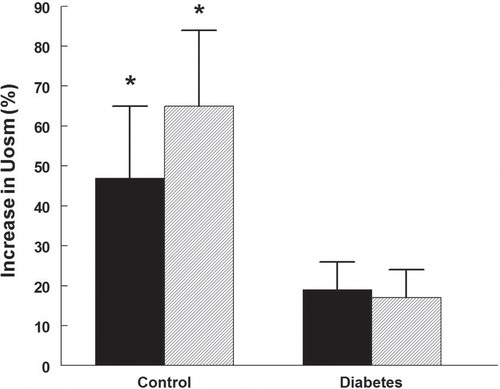
The ability of the rats to respond to the vasopressin V2-receptor agonist desmopressin with increased urine osmolality was affected in the diabetic rats (). Control rats treated or untreated with rapamycin elevated their urine osmolality by 46%–64% (P < 0.05). In the diabetic rats urine osmolality did not increase.
Figure 6. Change in urine osmolality during challenge with the vasopressin V2-receptor agonist desmopressin in control and diabetic rats with (hatched bars) or without (black bars) rapamycin treatment. *P < 0.05 versus before desmopressin. n = 10 in each group.
Discussion
The present study has demonstrated accumulation of the ECM component HA in the kidney during established diabetes, which is not affected by treatment with the mTOR inhibitor rapamycin. However, rapamycin treatment did reduce diabetes-induced proteinuria. The results suggest that HA, as opposed to other ECM components such as collagen, laminin, and fibronectin, is not induced via mTOR activation in the kidney during hyperglycemic conditions. Whether this discrepancy depends on the unique structure of HA compared with other ECM components, such as not containing sulphate groups or peptide, remains to be established. An alternative explanation would be that an already established accumulation of HA is not reversible. We could also demonstrate a reduced ability of the diabetic animals to respond with an elevation in urine osmolality when challenged with a vasopressin V2-receptor agonist.
The mTOR is a signaling pathway of hyperglycemia, transmitting signals from the extracellular space to cell nuclei, like a metabolic sensor (Citation4). It is a protein kinase, existing in two distinct complexes, namely complex 1 (mTORC1) and complex 2 (mTORC2) (Citation29). Rapamycin is primarily an inhibitor of mTORC1, which in turn is a regulator of several cellular processes such as cell growth, proliferation, and protein synthesis. Over-activation of mTORC1 in podocytes leads to albuminuria, glomerular basement membrane widening, expansion of the mesangium, and accumulation of fibronectin and collagen IV. All those events are partially prevented by rapamycin (Citation30). In a study by Kultti et al. (Citation13) rapamycin reduced HA production by MCF-7 cells in culture (human breast cancer model). In the present study, however, rapamycin treatment during established diabetes in rats failed to reduce the accumulation of HA in the kidney, thus suggesting a non-mTOR-mediated response. It cannot be concluded whether the discrepancies in results are cell/organ-dependent or if the established HA accumulation cannot be reversed. There are several other pathways that could induce renal HA during hyperglycemia in this study: oxidative stress, transforming growth factor beta (TGF-β), protein kinase C (PKC), nuclear factor-kappaB (NF-κB), prostaglandin E2, cytokines (e.g. interleukin-1), and platelet-derived growth factor (Citation11,12,31).
HA has potent water-attracting properties, and in fragments it is also pro-inflammatory (Citation14), which makes HA a suitable candidate for an ECM component involved in diabetic nephropathy and other kidney diseases (Citation11). These special features of HA will affect fluid transport in the interstitial space, and drive inflammatory pathways. Previous studies have demonstrated an increased HA content in diabetic kidneys (Citation8,9,24-27). The effect of hyperglycemia on cellular HA production in vitro has also previously been demonstrated: proximal tubular cells (Citation22), glomerular cells (Citation21), renal interstitial fibroblasts (Citation23), and mesangial cells (Citation24) increase their production of HA during hyperglycemic conditions. In interstitial fibroblasts, high glucose has been shown to stimulate HA production through the PKC/TGF-β cascade, whereas in proximal tubular cells the HA elevation was associated with NF-κB-activated transcription of hyaluronan synthase 2 (HAS2). Whether the same cellular events, leading from hyperglycemia to elevated HA production, are evident in vivo, i.e. as in the present study, remains to be elucidated, but it appears plausible.
The elevated HA levels in the renal cortex and outer medulla in STZ-diabetic rats can be expected to affect fluid transport and inflammation due to the inherent properties of this glycosaminoglycan with water-attracting and pro-inflammatory properties (Citation11,14). Normally, HA of mega-Dalton size should only be found in very small amounts in the cortical tissue, while it is abundant in the papilla. Increased HA in the renal cortex is found in several pathological situations, such as ischemia-reperfusion injury, tubulointerstitial inflammation, and renal transplant rejection (Citation8,15,16,19,20,32,33). During these conditions it is expected to be more fragmented (Citation34), which would render it pro-inflammatory. Furthermore, an elevation of HA in the outer medulla is found in the Brattleboro rat with hereditary diabetes insipidus (Citation17), which cannot concentrate its urine due to vasopressin deficiency. In the studies referred to above an inability to regulate fluid balance and concentrate urine is evident, and in most cases interstitial inflammation is found. It is also of interest to note that normally medullary HA levels, as opposed to those in the cortex, change in relation to body hydration status in the rat. During hydration medullary HA is elevated, and the opposite occurs during dehydration (Citation17,18,35). Furthermore, pharmacological reduction of renomedullary HA in the normal kidney reduces the ability of the kidney to respond appropriately to acute hydration (Citation36). By changing the physicochemical characteristics of the interstitial space, which may involve alterations in the interstitial hydrostatic pressure, HA will affect fluid handling (Citation37-39). The regulation of renal HA levels in the normal kidney involves both fluid-regulating hormones and osmolality (Citation10,40).
The only parameter that was significantly affected by rapamycin treatment in the present study was the diabetes-induced proteinuria, which was reduced by 32%, without any associated changes in GFR. A tendency of a hypotensive effect of rapamycin did not reach statistical significance, neither in control nor in diabetic rats. The reduction in proteinuria by rapamycin is a well-established feature (Citation3,41-43). A suggested explanation for the effect is that over-activation of mTORC1 on podocytes, as during hyperglycemia, causes mislocalization of the proteins composing the filtration slits and gives rise to increased endoplasmic reticulum (ER) stress (Citation43). This leads to increased glomerular permeability for macromolecules. Reducing the mTOR activation by use of rapamycin will therefore reduce proteinuria.
Urine HYAL activity was increased in the diabetic rats, which may be a compensation for the elevated HA levels in the tissue. Sequences for six hyaluronidase-like genes were demonstrated by Csoka et al. (Citation44), and HYAL 1 is the predominant form and the only HYAL found in human plasma. It can therefore be hypothesized that HYAL 1 activity also dominates in the urine. In a previous investigation on STZ-diabetic rats by Ikegami-Kawai et al. (Citation45), renal HYAL activity increased from day 3 of diabetes and was doubled after 3 weeks, which is similar to the findings in urine in the present study. HYAL activity increased only in the STZ-induced diabetic rats, and not in spontaneously diabetic Goto-Kakizaki rats (type 2 diabetic model), the latter without progressed nephropathy. Thus, HYAL may be used as a marker of DN. The elevated HYAL activity in the diabetic kidney may also contribute to the inability to gain sufficient elevation in interstitial HA during hydration (Citation25). It is, furthermore, of interest to note that lack of HYAL exacerbates inflammation and fibrosis in the kidney after ischemia-reperfusion injury (Citation46).
The reduced ability of diabetic rats appropriately to increase urine osmolality when challenged with the vasopressin V2-receptor agonist desmopressin shows that the vasopressin-aquaporin function in these rats is abrogated. We have previously demonstrated a relative inability of STZ-diabetic rats to respond with appropriate diuresis upon a hydration challenge (Citation25), which is in line with the present results. The plasma concentration of vasopressin and abundance of medullary key proteins for urinary concentration, such as aquaporin 2 and urea transporter A1, are elevated in diabetic rats in spite of ongoing osmotic diuresis (Citation47-49). These previous findings are plausible underlying mechanisms to the unresponsiveness of the diabetic animals to vasopressin V2-receptor stimulation in the present study.
In conclusion, established STZ-induced diabetes results in regional renal accumulation of the ECM component HA, which is not sensitive to mTOR inhibition by rapamycin. The diabetes-induced proteinuria is, however, sensitive to rapamycin. Whether the diabetes-induced renal accumulation of HA occurs through different pathways than other ECM components containing protein and sulphate groups, or is irreversible when established, remains to be shown.
Acknowledgements
The skillful technical assistance of Angelica Fasching is gratefully acknowledged. We thank Ebba Sivertsen for excellent advice on rapamycin treatment and Leif Jansson for critical comments on the manuscript. S. Stridh performed the experiments and a major part of data analysis and helped in analysis and writing the paper. F. Palm helped in the analysis of the study and in writing the paper. T. Takahashi and M. Ikegami-Kawai performed the hyaluronidase analysis and helped in writing the paper. P. Hansell designed the study and helped in analysis and writing the paper.
Funding: Financial support was provided by grants from the Swedish Science Council (Medicine) grant number 10840.
Declaration of interest: The authors declare that there is no conflict of interest regarding the publication of this paper.
References
- Steffes MW, Bilous RW, Sutherland DE, Mauer SM. Cell and matrix components of the glomerular mesangium in type I diabetes. Diabetes. 1992;41:679–84.
- Mason RM, Wahab NA. Extracellular matrix metabolism in diabetic nephropathy. J Am Soc Nephrol. 2003;14:1358–73.
- Lloberas N, Cruzado JM, Franquesa M, Herrero-Fresneda I, Torras J, Alperovich G, et al. Mammalian target of rapamycin pathway blockade slows progression of diabetic kidney disease in rats. J Am Soc Nephrol. 2006;17:1395–404.
- Mariappan MM. Signaling mechanisms in the regulation of renal matrix metabolism in diabetes. Exp Diabetes Res. 2012;2012:749812.
- Gilbert RE, Cooper ME. The tubulointerstitium in progressive diabetic kidney disease: more than an aftermath of glomerular injury? Kidney Int. 1999;56:1627–37.
- Molitch ME, DeFronzo RA, Franz MJ, Keane WF, Mogensen CE, Parving HH, et al. Nephropathy in diabetes. Diabetes Care. 2004;27:S79–83.
- Najafian B, Mauer M. Progression of diabetic nephropathy in type 1 diabetic patients. Diab Res Clin Pract. 2009;83:1–8.
- Melin J, Hellberg O, Funa K, Hällgren R, Larsson E, Fellström BE. Ischemia-induced renal expression of hyaluronan and CD44 in diabetic rats. Nephron Exp Nephrol. 2006;103:e86–94.
- Malathy K, Kurup PA. Metabolism of glycosaminoglycans in alloxan diabetic rats. I. Changes in tissue glycosaminoglycans. Diabetes. 1972;21:1162–7.
- Rügheimer L, Johnsson C, Maric C, Hansell P. Hormonal regulation of renomedullary hyaluronan. Acta Physiol (Oxf). 2008;193:191–8.
- Stridh S, Palm F, Hansell P. Renal interstitial hyaluronan: functional aspects during normal and pathological conditions. Am J Physiol. 2012;302:R1235–49.
- Brosius FC, Alpers CE. New targets for treatment of diabetic nephropathy: what we have learned from animal models. Curr Opin Nephrol Hypertens. 2013;22:17–25.
- Kultti A, Kärnä R, Rilla K, Nurminen P, Koli E, Makkonen KM, et al. Methyl-beta-cyclodextrin suppresses hyaluronan synthesis by down-regulation of hyaluronan synthase 2 through inhibition of Akt. J Biol Chem. 2010;285:22901–10.
- Laurent TC, Fraser JRE. Hyaluronan. FASEB J. 1992;6:2397–404.
- Wells AF, Larsson E, Tengblad A, Fellström B, Tufveson G, Klareskog L, et al. The localization of hyaluronan in normal and rejected human kidneys. Transplantation. 1990;50:240–3.
- Johnsson C, Tufveson G, Wahlberg J, Hällgren R. Experimentally-induced warm renal ischemia induces cortical accumulation of hyaluronan in the kidney. Kidney Int. 1996;50:1224–9.
- Hansell P, Göransson V, Odlind C, Gerdin B, Hällgren R. Hyaluronan content in the kidney in different states of body hydration. Kidney Int. 2000;58:2061–8.
- Göransson V, Johnsson C, Nylander O, Hansell P. Renomedullary and intestinal hyaluronan content during body water excess. A comparative study in rats and gerbils. J Physiol. 2002;542:315–22.
- Göransson V, Johnsson C, Jacobson A, Heldin P, Hällgren R, Hansell P. Renal hyaluronan accumulation and hyaluronan synthase expression after ischaemia-reperfusion injury in the rat. Nephrol Dialys Transplant. 2004;19:823–30.
- Nilsson ABM, Johnsson C, Friberg P, Hansell P. Renal cortical accumulation of hyaluronan in adult rats neonatally exposed to ACE inhibition. Acta Physiol Scand. 2001;173:343–50.
- Mahadevan P, Larkins RG, Fraser JR, Fosang AJ, Dunlop ME. Increased hyaluronan production in the glomeruli from diabetic rats: a link between glucose-induced prostaglandin production and reduced sulphated proteoglycan. Diabetologia. 1995;38:298–305.
- Jones S, Jones S, Phillips AO. Regulation of renal proximal tubular epithelial cell hyaluronan generation: implications for diabetic nephropathy. Kidney Int. 2001;59:1739–49.
- Takeda M, Babazono T, Nitta K, Iwamoto Y. High glucose stimulates hyaluronan production by renal interstitial fibroblasts through the protein kinase C and transforming growth factor-beta cascade. Metabolism. 2001;50:789–94.
- Wang A, Hascall VC. Hyaluronan structures synthesized by rat mesangial cells in response to hyperglycemia induce monocyte adhesion. J Biol Chem. 2004;279:10279–85.
- Rügheimer L, Carlsson C, Johnsson C, Hansell P. Renal hyaluronan content during experimental uncontrolled diabetes in rats. J Physiol Pharmacol. 2008;59:115–28.
- Lewis A, Steadman R, Manley P, Craig K, de la Motte C, Hascall V, et al. Diabetic nephropathy, inflammation, hyaluronan and interstitial fibrosis. Histol Histopathol. 2008;23:731–9.
- Berenson GS, Ruiz H, Dalferes ERJr, Dugan FA, Radhakrishnamurthy B. Acid mucopolysaccharide changes in diabetic kidneys. Diabetes. 1970;19:161–70.
- Ikegami-Kawai M, Okuda R, Nemoto T, Inada N, Takahashi T. Enhanced activity of serum and urinary hyaluronidases in streptozotocin-induced diabetic Wistar and GK rats. Glycobiology. 2004;14:65–72.
- Wullschleger S, Loewith R, Hall MN. TOR signaling in growth and metabolism. Cell. 2006;124:471–84.
- Gödel M, Hartleben B, Herbach N, Liu S, Zschiedrich S, Lu S, et al. Role of mTOR in podocyte function and diabetic nephropathy in humans and mice. J Clin Invest. 2011;121:2197–209.
- Dunlop ME, Clark S, Mahadevan P, Muggli E, Larkins RG. Production of hyaluronan by glomerular mesangial cells in response to fibronectin and platelet-derived growth factor. Kidney Int. 1996;50:40–4.
- Declèves AE, Caron N, Nonclercq D, Legrand A, Toubeau G, Kramp R, et al. Dynamics of hyaluronan, CD44, and inflammatory cells in the rat kidney after ischemia/reperfusion injury. Int J Mol Med. 2006;18:83–94.
- Stridh S, Kerjaschki D, Chen Y, Rügheimer L, Astrand AB, Johnsson C, et al. Angiotensin converting enzyme inhibition blocks interstitial hyaluronan dissipation in the neonatal rat kidney via hyaluronan synthase 2 and hyaluronidase 1. Matrix Biol. 2011;30:62–9.
- Declèves AE, Caron N, Voisin V, Legrand A, Bouby N, Kultti A, et al. Synthesis and fragmentation of hyaluronan in renal ischaemia. Nephrol Dial Transpl. 2012;27:3771–81.
- Rügheimer L, Olerud J, Johnsson C, Takahashi T, Shimizu K, Hansell P. Hyaluronan synthases and hyaluronidases in the kidney during changes in hydration status. Matrix Biol. 2009;28:390–5.
- Stridh S, Palm F, Hansell P. Inhibition of hyaluronan synthesis in rats reduces renal ability to excrete fluid and electrolytes during acute hydration. Ups J Med Sci. 2013;118:217–21.
- Lai-Fook SJ, Brown LV, Maudgalya VS, Knapp CF, Ganesan S. Effect of increased acceleration on regional pleural pressure in dogs. J Appl Physiol. 1991;71:611–19.
- Zawieja DC, Garcia C, Granger HJ. Oxygen radicals, enzymes, and fluid transport through pericardial interstitium. Am J Physiol. 1992;262:H136–43.
- Wang T, Cheng HH, Heimbürger O, Chen C, Waniewski J, Bergström J, et al. Hyaluronan decreases peritoneal fluid absorption: effect of molecular weight and concentration of hyaluronan. Kidney Int. 1999;55:667–73.
- Stridh S. Regulation of renal hyaluronan in water handling. Studies in vivo and in vitro. In: Digital Comprehensive Summaries of Uppsala Dissertations from the Faculty of Medicine 951, Acta Universitatis Upsaliensis, Uppsala. 2013. p 1–76.
- Yang Y, Wang J, Qin L, Shou Z, Zhao J, Wang H, et al. Rapamycin prevents early steps of the development of diabetic nephropathy in rats. Am J Nephrol. 2007;27:495–502.
- Mori H, Inoki K, Masutani K, Wakabayashi Y, Komai K, Nakagawa R, et al. The mTOR pathway is highly activated in diabetic nephropathy and rapamycin has a strong therapeutic potential. Biochem Biophys Res Commun. 2009;384:471–5.
- Inoki K, Mori H, Wang J, Suzuki T, Hong S, Yoshida S, et al. mTORC1 activation in podocytes is a critical step in the development of diabetic nephropathy in mice. J Clin Invest. 2011;121:2181–96.
- Csóka AB, Scherer SW, Stern R. Expression analysis of six paralogous human hyaluronidase genes clustered on chromosomes 3p21 and 7q31. Genomics. 1999;60:356–61.
- Ikegami-Kawai M, Suzuki A, Karita I, Takahashi T. Increased hyaluronidase activity in the kidney of streptozotocin-induced diabetic rats. J Biochem. 2003;134:875–80.
- Colombaro V, Jadot I, Declèves AE, Voisin V, Giordano L, Habsch I, et al. Lack of hyaluronidases exacerbates renal post-ischemic injury, inflammation, and fibrosis. Kidney Int. 2015. [Epub ahead of print].
- Bardoux P, Ahloulay M, Le Maout S, Bankir L, Trinh-Trang-Tan MM. Aquaporin-2 and urea transporter-A1 are up-regulated in rats with type I diabetes mellitus. Diabetologia. 2001;44:637–45.
- Zerbe RL, Vinicor F, Robertson GL. Regulation of plasma vasopressin in insulin-dependent diabetes mellitus. Am J Physiol. 1985;249:E317–25.
- Brooks DP, Nutting DF, Crofton JT, Share L. Vasopressin in rats with genetic and streptozocin-induced diabetes. Diabetes. 1989;38:54–7.