EFFECTS OF LIGHT AND MELATONIN TREATMENT ON BODY TEMPERATURE AND MELATONIN SECRETION DAILY RHYTHMS IN A DIURNAL RODENT, THE FAT SAND RAT. Chronobiol. Int. 2010; 27(7): 1401–1419.
Chronobiology International hereby notifies its readers that and along with the corresponding legends printed with errors and consequently all previous records must be considered incorrect. The corrected figures and corresponding legends are on the following pages.
FIGURE 2 Body temperature (Tb) 24 h rhythms (left, A-C) and 6-sulphatoxymelatonin (6-SMT) levels (right, D-F) under Control (CON) conditions of 12L:12D, lights were on at 08:00. CON with light interferences of 15 min at ZT17 (LI), Exposure to short photoperiod (SP) of 8L:16D, and after exposure to SP with LI – three times a night, for two weeks (SP-CLI). Black bars on the bottom indicate dark period, gray bars indicate dark period only in the SP or SP-CLI groups (lights were off at 16:00). Wide arrow indicates LI of 30 min, in the LI group, narrow arrows indicate light interference of 15 min, in the SP-CLI group. *indicates significant change (p < 0.05) between demonstrated experimental groups.
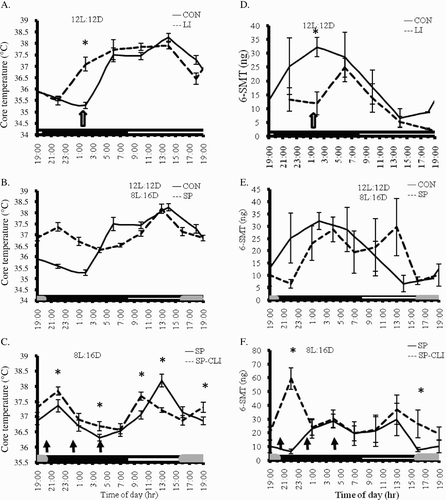
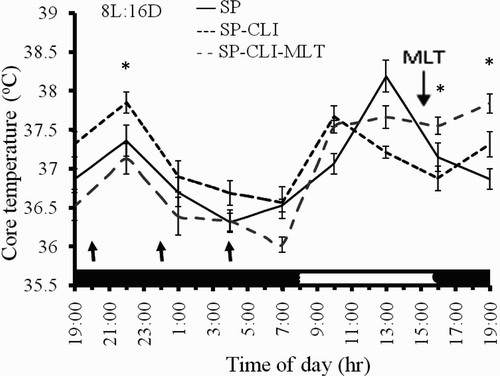
FIGURE 3 Body temperature (Tb) 24 h rhythm after three weeks of acclimation to short photoperiod (SP, 8L:16D, black line), SP with light interference (LI) three times a night for 15 min (SP-CLI, dark dashed grey curve) and SP-CLI with MLT added to the drinking water at the last day (SP-CLI-MLT, dotted light grey curve). Top MLT arrow indicates time of MLT given in the drinking water to SP-CLI-MLT group. Data represents average of eight animals ± S.E.M. measured every three hours.