Abstract
Background. The natural history and the possible changes of celiac disease (CD) prevalence over time are still unclear.
Objectives. 1) To establish whether loss of tolerance to gluten may occur at any age; 2) to investigate possible changes of CD prevalence over time; and 3) to investigate CD-related co-morbidities.
Methods. We analyzed 3,511 subjects with matched samples from 1974 (CLUE I) and 1989 (CLUE II). To avoid a selection bias regarding survival, we also screened 840 CLUE I participants who deceased after the 1974 survey.
Outcome measure. CD autoimmunity (positivity to auto-antibodies) over time.
Results. CD autoimmunity was detected in seven subjects in 1974 (prevalence 1:501) and in an additional nine subjects in 1989 (prevalence 1:219). Two cases of CD autoimmunity were found among the 840 subjects deceased after CLUE I. Compared to controls, untreated CD subjects showed increased incidence of osteoporosis and associated autoimmune disorders, but they did not reach statistical significance.
Conclusions. During a 15-year period CD prevalence increased 2-fold in the CLUE cohort and 5-fold overall in the US since 1974. The CLUE study demonstrated that this increase was due to an increasing number of subjects that lost the immunological tolerance to gluten in their adulthood.
| Abbreviations | ||
| CD | = | celiac disease |
| EMA | = | endomysial antibody |
| HLA | = | human leucocyte antigen |
| tTG | = | tissue transglutaminase |
Key messages
Celiac disease autoimmunity may develop at any age, even in the elderly.
During the past three decades the prevalence of celiac disease increased 5-fold in the US.
Introduction
Celiac disease (CD) is an immune-mediated enteropathy triggered by the ingestion of gluten in genetically susceptible individuals. Gluten is the major protein component of wheat, a staple food widely consumed worldwide, and other cereals (rye and barley). The development of the celiac enteropathy is paralleled by the appearance of serum auto-antibodies, especially the IgA class anti-tissue transglutaminase (anti-tTG) and endomysial antibodies (EMA). These antibodies may be found in subjects who are either symptomless or present with a wide spectrum of clinical problems ranging from classical gastrointestinal symptoms to atypical manifestations. Due to these variable features, many CD cases currently escape diagnosis (Citation1).
Once considered a rare food intolerance condition, CD is now generally classified as a common autoimmune disease (Citation2). Autoimmune diseases are the third most common category of diseases in the United States after cancer and heart disease. They affect approximately 5%–8% of the population, or 14–22 million persons (Citation3). Given the indisputable role of gluten in causing inflammation and autoimmunity, CD represents a unique model of autoimmune disorder in which, in contrast to most other autoimmune diseases, the triggering environmental factor (gluten), a close genetic association with human leucocyte antigen (HLA) genes (DQ2 or DQ8), and a highly specific humoral autoimmune response (auto-antibodies to tissue transglutaminase) are known. Therefore, CD would be an ideal model to study the natural history of autoimmune diseases, provided that follow-up cohort studies are performed. During the past two decades, cross-sectional studies on not-at-risk groups have shown that CD is one of the most common lifelong conditions affecting around 1% of the population in Western countries (Citation4,Citation5). Recent data also indicate a trend to increased prevalence over time both in Europe and the US (Citation6,Citation7).
In order to get more information about the natural history of CD and to investigate further the changes in CD prevalence over time, we tested sera for CD autoimmunity from a cohort of 3,511 subjects that have been followed since 1974.
Patients and methods
The study used blood samples stored as serum and plasma from participants of both CLUE I and CLUE II cohort studies, conducted in Washington County, Maryland in 1974 and 1989, respectively. The name is based on the campaign slogan ‘Give us a clue to cancer and heart disease’ that was used in the recruitment of participants. Beginning in 1996 and every 2–3 years thereafter, participants were sent a follow-up self-administered questionnaire to collect more in-depth health-related information, including health behaviors and medical histories updated to 2007. The CLUE cohorts have been described in detail elsewhere (Citation8). Briefly, CLUE I collected blood samples from August through November in 1974. Trailers were stationed throughout the county, and about one-third of the adult county population participated (n = 20,305). CLUE II was conducted in the summer of 1989 with similar methods to CLUE I. Again, about one-third of the adult population participated (n = 25,380). Participation was best in the age group 35–65 years and better among females than males. Blood was processed centrally, usually within 6 hours of blood collection. Serum was stored in CLUE I and plasma (from heparinized blood) in CLUE II at −70°C.
Altogether 37% (n = 8,394) of the Washington County residents who participated in CLUE II also participated in CLUE I and form the base population for this study. Of the 8,394 subjects with CLUE I–II matched samples, 2,227 had either insufficient serum sample left or no follow-up questionnaire and, therefore, were not screened. Of the remaining 6,167, we randomly selected 3,511 paired sera samples () by using the software Research Randomizer for generation of random numbers. A total of 2,021 of them were still alive in the year 2007. Our CLUE I–II cohort included 2,235 females (63.7%) and 1,276 males (36.3%), with the following age distribution (in 1974): 195 were 13–19; 548 were 20–29; 903 were 30–39; 1,028 were 40–49; 696 were 50–59; 131 were 60–69; 9 were 70–79; and 1 was 80 years or older. The ethnicity was Caucasian (99.3%), African-American (0.6%), and other (0.1%).
Figure 1. The flow chart shows how participants in the CLUE I and CLUE II surveys were selected for inclusion in this study.
To determine if the estimate of CD prevalence in the CLUE I sample could be influenced by survival bias, we also assayed a group of CLUE I sera from participants deceased after CLUE I (n = 840), corresponding to the fraction of deaths observed in the initial cohort (19% between 1974 and 2007).
Study protocol
Sera were first tested for IgA anti-tTG antibodies, and those with borderline or elevated anti-tTG antibodies were subsequently tested for serum IgA class EMA to improve the specificity of the diagnostic process. Samples showing IgA anti-tTG of < 0.5 arbitrary units (AU) were tested for IgG anti-tTG and, if positive, for total serum IgA to rule out selective IgA deficiency, a condition associated with CD (Citation9).
The protocol of this study was approved by the Ethical Committee of the University of Maryland School of Medicine.
Methods
Anti-tTG antibodies were measured using an enzyme-linked immunosorbent assay (ELISA) method based on human recombinant antigen. Values between 5 and 8 AU (IgA antibodies) or 20 and 30 AU (IgG antibodies) were considered borderline, while higher than 8.0 AU (IgA antibodies) or 30 AU (IgG antibodies) were considered positive. IgA EMA was detected by indirect immunofluorescence, using monkey esophagus as the substrate, and values equal to or above a 1:10 dilution were considered as positive. All tests were performed at the Center for Celiac Research, University of Maryland, using commercial assays (IgA anti-tTG: Phadia GmbH, Freiburg, Germany; EMA: Scimedx Corporation, New Jersey, USA; IgG anti-tTG: INOVA Diagnostics Inc., CA, USA).
Case definition
For the purpose of this study, a diagnosis of CD was made in: 1) patients with a positive test for IgA class EMA antibodies and a positive/borderline test for IgA class anti-tTG antibodies; and 2) patients with IgA deficiency (defined as total serum IgA lower than 5 mg/dL) and positivity of IgG anti-tTG antibodies (no such cases were detected; see below).
Associated co-morbidities
Information on participants’ health history included the question ‘Have you ever been told by a doctor or other health professional that you are affected by’ followed by a list of medical conditions (answer yes/no). To establish whether undiagnosed CD was associated with increased co-morbidities, the distribution of selected self-reported conditions that are known to be associated with CD was analyzed. These conditions were osteoporosis and autoimmune disorders (including type 1 diabetes, autoimmune thyroid diseases, and connective tissue disorders). This information was extracted from the health history questionnaires collected between 1996 and 2007. Other medical conditions included in the clinical report (e.g. gout or hypertension) were not considered. For each CD case, five randomly selected not-CD controls matched for gender, age, and number of questionnaires filled were included in the analysis.
Statistical analysis
The data on the prevalence of CD were expressed as proportions and 95% confidence intervals. The association between self-reported conditions in patients with CD and controls was analyzed by Fisher's exact test.
Results
Serology on the 3,511 subjects with CLUE I–CLUE II paired samples
In 1974 (CLUE I) there were 13 IgA anti-tTG positive subjects, of which 3 had borderline results (). Seven of the 13 IgA anti-tTG-positive/borderline subjects were also positive at the IgA EMA testing ( and , cases 1–7). Six of these seven subjects remained positive for both IgA anti-tTG and IgA EMA in 1989 (CLUE II), while one subject (, case 6) became negative because he was diagnosed with CD between CLUE I and CLUE II and, therefore, went on a gluten-free diet (, solid line). In CLUE II another nine cases who were negative at CLUE I became both anti-tTG and EMA-positive ( and , cases 8–16). Therefore, while 16 subjects fulfilled the criteria of CD autoimmunity definition, only 15 tested positive at CLUE II.
Table IA. Demographic and clinical data of subjects receiving a diagnosis of CD in the CLUE 1 and/or CLUE 2 studies.
Figure 2. Results of the celiac screening of the 3,511 matched participating subjects. *Only 15 of the 16 CD autoimmunity subjects tested EMA-positive at CLUE II as 1 subject was on a gluten-free diet (, case 6).
Figure 3. A: IgA anti-tTG levels in CD cases participating in CLUE I (1974) and CLUE II (1989) studies. One subject with high IgA anti-tTG only at CLUE I (, case 6) was diagnosed with CD between CLUE I and CLUE II, and was on a gluten-free diet at CLUE II (solid line). B: Antibody levels in not-CD subjects with isolated IgA anti-tTG positivity at CLUE I (1974) and/or CLUE II (1989). Borderline and abnormal values are inside and above the dotted band, respectively. AU = arbitrary units.
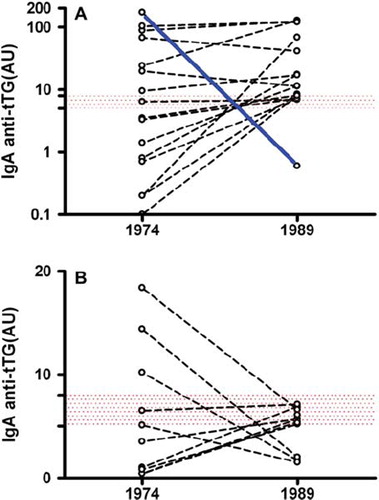
Of the six IgA anti-tTG-positive/borderline and EMA-negative subjects at CLUE I, five became anti-tTG-IgA-negative/borderline and remained EMA-negative at CLUE II, while one seroconverted to positive EMA (, case 8). Finally, five subjects (constantly EMA-negative) that tested IgA anti-tTG-negative at CLUE I became IgA anti-tTG borderline at CLUE II. shows the dynamic changes of IgA anti-tTG antibodies in subjects with at least one positive/borderline determination eventually considered as either CD-affected (3A) or not affected (). A total of 1,125 subjects with very low levels of IgA anti-tTG were screened for IgG anti-tTG antibodies. Six subjects had positive IgG anti-tTG but normal total IgA levels and, therefore, did not meet the CD diagnostic criteria ().
Serology on the 840 subjects that deceased after CLUE I
Among the 840 subjects that deceased after CLUE I, 2 tested positive for both IgA anti-tTG antibodies and EMA ( and ), suggesting that both were affected by CD. Interestingly, one of these two subjects (case 1b) died of jejunal cancer, a neoplasm that is strongly associated with CD.
Table IB. Demographic and clinical data of subjects with a CD serology at CLUE I that deceased before CLUE II.
Figure 4. Results of the celiac screening in 840 participants that deceased after the CLUE I study.
CD cases identified in the CLUE cohort
At the time of the CLUE I study there was no case of diagnosed CD in our study group. Our data showed that a total of 18 subjects fulfilled the criteria of CD diagnosis. Of these 18 CD cases, 16 were among the 3,511 subjects with CLUE I–CLUE II paired samples (12 female and 4 males, average age at CLUE I, 37.2 years, range 14–60). Seven out of 16 cases had a positive serology already on CLUE I evaluation (, cases 1–7). The other nine cases apparently developed CD between CLUE I and CLUE II (, cases 8–16), their first CD serology result being normal (except case 8, showing a low level of isolated anti-tTG-IgA positivity at CLUE I). Remarkably, two of these nine cases with ‘late-onset’ CD were already in their sixth decade (cases 10 and 13) when first examined at CLUE I. The remaining two CD cases (both female, average age at CLUE I, 46.5 years) tested positive at CLUE I but deceased before the CLUE II follow-up (). Only 2 of the 18 CD cases were clinically diagnosed with CD: case 3 after CLUE II and case 6 between CLUE I and CLUE II (). Therefore, in this cohort CD was clinically diagnosed only in 11% of the affected cases.
Prevalence of CD
The prevalence of CD in the study group, as determined by our serological screening, was 0.21% (95% CI 0.072–0.34) in 1974 and 0.45% (95% CI 0.24–0.66) in 1989. The trend of an increasing prevalence of CD in the USA during these last decades is clearly shown in , which, by comparison, also shows the prevalence of CD in a different cohort of 2,845 not-at-risk American subjects that we studied in 2001 (12 years after CLUE II) (Citation4). The gender, age, and ethnical distribution of these 2,845 subjects was not statistically different from that of CLUE I participants.
Figure 5. Prevalence (and 95% CI) of CD in the US during the last decades. *Data for the year 2001 are taken from Fasano et al. (Citation4).
Incidence of CD
During the 15-year-period between CLUE I and CLUE II only 1 case of CD was clinically detected (, case 6) in this sample of 3,511 American adults. The incidence (number of diagnosed cases/thousand/year) of CD in this cohort was therefore very low (0.02).
Self-reported medical conditions
The duration of follow-up (mean ± SD) was 31.1 ± 3.5 years in patients with CD and 29.6 ± 3.8 years in controls. Eleven out of 14 CD patients returned all the questionnaires (the last in the year 2007). The body mass index (BMI) (mean ± SE) in 1989 was 29.1 ± 1.6 in CD patients and 29.7 ± 0.9 in controls. Untreated CD was associated with a 2.6-fold increase in autoimmune co-morbidity and a 1.6-fold increase in osteoporosis; however, these differences did not reach statistical significance (P = 0.09 and P = 0.12, respectively).
Discussion
In our study, detection of CD was based on serological criteria only. Although the small intestinal biopsy has an indisputable diagnostic role in the clinical setting (Citation10), this investigation is not an essential requirement for an epidemiological survey. The serum IgA anti-tTG test was used for first-level screening of CD because it is an accurate, easy-to-perform, and operator-independent test (Citation11). To increase the specificity of the diagnostic process we restricted the diagnosis of CD to those positive to both anti-tTG and EMA, because there is evidence in the literature suggesting a higher positive predictive value of the EMA as compared with the anti-tTG test (Citation12). The possibility of a falsely positive result of both IgA anti-tTG and EMA is almost non-existent (Citation13,Citation14), as it is well established that even the occasional subject with IgA anti-tTG and EMA positivity and a normal small bowel architecture tends to develop a fully expressed celiac enteropathy over time (so-called potential CD) (Citation15,Citation16).
During the period under investigation (1974–1989) the incidence of clinically detected CD in our population sample was very low (0.02/thousand/year) compared with recent figures (e.g. 0.8/thousand/year in Finland during the years 2002–2005) (Citation17), a finding that is easily explained by poor awareness of this condition in the US at the time the CLUE studies were performed. On the other hand, our serological screening detected many undiagnosed CD cases in the CLUE I (n = 9) and many more in the CLUE II sera (n = 15). So far an age-related increase in the prevalence of celiac autoimmunity had mostly been observed in children (Citation18), particularly those at increased CD risk, e.g. subjects with a family history of CD or type 1 diabetes (Citation19–22). By investigating the same group of individuals at two different time points 15 years apart, we here demonstrate that loss of gluten tolerance may conversely occur at any time in life, for reasons that are currently unclear. This new finding has important clinical and epidemiological implications for CD, since available epidemiological studies on children and young adults may underestimate the true overall prevalence of the disease. Indeed, cases 10 and 13 that were negative to CD serology in their early 50s and positive in their late 60s () would have been lost at a routine screening, even in adulthood. Interestingly, a Finnish study reported that the prevalence of CD in elderly people was higher (2.45%) than the general population (Citation23).
Recent reports suggested that the prevalence of CD in Western countries has been increasing during the past few decades. Rubio-Tapia et al. found in adult American men a CD serology positive prevalence of 0.2% in a cohort enrolled between 1948 and 1954 and ∼0.9%–1% in a different cohort enrolled recently (Citation7). The same trend has been noted in Finland, where the overall prevalence of CD in two different population-based samples increased from 1.05% in 1978–1980 to 1.99% in 2000–2001 (Citation6). Our study confirmed these findings, as CD autoimmunity within an American population sample doubled between 1974 (1 every 501 subjects) and 1989 (1 every 219 subjects). This trend apparently continued in the following years, as we reported a CD prevalence of 1:105 in the year 2001 in a different sample of the adult American population (). During the last 30 years the prevalence of CD among adults in the US increased 5-fold, doubling approximately every 15 years.
A steady rise in the incidence of autoimmune diseases has been observed in industrialized countries over the last few decades. According to the hygiene hypothesis, an early childhood infection or the establishment of mixed intestinal microbiota could down-regulate immunity and suppress different autoimmune disorders (Citation24). However, the rising prevalence of adulthood onset of CD that we observed in our study can hardly be explained by hygienic changes occurring in childhood. The amount and the quality of ingested gluten, type and duration of wheat dough fermentation, the spectrum of intestinal microbiota and its changes over time, enteric infections, and stressors in general are all possible switches of the tolerance/immune response balance (Citation25–27). However, further studies are required to clarify the relevance of these factors in causing loss of gluten tolerance.
In our study there were 12 no-CD subjects with either a fluctuating serology result, i.e. a low-level positivity of IgA anti-tTG at CLUE I reverting to normal value at CLUE II (5 cases) or vice versa (5 cases), or a constantly borderline IgA anti-tTG positivity (2 cases). All of them were EMA antibody-negative at both CLUE I and CLUE II determinations. An isolated low-level positivity of IgA anti-tTG is not always a marker of active CD (Citation28). Prospective studies reported that CD-associated antibodies, usually at low titer, may emerge, disappear, and re-emerge over time in the absence of a clear-cut CD enteropathy at the small intestinal biopsy (Citation29). Factors other than exposure to gluten may contribute to the development of CD-associated auto-antibodies, e.g. an unspecific response to other environmental factors (e.g. infection with Epstein-Barr (EB) virus) (Citation30).
Even though a detailed analysis of morbidity associated with untreated CD was beyond the scope and possibility of this work, particularly due to the self-reported nature of clinical problems in the follow-up questionnaires, some clinical findings deserve a comment. One of the 9 patients that were already affected by CD at CLUE I (1974), but none among the not-CD-affected 3,495 participants, died of a primary small intestinal cancer, a rare tumor that is strongly associated with untreated CD (Citation31). We suspect a causal relationship between untreated CD and cancer in this case. As far as other co-morbidities, no significant difference was detected between undiagnosed CD cases and controls, a finding that is in line with previous reports (Citation32). However, our CD patients reported more autoimmune disorders and osteoporosis than did age- and gender-matched controls. While the association between CD and other autoimmune disorders is probably related to a common genetic background (Citation2), bone density could well be negatively influenced by coexisting active CD in these patients.
We are aware of the possible weaknesses of this study: 1) Our volunteer sample was not fully representative of the general population, particularly due to lack of children and over-representation of women (64%). As CD is more common in females (Citation1), the estimation of disease prevalence may be slightly overestimated in our study. 2) Since patients were investigated retrospectively, the diagnosis of CD could not be confirmed by the small intestinal biopsy, therefore no information is available on the degree of small intestinal damage in our subjects. 3) The risk of CD-associated disorders could not be evaluated accurately, given that diagnoses were self-reported and could not be checked on clinical records.
In conclusion, we provide evidence that CD autoimmunity may develop at any age, even in the elderly. The sharp increase of CD prevalence observed in the US between the time window investigated in this study (1974–1989) and current time was apparently related to an increasing number of subjects that, in their adulthood, lost the immunological tolerance to gluten. The reasons for these changes are not clear but should be investigated among the many environmental factors favoring CD development. Understanding this epidemiological trend would pave the way to rational forms of primary prevention for CD and, possibly, for other autoimmune diseases.
Acknowledgments
This paper was partially supported by the Center for Celiac Research, University of Maryland School of Medicine, Baltimore, MD, USA, Quest Diagnostics Incorporated, San Juan Capistrano, CA, USA, Phadia GmbH, Freiburg, Germany, Schär USA Inc., Lyndhurst, NJ, USA, and BioDiagene, Palermo, Italy.
Declaration of interest: C. Catassi has received research grants and honorariums from the following companies: Schär Italy, Meran, Italy, and A. Menarini Diagnostics, Florence, Italy. A. Fasano has received research grants and honorariums from Quest Diagnostics Incorporated, San Juan Capistrano, CA, USA, Phadia GmbH, Freiburg, Germany, Schär USA Inc., Lyndhurst, NJ, USA, and BioDiagene, Palermo, Italy, and has stock options in Alba Therapeutics Corporation. The remaining authors declare no conflicts of interest.
Related Research Data
References
- Fasano A, Catassi C. Current approaches to diagnosis and treatment of celiac disease: an evolving spectrum. Gastroenterology. 2001;120:636–51.
- Barton SH, Murray JA. Celiac disease and autoimmunity in the gut and elsewhere. Gastroenterol Clin North Am. 2008;37:411–28.
- Health, NIo 2003. Autoimmune Disease Research Plan. Available at: http://www.niaid.nih.gov/dait/pdf/ADCCReport.pdf. Date accessed: April 2, 2010
- Fasano A, Berti I, Gerarduzzi T, Not T, Colletti RB, Drago S, . Prevalence of celiac disease in at-risk and not-at-risk groups in the United States: a large multicenter study. Arch Intern Med. 2003;163:286–92.
- Catassi C, Rätsch IM, Fabiani E, Rossini M, Bordicchia F, Candela F, . Coeliac disease in the year 2000: exploring the iceberg. Lancet. 1994;343:200–3.
- Lohi S, Mustalahti K, Kaukinen K, Laurila K, Collin P, Rissanen H, . Increasing prevalence of coeliac disease over time. Aliment Pharmacol Ther. 2007;26:1217–25.
- Rubio-Tapia A, Kyle RA, Kaplan EL, Johnson DR, Page W, Erdtmann F, . Increased Prevalence and Mortality in Undiagnosed Celiac Disease. Gastroenterology. 2009;137:88–93.
- Helzlsouer KJ, Alberg AJ, Huang HY, Hoffman SC, Strickland PT, Brock JW, . Serum concentrations of organochlorine compounds and the subsequent development of breast cancer. Cancer Epidemiol Biomarkers Prev. 1999;8:525–32.
- Fernandez E, Blanco C, Garcia S, Dieguez A, Riestra S, Rodrigo L. Use of low concentrations of human IgA anti-tissue transglutaminase to rule out selective IgA deficiency in patients with suspected celiac disease. Clin Chem. 2005;51:1014–6.
- AGA Institute. AGA Institute medical position statement on the diagnosis and management of celiac disease. Gastroenterology. 2006;131:1977–80.
- Rostom A, Dubé C, Cranney A, Saloojee N, Sy R, Garritty C, . The diagnostic accuracy of serological tests for celiac disease: a systematic review. Gastroenterology. 2005;128(4 Suppl 1):S38–46.
- Baudon JJ, Johanet C, Absalon YB, Morgant G, Cabrol S, Mougenot JF. Diagnosing celiac disease: a comparison of human tissue transglutaminase antibodies with antigliadin and antiendomysium antibodies. Arch Pediatr Adolesc Med. 2004;158:584–8.
- Hopper AD, Hadjivassiliou M, Hurlstone DP, Lobo AJ, McAlindon ME, Egner W, . What is the role of serologic testing in celiac disease? A prospective, biopsy-confirmed study with economic analysis. Clin Gastroenterol Hepatol. 2008;6:314–20.
- Hadithi M, von Blomberg BM, Crusius JB, Bloemena E, Kostense PJ, Meijer JW, . Accuracy of serologic tests and HLA-DQ typing for diagnosing celiac disease. Ann Intern Med. 2007;147:294–302.
- Paparo F, Petrone E, Tosco A, Maglio M, Borrelli M, Salvati VM, . Clinical, HLA, and small bowel immunohistochemical features of children with positive antiendomysium antibodies and architecturally normal small intestinal mucosa. Am J Gastroenterol. 2005;100:2294–8.
- Kaukinen K, Collin P, Mäki M. Latent coeliac disease or coeliac disease beyond atrophy? Gut. 2007;56: 1339–40.
- Vilppula A, Kaukinen K, Luostarinen L, Krekelä I, Patrikainen H, Valve R, . Increasing prevalence and high incidence of celiac disease in elderly people: a population-based study. BMC Gastroenterol. 2009;9:49.
- Olsson C, Hernell O, Hörnell A, Lönnberg G, Ivarsson A. Difference in celiac disease risk between Swedish birth cohorts suggests an opportunity for primary prevention. Pediatrics. 2008;122:528–34.
- Goldberg D, Kryszak D, Fasano A, Green PH. Screening for celiac disease in family members: is follow-up testing necessary? Dig Dis Sci. 2007;52:1082–6.
- Barera G, Bonfanti R, Viscardi M, Bazzigaluppi E, Calori G, Meschi F, . Occurrence of celiac disease after onset of type 1 diabetes: a 6-year prospective longitudinal study. Pediatrics. 2002;109:833–8.
- Norris JM, Barriga K, Hoffenberg EJ, Taki I, Miao D, Haas JE, . Risk of celiac disease autoimmunity and timing of gluten introduction in the diet of infants at increased risk of disease. JAMA. 2005;293:2343–51.
- Simell S, Kupila A, Hoppu S, Hekkala A, Simell T, Stählberg MR, . Natural history of transglutaminase autoantibodies and mucosal changes in children carrying HLA-conferred celiac disease susceptibility. Scand J Gastroenterol. 2005; 40:1182–91.
- Vilppula A, Collin P, Mäki M, Valve R, Luostarinen M, Krekelä I, . Undetected coeliac disease in the elderly: a biopsy-proven population-based study. Dig Liver Dis. 2008;40:809–13.
- Bach JF. The effect of infections on susceptibility to autoimmune and allergic diseases. N Engl J Med. 2002;347:911–20.
- Ivarsson A, Persson LA, Nyström L, Ascher H, Cavell B, Danielsson L, . Epidemic of coeliac disease in Swedish children. Acta Paediatr. 2000;89:165–71.
- Gobbetti M, Rizzello GM, Di Cagno R, De Angelis M. Sourdough lactobacilli and celiac disease. Food Microbiol. 2007; 24:187–96.
- Zanoni G, Navone R, Lunari C, Tridente G, Bason C, Sivori S, . In celiac disease, a subset of autoantibodies against transglutaminase binds toll-like receptor 4 and induces activation of monocytes. PLoS Med. 2006;3:e358.
- Hill PG, Holmes GK. Coeliac disease: a biopsy is not always necessary for diagnosis. Aliment Pharmacol Ther. 2008; 27:572–7.
- Simell S, Hoppu S, Hekkala A, Simell T, Ståhlberg ML, Viander M, . Fate of five celiac disease associated antibodies during normal diet in genetically at-risk children observed from birth in a natural history study. Am J Gastroenterol. 2007;102:2026–35.
- Ferrara F, Quaglia S, Caputo I, Esposito C, Lepretti M, Pastore S, . Anti-transglutaminase antibodies in non-coeliac children suffering from infectious diseases. Clin Exp Immunol. 2009;159:217–23.
- Catassi C, Bearzi I, Holmes GK. Association of celiac disease and intestinal lymphoma and other cancers. Gastroenterology. 2005;128(4 Suppl 1):S79–86.
- Viljamaa M, Kaukinen K, Huhtala H, Kirönpalo S, Rasmussen M, Collin P. Coeliac disease, autoimmune diseases and gluten exposure. Scand J Gastroenterol. 2005;40:437–43.