Abstract
Introduction. Early identification of those at risk of developing type 2 diabetes (T2DM) is essential. We examined how normoglycemic levels of fasting blood glucose (FBG) and 1-hour glucose predict the development of diabetes among men initially at low risk.
Methods. In the Helsinki Businessmen Study (men born in 1919– 1934), 1,145 men had normal FBG (< 5.0 mmol/L) in 1974, and 1-hour glucose values available. Multivariate, adjusted models were used to investigate how fasting and 1-hour glucose at baseline related to new-onset diabetes during a follow-up of 34 years.
Results. The median FBG and 1-hour glucose values at baseline were 4.4 and 6.6 mmol/L, respectively. During follow-up, 108 men developed diabetes. The risk of incident diabetes was doubled for the highest quintile of FBG (fully adjusted relative risk (RR) 2.22, 95% confidence interval (CI) 1.10–4.50), and quadrupled for that of 1-hour glucose (RR 4.23, 95% CI 2.49–7.17). FBG could not separate the risk for those with higher levels of glucose in the range < 5.0 mmol/L, whereas 1-hour glucose discriminated the risk better at higher values.
Conclusions. Higher values in the normoglycemic range for both fasting and 1-hour glucose predicted long-term incidence of diabetes in healthy middle-aged men.
Key messages
Middle-aged men with fasting blood glucose below 4.0 mmol/L (equivalent plasma glucose 4.5 mmol/L) carry little risk for future diabetes.
One-hour blood glucose values > 7.0 mmol/L (equivalent plasma glucose 7.8 mmol/L) in midlife could be regarded as a cut-off point for future risk for incident diabetes.
Introduction
Fasting plasma glucose (FPG) and the 2-hour oral glucose tolerance test (OGTT) are recommended for screening of type 2 diabetes (Citation1). Both are useful, because they reflect different pathophysiologic mechanisms (Citation2); those with normal fasting glucose may have hyperglycemia during OGTT, and vice versa (Citation3). During the 2-hour OGTT, also the 1-hour glucose value is usually recorded, but it is generally not used for clinical purposes. This is mainly because its significance has not been widely studied and there are no established cut-off values for risk. However, the few existing studies have shown 1-hour post-load glucose to be a strong predictor of incident diabetes (Citation4,Citation5) and to reflect cardiovascular disease (Citation6,Citation7) and inflammation (Citation8). One-hour glucose values were also associated with increased carotid intima thickness in prediabetic patients, whereas the correlation with fasting glucose was non-significant (Citation9).
In 2003, the American Diabetes Association (ADA) lowered the threshold for normal FPG to less than 5.55 mmol/L. Although this originally met with much controversy (Citation10), subsequent studies have demonstrated that still lower fasting glucose may implicate less risk for incident diabetes (Citation11,Citation12).
Here, we sought to compare the value of fasting and 1-hour post-load glucose in predicting diabetes risk in an originally fasting normoglycemic (fasting blood glucose (FBG) < 5.0 mmol/L) male cohort during a follow-up of 34 years.
Methods
This report is part of the Helsinki Businessmen Study, a longitudinal study of originally 3,490 healthy Finnish businessmen born 1919–1934 (Citation4,Citation13). All participants were Caucasian men of high socio-economic status with similar job positions. The cohort is being followed up from the 1960s to study the health effects of cardiovascular risk factors during the long term, offering an opportunity to examine the development of diabetes among normoglycemic men from midlife to old age. For this purpose we identified those 1,145 men who in 1974 were normoglycemic in the fasting state (FBG < 5.0 mmol/L, equivalent to plasma glucose < 5.6 mmol/L), and for whom also 1-hour post-load glucose values were available at baseline.
Baseline examinations in 1974 included measurements of weight and height (BMI calculated as weight (kilograms) divided by height (meters) squared), blood pressure (BP), and serum lipid levels. Smoking habits and alcohol consumption (grams/week) were assessed with questionnaires. Family history of diabetes was not available.
Blood glucose (mmol/L) was measured following an overnight fast of 12 hours as well as 60 minutes after an oral load of 1 g of glucose per kg of body weight. At the time this was standard procedure in Finland (Citation14), thus differing from the standard glucose load of 75 grams recommended by the present guidelines. The mean amount of glucose per person was 80.5 g (SD 9.8 g).
The glucose concentrations were measured from whole blood according to the method of Hultman (Citation15) and were analysed immediately after having been drawn. Because glucose measures differ between whole blood and plasma, we present the equivalent plasma values using a correction factor of 1.12 (Citation16).
Development of diabetes was the primary study end-point, and it was ascertained through registers and questionnaires up to 31 December 2007. In Finland, all individuals requiring prescription medication for diabetes are entitled to reimbursement. This requires a detailed medical certificate from the attending physician, and the Social Insurance Institution of Finland (KELA) checks that the case fulfils the criteria for diabetes and maintains a register of these cases. The participants of the Helsinki Businessmen Study have been linked to this register through the unique personal identity code assigned to each Finnish citizen.
Five mailed questionnaire surveys were performed between 1985 and 2007; the response rate in 2007 was 69%. In addition to the 75 cases verified by the register, the questionnaires identified 33 men who reported receiving medication for diabetes, or having physician-diagnosed, diet-treated diabetes. For these cases, the date of incident diabetes was defined as the date of the questionnaire where it was first reported.
The study procedures have been approved by the Ethics Committee of the Department of Medicine, University of Helsinki.
Statistical methods
NCSS software was used for the analyses (NCSS Statistical Software, Kaysville, UT; www.ncss.com); two-tailed tests were used, and P values < 0.05 were considered significant. In the analyses both fasting and 1-hour post-load glucose values were divided into quintiles. Analysis of covariance (ANCOVA) was used to compare continuous variables, and chi-square and trend tests to compare proportions. Differences in the development of diabetes were analysed using Kaplan–Meier curves and log rank tests. Before 2007, cases were censored at the time of diabetes diagnosis, or death. Cox's proportional hazards regression was used to calculate adjusted RR with their 95% CI.
Results
At baseline in 1974 the mean age of the cohort was 47.8 (SD 4) years. The median of FBG was 4.4 (interquartile (IQ) range 4.2–4.7) mmol/L, and 6.6 (IQ 5.5–7.8) mmol/L for 1-hour glucose. Altogether 33% (n = 377) of the men were current smokers and 36% (n = 412) former smokers. Their mean cholesterol was 6.2 (SD 1.1) mmol/L and the median of triglycerides 1.4 (IQ 1.0–1.8) mmol/L, mean BP was 143.1/91.0 (SD 19.6/11.6) mmHg, and mean BMI 25.7 (SD 2.7) kg/m2.
At end of follow-up in 2007 the mean age of the surviving participants (n = 689) was 80.7 (SD 4) years. The total follow-up time was up to 34 years, providing 38,930 person-years for analysis. During that time 108 incident cases of diabetes developed. The unadjusted cumulative incidences of diabetes among the quintiles of fasting glucose and 1-hour glucose are in and , respectively. The curves suggest clearly varying power of these two glucose variables to predict the development of diabetes. The RRs (with 95% CI) of various quintiles, adjusted for age, smoking, and BMI, with the lowest quintile as referent, are shown in .
Figure 1. Cumulative incidence of diabetes during 34 years of follow- up according to baseline fasting blood glucose in 1974. Unadjusted.
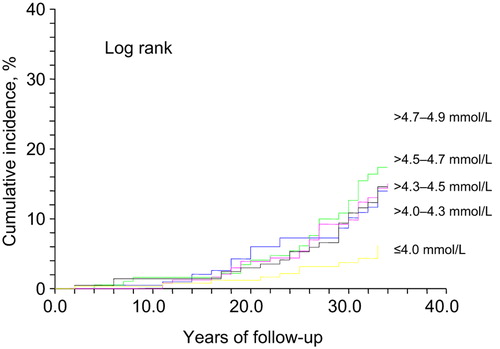
Figure 2. Cumulative incidence of diabetes during 34 years of follow- up according to baseline 1-hour post-load glucose in 1974. Unadjusted.
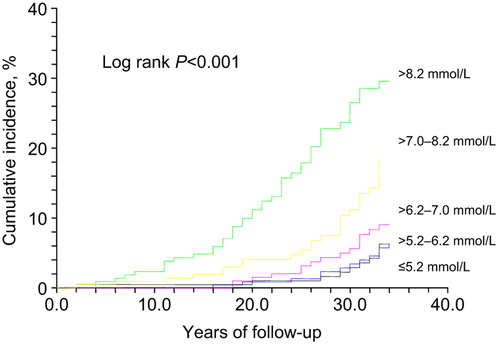
Table I. Risk ratios for type 2 diabetes among 1,145 men during 34 years of follow-up according to quintiles of normal fasting glucose and 1-hour post-load glucose in 1974.
Among the quintiles of FBG (below 5.0 mmol/L), the lowest quintile (≤ 4.0 mmol/L) was associated with the lowest (4.9%) risk of diabetes. In the higher quintiles, RRs were greater, but fairly comparable ranging from 1.9 to 2.2.
For the lowest 1-hour post-load glucose quintile the incidence of new diabetes was similar to that of the lowest quintile of fasting glucose, 4.7%. The RR did not significantly differ from the referent in the second and third quintiles (≤ 7.0 mmol/L), but rose to 2.8- to 4.2-fold for the highest quintiles.
As 33 of the total of 108 incident diabetes cases were identified via self-report, we also analysed the results separately for the 78 cases confirmed by registers, presented in . In spite of less statistical power, these results do not change the conclusions of the study.
Discussion
Our long-term study of middle-aged men who were healthy at baseline indicates that even in the fasting normoglycemic range (FBG below 5.0 mmol/L, equivalent to FPG below 5.6 mmol/L) lower levels are associated with a lower risk of subsequent diabetes. Furthermore, measuring also 1-hour glucose values improved the prediction of development of diabetes during the 34 years of follow-up, albeit in a skewed and different manner: Low–normal fasting glucose (≤ 4.0 mmol/L) showed a protective effect compared to the mid–high normal range (> 4.0–4.9 mmol/L), while 1-hour glucose levels predicted diabetes more strongly in the highest quintile.
An earlier study among young army personnel, adjusting widely for risk factors, demonstrated a progressively increasing risk for diabetes above fasting plasma levels of 4.8 mmol/L compared to levels below 4.5 mmol/L during a follow-up of 6 years (Citation11). The RR of 1.8 was similar to our finding in the same glucose category. In another study of 7 years’ duration, persons with normal FPG levels, 5.3–5.5 mmol/L, had a 2.3-fold risk for developing diabetes compared to those with FPG below 4.7 mmol/L (Citation12). However, in those studies, participants with impaired glucose tolerance were not identified, because no OGTT was performed. It is considered that fasting glucose and OGTT do not identify the same subjects at increased risk (Citation17,Citation18), and this is also suggested by our findings. On the other hand, in two studies the 2-hour glucose did not improve the prediction of diabetes over FPG, BMI, or family history (Citation19,Citation20). Compared to these studies, the baseline fasting glucose values among our subjects are clearly lower and the follow-up time much longer.
It must be emphasized that our study population had a very low diabetes risk at baseline. Few were obese and all had FBG values below 5.0 mmol/L. Also their mean 1-hour glucose value was below 7 mmol/L. Additionally, they belong to the highest socio-economic strata. Yet during the exceptionally long follow-up of 34 years, 9.4% of the whole cohort developed diabetes. The seemingly low risk at baseline highlights the importance of early identification of those at risk of diabetes with advancing age.
Studies have shown that only up to half of those with impaired glucose tolerance (IGT) develop diabetes (Citation21,Citation22). However, the follow-up time in these studies was ‘only’ one or two decades. The Kaplan–Meier curves in and show that the incidence of diabetes does not start to increase more steeply until after 15 to 20 years of follow-up. The incidence then accelerates even during the last years of follow-up, at the mean age of 81. The development of diabetes is postponed by approximately 12 years for the lowest blood glucose category of ≤ 4.0 mmol/L compared to > 4.7–4.9 mmol/L. The men with the arithmetic mean of baseline fasting and 1-hour glucose value below 4.8 mmol/L had practically no risk for diabetes during their adult life.
In addition to being somewhat less time-consuming for the patient and the laboratory personnel, 1-hour post-load glucose values may offer information beyond fasting and 2-hour values. Although glucose values following a meal are not identical to those after a standard glucose load, post-load glucose values may help to evaluate the effects of postprandial glucose spikes. One recent study showed that postprandial glucose surge peaks within 1 hour after eating, suggesting that 1-hour glucose could serve as a marker to define postprandial hyperglycemia (Citation23). An analysis of the RISC study, which identified those with high (> 8.95 mmol/L) 1-hour glucose, but normal 2-hour glucose values, also suggests that 1-hour glucose could reveal those with greater insulin resistance (Citation24). In sum, measuring 1-hour glucose may give important information about glucose metabolism, but at present no official cut-off values are available for 1-hour glucose levels. Furthermore, it is not ascertained that interventions aimed at 1-hour hyperglycemia would be beneficial.
Recently, ADA has accepted HbA1C as a part of the diagnostic criteria for diabetes (Citation1). As it is easy to measure, HbA1C could serve as a simple test for detecting those at risk of diabetes and its complications. Long-term prospective studies are few, but emerging data suggest that HbA1C values predict diabetes even in the normal range below 6.0% (Citation25), and combining HbA1C and fasting glucose improves this prediction (Citation26). However, Olson et al. found the accuracy of the proposed HbA1C criteria for identifying prediabetes low and suggest the 1-hour OGTT for screening (Citation27). HbA1C measurements were not available in our long-term study, but it would be interesting to compare the predictive value of fasting, 1-hour glucose, and HbA1C in the same study.
Limitations
Our study has several limitations. While the homogeneous nature of our cohort is beneficial because it diminishes the important bias related to socio-economic status (Citation28), this homogeneity also seriously restricts the generalization of our results, especially for women. The development of diabetes may genetically vary between the sexes, and sex hormones may modify body fat distribution. Furthermore, glucose absorption may differ between genders during OGTT, with women having a slower absorption rate (Citation29). However, differences in glucose tolerance may partly be due to different body size and muscle mass, since both sexes are given the same amount of glucose during OGTT (Citation30). On the other hand, in the present study the glucose dose was given according to body weight.
The especially long follow-up time may also have its downside: The methods of measurement as well as the criteria for the diagnosis of diabetes have changed during this time. Furthermore, in a longitudinal study of this duration, missing data related to mortality should be taken into account. We do not know how many men who died for other causes during follow-up would have developed diabetes. Moreover, in a long-term study such as the present one, it is also possible that with advancing age and co-morbidities diabetes may remain undiagnosed, untreated, or unreported.
Part of the diabetes assessment was based on self-report, which may be unreliable. In addition, with a response rate of 69%, some cases of diabetes may have been left unreported. However, the majority of diagnoses were gathered from registers, and—although left with less statistical power—the exclusion of self-reported diabetes did not change the conclusions of our study.
We had only a single sample of fasting and 1-hour glucose at baseline, while there could have been inconsistency among repeated measurements (Citation31). This may diminish the accuracy of the original range of glucose concentrations for the quintiles, especially as the diabetes incidence overall was small. On the other hand, it is remarkable that a single measurement in middle age predicted diabetes so well in our healthy cohort. This also may be explained by the unusually long follow-up time.
Finally, it is also possible that the participants’ lifestyle and body weight may have changed during the long follow-up, affecting their predisposition to diabetes.
In summary, our long-term results demonstrate that even normal values of fasting and 1-hour glucose predict the development of diabetes at a very early stage in a population initially at low risk.
Acknowledgements
A.Y.S. and T.P. analysed and interpreted data, drafted the manuscript, and critically revised the manuscript; K.H.P., R.S.T., and V.S. analysed and interpreted data, and critically revised the manuscript; T.E.S. developed the study design, acquired data, carried out the statistical analysis, analysed and interpreted data, and critically revised the manuscript. The authors report no potential conflicts of interest relevant to this article.
Professor Tatu A. Miettinen initiated the Helsinki Businessmen Study and was involved also in the design of this manuscript. Sadly, he passed away on 30 November 2011.
We are indebted to the participants of the Helsinki Businessmen Study, whose dedication has made this study possible.
Declaration of interest: This research was funded by the Jahnsson Foundation, the University Central Hospitals of Oulu and Helsinki (EVO funding), and the Konung Gustaf V:s och Drottning Victorias Frimurarestiftelse.
The funding sources had no role in the design and conduct of the study; in the collection, analysis, and interpretation of the data; or in the preparation, review, or approval of the manuscript.
References
- American Diabetes Association. Diagnosis and classification of diabetes mellitus. Diabetes Care. 2010;33(Suppl 1):S62–9.
- Nathan DM, Davidson MB, DeFronzo RA, Heine RJ, Henry RR, Pratley R, et al. Impaired fasting glucose and impaired glucose tolerance: implications for care. Diabetes Care. 2007;30:753–9.
- Levitan EB, Song Y, Ford ES, Liu S. Is nondiabetic hyperglycemia a risk factor for cardiovascular disease? A meta-analysis of prospective studies. Arch Intern Med. 2004;164:2147–55.
- Strandberg TE, Pienimäki T, Strandberg AY, Salomaa VV, Pitkala KH, Tilvis RS, et al. One-hour glucose, mortality, and risk of diabetes: a 44-year prospective study in men. Arch Intern Med. 2011;171:941–3.
- Abdul-Ghani MA, Lyssenko V, Tuomi T, Defronzo RA, Groop L. Fasting versus post-load plasma glucose concentration and the risk for future type 2 diabetes: results from The Botnia Study. Diabetes Care. 2009;32:281–6.
- Orencia AJ, Daviglus ML, Dyer AR, Walsh M, Greenland P, Stamler J. One-hour postload plasma glucose and risks of fatal coronary heart disease and stroke among nondiabetic men and women: the Chicago Heart Association Detection Project in Industry (CHA) Study. J Clin Epidemiol. 1997;50:1369–76.
- Succurro E, Marini MA, Arturi F, Grembiale A, Lugarà M, Andreozzi F, et al. Elevated one-hour post-load plasma glucose levels identifies subjects with normal glucose tolerance but early carotid atherosclerosis. Atherosclerosis. 2009;207:245–9.
- Bardini G, Dicembrini I, Cresci B, Rotella CM. Inflammation markers and metabolic characteristics of subjects with 1-h plasma glucose levels. Diabetes Care. 2010;33:411–3.
- Temelkova-Kurktschiev TS, Koehler C, Henkel E, Leonhardt W, Fuecker K, Hanefeld M. Postchallenge plasma glucose and glycemic spikes are more strongly associated with atherosclerosis than fasting glucose or HbA1C level. Diabetes Care. 2000;23:1830–4.
- Borch-Johnsen K, Colagiuri S, Balkan B. Creating a pandemic of prediabetes: the proposed new diagnostic criteria for impaired fasting glucose. Diabetologia. 2004;47:1396–402.
- Tirosh A, Shai I, Tekes-Manova D. Normal fasting plasma glucose levels and type 2 diabetes in young men. N Engl J Med. 2005;353: 1454–62.
- Nichols GA, Hillier TA, Brown JB. Normal fasting plasma glucose and risk of type 2 diabetes diagnosis. Am J Med. 2008;121:519–24.
- Miettinen TA, Huttunen JK, Naukkarinen V, Strandberg T, Mattila S, Kumlin T, et al. Multifactorial primary prevention of cardiovascular diseases in middle-aged men. Risk factor changes, incidence and mortality. JAMA. 1985;254:2097–102.
- Pelkonen R, Pyörälä K, Kangas T. Diagnostic criteria and classification of diabetes; new recommendations of the WHO Expert Committee. A review. Duodecim. 1981;100:154–8.
- Hultman E. Rapid specific method for determination of aldosaccharides in body fluids. Nature. 1959;183:108–9.
- D’Orazio P, Burnett RW, Fogh-Andersen N, Jacobs E, Kuwa K, Kulpmann WR, et al. International Federation of Clinical Chemistry Scientific Division Working Group on Selective Electrodes and Point of Care Testing. Approved IFCC recommendation on reporting results for blood glucose (abbreviated). Clin Chem. 2005;51:1573–6.
- Shaw JE, Zimmet PZ, de Courten M, Dowse GK, Chitson P, Gareeboo H, et al. Impaired fasting glucose or impaired glucose tolerance: what best predicts future diabetes in Mauritius?Diabetes Care. 1999;22: 399–402.
- de Vegt F, Dekker JM, Jager A, Hienkens E, Kostense PJ, Stehouwer CD, et al. Relation of impaired fasting and postload glucose with incident type 2 diabetes in a Dutch populations: the Hoorn Study. JAMA. 2001;285:2109–13.
- Lyssenko V, Almgren P, Anevski D, Perfekt R, Lahti K, Nissèn M, et al. Predictors of and longitudinal changes in insulin sensitivity and secretion preceding onset of type 2 diabetes. Diabetes. 2005;54:166–74.
- Stern MP, Williams K, Haffner ST. Identification of persons at high risk for type 2 diabetes mellitus: do we need the oral glucose tolerance test?Ann Intern Med. 2002;136:575–81.
- Dankner R, Abdul-Ghani MA, Gerber Y, Chetrit A, Wainstein J, Raz I. Predicting the 20-year diabetes incidence rate. Diabetes Metab Res Rev. 2007;23:551–8.
- Gerstein HC, Santaguida P, Raina P, Morrison KM, Balion C, Hunt D. Annual incidence and relative risk of diabetes in people with various categories of dysglycemia: a systematic overview and meta-analysis of prospective studies. Diabetes Res Clin Pract. 2007;78:305–12.
- Esposito K, Ciotola M, Carleo D, Schisano B, Sardelli L, Di Tommaso D. Post-meal glucose peaks at home associate with carotid intima- media thickness in type 2 diabetes. J Clin Endocrinol Metab. 2008;93:1345–50.
- Manco M, Panunzi S, Macfarlane DP, Golay A, Melander O, Konrad T, et al. One-hour plasma glucose identifies insulin resistance and β-cell dysfunction in individuals with normal glucose tolerance. Cross- sectional data from the Relationship between Insulin Sensitivity and Cardiovascular Risk (RISC) study. Diabetes Care. 2010;33:2090–7.
- Selvin E, Steffes MW, Zhu H, Matsushita K, Wagenknecht L, Pankow J, et al. Glycated hemoglobin, diabetes, and cardiovascular risk in nondiabetic adults. N Engl J Med. 2010;362:800–11.
- Heianza Y, Hara S, Arase Y, Saito K, Fujiwara K, Tsuji H, et al. HbA1c 5.7—6.4% and impaired fasting plasma glucose for diagnosis of prediabetes and risk of progression to diabetes in Japan (TOPICS 3): a longitudinal cohort study. Lancet. 2011;378:147–55.
- Olson DE, Rhee MK, Herrick K, Ziemer DC, Twombly JG, Phillips LS. Screening for diabetes and pre-diabetes with proposed A1C-based diagnostic criteria. Diabetes Care. 2010;33:2184–9.
- Wikström K, Lindström J, Tuomilehto J, Saaristo TE, Korpi-Hyövälti E, Oksa H, et al. Socio-economic differences in dysglycemia and lifestyle-related risk factors in the Finnish middle-aged population. Eur J Public Health. 2011;6:768–74.
- Anderwald C, Gastaldelli A, Tura A, Krebs M, Promintzer-Schifferl M, Kautzky-Willer A, et al. Mechanism and effects of glucose absorption during an oral glucose tolerance test among females and males. J Clin Endocrinol Metab. 2010;96:515–24.
- Færch K, Borch-Johnsen K, Vaag A, Jørgensen T, Witte D. Sex differences in glucose levels: a consequence of physiology or methodological convenience? The Inter99 study. Diabetologia. 2010;53:858–65.
- Selvin E, Crainiceanu CM, Brancati FL, Coresh J. Short-term variability in measures of glycemia and implications for the classification of diabetes. Arch Intern Med. 2007;167:1545–51.