
Abstract
Background Gestational diabetes mellitus (GDM) is a prediabetic state that is known to increase the risk of cardiovascular diseases. We have investigated coronary flow velocity reserve (CFVR) and epicardial fat thickness (EFT), and left ventricular diastolic function in patients with a history of previous GDM (p-GDM).
Methods Ninety-three women with GDM history and 95 healthy women without GDM history were recruited. We used transthoracic Doppler echocardiography to assess CFVR, EFT, and left ventricular diastolic function. Insulin resistance of each subject was assessed with homeostasis model assessment insulin resistance (HOMA-IR). Hemoglobin A1c and high-sensitivity C-reactive protein (hsCRP) were also measured in all patients.
Results CFVR values were significantly lower (2.34 ± 0.39 versus 2.80 ± 0.24, p < 0.001) and EFT values were significantly higher in patients with p-GDM than the control group (5.5 ± 1.3 versus 4.3 ± 1.1, p < 0.001). E/E' ratio (7.21 ± 1.77 versus 6.53 ± 1.38, p = 0.003), hemoglobin A1c (5.2 ± 0.4 and 5.0 ± 0.3, p = 0.001), HOMA-IR (2.8 ± 1.4 versus 1.7 ± 0.9, p = 0.04), and hsCRP levels were significantly higher in the p-GDM group than the control group. Multivariate analysis revealed that gestational diabetes history is independently associated with CFVR.
Conclusion Women with a GDM history may be at more risk regarding coronary microvascular dysfunction compared to the healthy ones.
What is already known about this subject?
Impairment of CFVR reflects coronary microvascular dysfunction and has been shown to be an early manifestation of atherosclerosis and coronary artery disease.
Several studies have shown an association between p-GDM and atherosclerosis by measuring intima-media thickness.
What are new findings?
This preliminary study on coronary microvascular function of patients with p-GDM revealed that CFVR is significantly impaired in p-GDM patients.
Although the number of patients included in this study is limited, these results suggest that impaired CFVR may be an early manifestation of coronary vascular involvement in patients with p-GDM.
How might it impact on clinical practice in the foreseeable future?
In patients with p-GDM, the presence of impaired CFVR should render the clinician aware of the development of coronary artery disease.
Key Messages
Introduction
Gestational diabetes mellitus (GDM) is defined as glucose intolerance that is detected during pregnancy (Citation1). This condition occurs in approximately 7% (ranging from 1% to 14%, depending on the population studied and the diagnostic test employed) of all pregnancies (Citation1). Shortly after delivery, glucose homoeostasis is restored to non-pregnancy levels, but affected women remain at high risk of developing type 2 diabetes mellitus and cardiovascular disease (CVD) in the future (Citation2,Citation3). However, it is not known whether women with a previous history of GDM, who do not develop diabetes mellitus and who have no CV risk factors, have an increased CVD risk compared to those without gestational hyperglycemia. Several studies have indicated that a pregnancy complicated with GDM has a significant impact on endothelial function during pregnancy (Citation4,Citation5), and there is evidence of subclinical inflammation and early vascular dysfunction after delivery (Citation6,Citation7). Furthermore, Bo et al. recently demonstrated that women with a GDM history, although currently free from metabolic abnormalities, appear to be at increased risk of endothelial impairment later in life (Citation6). Endothelial dysfunction is considered to be an early step in the development of atherosclerosis (Citation8). However, endothelial dysfunction that is detected in the brachial arteries may not reflect the condition of the coronary vasculature.
Coronary flow velocity reserve (CFVR) measurement has been proposed as a useful physiologic index for coronary circulation (Citation9). Measurement of coronary flow reserve is used to assess epicardial coronary arteries and to examine the integrity of coronary microvascular circulation (Citation9). Impaired endothelial function and reduced CFVR, both of which reflect coronary microvascular function, have been shown to be early manifestations of coronary atherosclerosis.
Epicardial fat is tissue with metabolic activity that has been suggested to play a role in the pathogenesis of cardiac abnormalities which are linked to several cardiometabolic risk factors, including coronary artery disease and subclinical atherosclerosis (Citation10,Citation11). The echocardiographic assessment of epicardial fat thickness (EFT) is a reproducible parameter, and it correlates reliably with the magnetic resonance imaging measurement of epicardial fat. There is mounting evidence that changes in the perivascular tissues surrounding the epicardial coronary arteries could alter vascular homeostasis and contribute to endothelial and coronary microvascular dysfunction.
We hypothesize that a history of GDM may be associated with damage in coronary circulation and also related to early atherosclerosis and left ventricular diastolic dysfunction, which is clinically demonstrated as subclinical diabetic cardiomyopathy. Therefore, we aimed to evaluate CFVR, EFT, and left ventricular diastolic function in patients with a history of GDM.
Materials and methods
Study populations
The study was carried out in coordination with the Gynecological and Obstetrical Department of Baskent University and Selcuk University from the beginning. Patients diagnosed with GDM at the gynecological and obstetrical departments of the universities were referred to the Cardiology Department of Baskent University. Referred patients were screened for eligibility and enrolled if the necessary requirements were fulfilled.
Diagnosis of GDM at gynecological and obstetrical departments
From April 2010 to January 2015 every pregnant woman referred to the Gynecological and Obstetrical Department of Baskent University and Selcuk University was screened with a 50 g oral glucose tolerance test (OGTT) at the 24–28 week gestational stage. Those with 1-hour glucose levels of ≥140 (7.8 mmol/L) were considered to be candidates for GDM, prompting further evaluation with a 100 g OGTT after 1–2 weeks; GDM was diagnosed when two serum glucose values were above the cut-off values. The American Diabetes Association considers the following values to be abnormal during a 100 g glucose OGTT: fasting blood glucose level ≥95 mg/dL (5.33 mmol/L), a 1-hour blood glucose level ≥180 mg/dL (10 mmol/L), a 2-hour blood glucose level ≥155 mg/dL (8.6 mmol/L), and a 3-hour blood glucose level ≥140 mg/dL (7.8 mmol/L) (Citation12). Patients with or without GDM were questioned about major CV risk factors, including hypertension (using antihypertensive treatment or having blood pressure >140/90 mmHg), obstructive sleep apnea, stroke, congestive heart failure, diabetes mellitus, collagen tissue disease and inflammatory bowel disease, hemolytic, hepatic, and renal diseases, dyslipidemia, excessive alcohol consumption (>20 g ethanol/day), and multiple pregnancies; patients with these conditions were excluded from the study. Patients using nitrates, steroids, beta blockers, and calcium channel blockers, as well as those who smoked or those whose ECG showed changes of ST segment or T wave specific for myocardial ischemia, Q wave, and incidental left bundle branch block were also excluded. After screening 1,258 pregnant women (with GDM or without GDM), the patients selected as eligible candidates for recruitment were followed throughout their pregnancies. Approximately 6 months after the term, a standard 75 g oral glucose tolerance test was administered to participants in both groups. Venous blood samples were obtained from each participant after overnight fasting and a 24-hour period of absence from alcohol and vigorous physical exercise for the determination of the serum biochemical parameters. Participants with a 2-hour postload glucose of <140 mg/dL were considered to have normal glucose tolerance, those with a 2-hour postload glucose between 140 mg/dL and 199 mg/dL were considered to have impaired glucose tolerance, and those with a 2-hour postload glucose >200 mg/dL were considered to have a provisional diagnosis of diabetes. Participants with a history of GDM and without glucose intolerance or diabetes, according to the 75 g OGTT, were enrolled in the study as the gestational diabetes group. Participants without GDM and without glucose intolerance or diabetes according to the 75 g OGTT were identified as the control group. Fulfilling all inclusion and exclusion criteria, 93 women with GDM history and 95 women without GDM history were enrolled in the study.
Biochemical assessment
Serum glucose was measured by a spectrophotometric method (Aeroset automated analyzer, Abbott Laboratories, Abbott, IL, USA). Fasting insulin was measured using the immunoturbidimetric method. Total cholesterol, high-density lipoprotein (HDL), low-density lipoprotein (LDL), and triglyceride levels were measured using enzymatic methods. Insulin resistance (IR) was calculated by the homeostasis model assessment insulin resistance index (HOMA-IR) (Citation12). The HOMA-IR was calculated using the following formula: fasting serum insulin (micro-units per milliliter) × fasting plasma glucose (FPG) (micromoles per liter/22.5), which has been found to correlate with glucose clamp measurement in non-diabetic, diabetic, and hypertensive populations (Citation13). Plasma levels of high-sensitivity C-reactive protein (hsCRP) were measured with a highly sensitive sandwich ELISA technique.
Echocardiographic examination
An Acuson Sequoia C256 (Acuson, Mountain View, CA, USA) echocardiography machine with broadband transducers (3V2c and 5V2c high-resolution transducers with second harmonic capability) was used. Each participant underwent standard two-dimensional and standard M-mode echocardiography, and subsequent standard and pulsed tissue Doppler echocardiography, according to the recommendations of the American Society of Echocardiography (ASE). The echocardiographic images were recorded on VHS videotapes. Diastolic and systolic interventricular septal (IVS) thickness, posterior wall (PW) thickness, left ventricular end-diastolic diameter (LVEDD), and left ventricular end-systolic diameter (LVESD) were measured on the parasternal long-axis views, and left ventricular mass was calculated according to the ASE chamber quantification guidelines (Citation14). All measurements were performed on M-mode images. The pulsed Doppler sample volume was positioned at the mitral leaflet tips. Early diastolic peak flow velocity (E), late diastolic peak flow velocity (A) and E/A ratio, and E wave deceleration time (DT) were measured from the transmitral Doppler spectra. The Doppler tissue-imaging (DTI) program was set to the pulsed-wave Doppler mode. Filters were set to exclude high-frequency signals, and the Nyquist limit was adjusted to a velocity range of –15 cm/s to 20 cm/s. Gains were minimized to allow for a clear tissue signal with minimal background noise. All of the DTI recordings were obtained during normal respiration. A 5 mm sample volume was placed at the apical four-chamber view on the septal corner of the mitral annulus (Citation15). The resulting velocities were recorded for 5 to 10 cardiac cycles at a sweep speed of 100 mm/s and stored on VHS videotape for later offline analyses. The following measurements were determined as indexes of regional diastolic function: myocardial early (E') and atrial (A') peak velocities (cm/s) and E'/A' ratio. Mitral annular isovolumetric relaxation time, isovolumetric contraction time (IVCT), as well as ejection time (ET) and myocardial performance index (MPI) were measured. MPI was defined as the summation of isovolumetric contraction and relaxation time divided by ejection time (Citation16).
EFT measurement
EFT was identified as the echo-free space between the epicardial layers on two-dimensional images, and its thickness was measured on the free wall of the right ventricle (RV) from both parasternal long- and short-axis views at end diastole. In the parasternal long-axis view, the anatomical reference was the aortic annulus, and the measurement was performed on the RV free wall along the midline of the ultrasound beam perpendicular to the aortic annulus. In the parasternal short-axis view, EFT was measured perpendicularly to the RV free wall (Citation11). All of the echocardiographic parameters were measured in three consecutive cardiac cycles and averaged. The same blinded investigator performed the echocardiography, and two blinded cardiologists analyzed the echocardiogram recordings. In our laboratory, the inter-observer and intra-observer correlation coefficients of the EFT measurements were 0.95 and 0.94, respectively.
CFVR measurement
A single researcher who had experience using transthoracic Doppler harmonic echocardiography (TTDE) made the CFVR measurements. The CFVR test was performed according to methods previously described by color-guided, pulsed Doppler of the mid-to-distal left anterior descending (LAD) coronary artery (Citation15). The left ventricle (LV) was imaged in the long-axis cross-section, and the ultrasound beam was inclined laterally. The acoustic window was around the midclavicular line in the fourth and fifth intercostal spaces in the left lateral decubitus position, and coronary blood flow velocities were recorded in each patient both at rest and after hyperemia obtained by dipyridamole administration (0.56 mg/kg over 4 minutes) (Citation15). An additional infusion of dipyridamole (0.28 mg/kg over a 2-minute period) was used if the heart rate did not exceed a 10% increase from the baseline. A pulsed-wave Doppler recording of LAD flow, which showed a characteristic biphasic flow pattern with larger diastolic and smaller systolic components, was attempted under color Doppler guidance. To calculate CFVR, diastolic peak velocities were measured by averaging the three highest diastolic velocities from the spectral Doppler signals, both at rest and after dipyridamole infusion. CFVR was defined as the ratio of hyperemic to resting diastolic peak velocities. ECG was continuously monitored during the test. Heart rate, systolic BP, and diastolic BP were measured at an interval of 4–6 minutes. The methods used for CFVR and the reproducibility of our CFVR laboratory measurements have been previously reported (Citation15).
Statistical analysis
Statistical analyses were performed using SPSS software version 21 (IBM, Inc., Chicago, IL, USA). The distribution of continuous variables for normality was tested with a one-sample Kolmogorov–Smirnov test, and the data are presented as mean and standard deviation (SD), or median and interquartile ranges, as appropriate. The categorical variables are reported as frequencies and group percentages. The differences in the normally and non-normally distributed variables between patients with GDM and patients in the control group were evaluated by the unpaired t test and the Mann–Whitney U test, respectively, as appropriate. A subgroup analysis was made according to age groups in GDM group. The parameters affecting CFVR were investigated using Spearman/Pearson correlation and Student’s t test, where appropriate. A multiple linear regression model was used to identify independent predictors of CFVR. The model fit was assessed using appropriate residual and goodness-of-fit statistics. A 5% type-I error level was used to infer statistical significance.
Results
The demographic data and clinical and biochemical parameters of the study population
A total of 188 women were enrolled in the study. The demographic, clinical, and biochemical characteristics of the participants are summarized in . Of the participants, 95 (50.5%) were patients in the control group, and 93 (49.5%) were patients with gestational diabetes mellitus (GDM); the mean age was 33 ± 5 and 34 ± 5 years, respectively. Patients with GDM had significantly higher fasting insulin as well as higher total cholesterol levels and LDL cholesterol levels compared with the control group, whereas there was no significant difference between the groups with regard to age, body mass index, waist circumference, fasting glucose, and HDL cholesterol levels (). The HOMA-IR and HbA1c values were significantly higher in the GDM group than in the control group (for HOMA-IR, 2.8 ± 1.4 and 1.7 ± 0.9, respectively, p < 0.001; for HbA1c, 5.2 ± 0.4 and 5.0 ± 0.3, respectively, p = 0.001). In addition, the serum uric acid and gamma-glutamyl transferase (GGT) levels were significantly higher in the GDM group than in the control group (for uric acid, 4.8 ± 1.3 and 4.2 ± 1.4 mg/dL, respectively, p = 0.003; for GGT, 24 ± 10 and 19 ± 7 IU/L, respectively, p = 0.004). High-sensitivity C-reactive protein was also significantly higher in the patients with GDM than in the control group (3.1 ± 2.1 and 2.1 ± 2.1, respectively, p = 0.004) (). The echocardiographic findings of the GDM group and the control group are shown in .
Table I. Demographic, clinical, and biochemical characteristics of the GDM group and the control group.
Table II. Coronary flow reserve and echocardiographic measurements of the GDM group and the control group.
There were no significant differences between the two groups with respect to the echocardiographic findings, including IVS, PW, left ventricular diastolic diameter (LVDD), left ventricular systolic diameter (LVSD), ejection fraction, mitral and septum E', and septum isovolumic relaxation time (IVRT) and MPI. However, the mitral A velocities and mitral E/A ratios were significantly different in the patients with GDM than the control group (70.1 ± 12.8 versus 62.5 ± 9.2, respectively, p < 0.001 and 1.17 ± 0.21 versus 1.33 ± 0.18, respectively, p < 0.001). The patients with GDM also had significantly higher IVRT values than the control group (104 ± 12 versus 98 ± 13, respectively, p = 0.007) (). In addition, the septal annular A' velocities (11.4 ± 1.9 versus 9.7 ± 1.4, p < 0.001), septal annular E'/A' ratios (1.01 ± 0.27 versus 1.35 ± 0.19, p < 0.001), and E/E' ratios (7.21 ± 1.77 versus 6.53 ± 1.38, p = 0.03) were significantly different in the patients with GDM than the control group ().
There was also significant difference between the two groups in terms of epicardial fat thickness. The EFT values in the patients with GDM were higher than the control group (5.5 ± 1.3 versus 4.2 ± 1.1, respectively, p < 0.001).
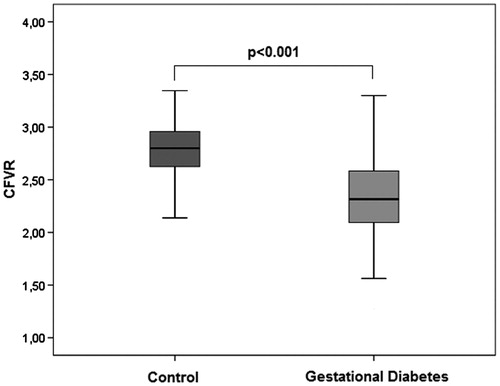
The coronary flow velocity reserve values were significantly lower in the patients with GDM than in the patients in the control group (2.34 ± 0.39 versus 2.83 ± 0.21, respectively, p < 0.001) (; ). Although the baseline peak diastolic flow velocities were significantly higher in the patients with GDM than in the control group (25.5 ± 5.3 versus 23.4 ± 5.1, respectively, p < 0.001), the peak coronary diastolic peak flow velocity of left anterior descending coronary artery (DPFV) values were higher in the control group than in the patients with GDM (65.2 ± 14.5 versus 58.5 ± 9.5, respectively, p < 0.001) (). Based on the above definition, the left ventricular mass and index values were similar in each group. A subgroup analysis was made according to age groups in GDM group. Median age was 35 years, and CFVR was significantly lower in patients aged >35 years than in patients aged ≤35 years (2.23 ± 0.39 versus 2.47 ± 0.35; p = 0.002). HbA1c (5.43 ± 0.38 versus 5.29 ± 0.38; p = 0.09) and BMI (27.1 ± 3.8 versus 26.3 ± 3.1; p = 0.24) were higher in patients aged >35 years than in patients aged ≤35, but not significantly.
Figure 1. CFVR values for the patients with GDM group and the control group.
The correlation analyses between CFVR and the study variables are shown in . shows the correlations between CFVR and EFT (r = –0.480, p < 0.001), HbA1c (r = –0.688, p < 0.001), and E/E' (r = –0.325, p < 0.001). Although there was no correlation between CFVR and serum cholesterol levels, basal systolic blood pressure (r = –0.384, p < 0.001), serum uric acid (r = –0.299, p < 0.001), HOMA-IR (r = –0.395, p < 0.001), hsCRP (r = –0.382, p < 0.001), and GGT (r = –0.239, p = 0.006) levels were inversely correlated with CFVR. In addition, the mitral A velocity (r = –0.356, p < 0.001), and septum A' (r = –0.297, p < 0.001) values were also inversely correlated with CFVR (). However, CFVR had a positive correlation with mitral E velocity (r = 0.241, p = 0.006) and the mitral E/A ratio (r = 0.193, p = 0.03).
Figure 2. Correlation analysis of CFVR, mitral E/septal E', epicardial fat thickness, and hemoglobin A1c.
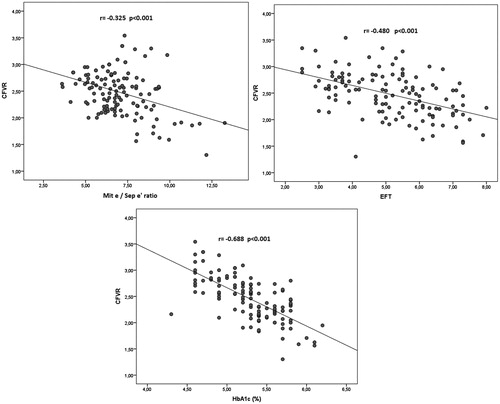
Table III. Correlation between CFVR and the study variables in the control group and in the patients with gestational diabetes group.
We also performed a multivariate backward linear regression analysis to determine the variables that were independently associated with CFVR. When CFVR was taken as the dependent variable and the other variables—including age, uric acid level, gestational diabetes status, HbA1c level, basal systolic blood pressure, E/E' ratio, LV mass index, LDL cholesterol, EFT, and hsCRP—were taken as the independent variables, we found that gestational diabetes, HbA1c, basal systolic blood pressure, and E/E' have an independent association with CFVR ().
Table IV. Multiple linear regression analyses for CFVR as a dependent variable.
Discussion
We have found that CFVR, as a marker of coronary microvascular function, was impaired in women with GDM as compared to healthy women. To the best of our knowledge, our study is the first to investigate the effect of previous gestational diabetes history on CFVR. Microvascular impairment forms before development of stenotic coronary lesions. Impaired CFVR is considered to be a sensitive indicator of coronary microvascular dysfunction, and it also signals the condition of increased risk for cardiovascular morbidity and mortality (Citation17). Furthermore, it inhibits the increase in myocardial blood flow when myocardial oxygen consumption increases, leading to a higher incidence of myocardial ischemia (Citation18).
Higher risk of type 2 diabetes or the metabolic syndrome after pregnancy has been proposed to explain most of the excess CVD risk associated with previous history of GDM, but most of the patients resume a normoglycemic state after pregnancy. It is still unknown whether patients with GDM and a normoglycemic state after pregnancy carry cardiovascular risk factors. Gunderson et al. demonstrated that a history of GDM is associated with early subclinical atherosclerosis before the onset of diabetes and with metabolic syndrome during the years after delivery (Citation19). GDM history apparently increases the progression of subclinical atherosclerosis, even in the absence of overt metabolic disease; therefore, a history of GDM may be considered to be a risk factor for atherosclerosis (Citation20). They used intima media thickness as a surrogate marker for CVD. As seen in the literature, a change in the carotid intima media thickness, depending on time, predicts long-term atherosclerosis and macrovascular functions, but it may fail to evaluate short-term changes in atherosclerosis sufficiently.
In a recent study, it is observed that in healthy cases, susceptible to type 2 diabetes but without hyperglycemia, there was a 10% decrease in CFVR levels after OGTT compared to basal CFVR levels (Citation21). This suggests that this acute effect of hyperglycemia may cause permanent impairment in CFVR. Due to the relatively low mean age of our patients the deteriorating effect of hyperglycemia on CFVR may occur with time. When we categorize the patients according to age groups, in the subgroup with higher age than median there were more frequent metabolic risk factors and CFVR was more impaired. This may suggest that in genetically susceptible patients with the accompanying risk factors CFVR may worsen with time.
Echocardiographically assessed CFVR provides information about microvascular circulation, and it can also show earlier atherosclerotic changes better than IMT. Moreover, microvascular disease detected by CFVR is reversible with lifestyle changes and treatment (Citation18). In our study, CFVR measurement was performed approximately 6 months after the pregnant women delivered. CFVR was significantly lower in the patients with a history of GDM. Our study’s findings differ from the findings of Gunderson et al. (Citation19); that study showed that CVD risk development occurred much earlier after pregnancy. It is possible that this might be due to accompanying risk factors. In this context, patients with a history of GDM had higher total cholesterol and higher LDL cholesterol levels, but multivariate analysis showed that those levels did not have a significant impact on the impairment of CFVR.
Persistent insulin resistance and dyslipidemia (i.e. higher total and LDL cholesterol) may be present before, during, and/or after a GDM pregnancy, and these can damage the endothelium to promote inflammatory processes leading to early atherosclerosis (Citation22). Elevated glucose and dyslipidemia are believed to mediate the association of diabetes with higher CVD risk (Citation22,Citation23). A majority of women with a history of GDM may exhibit persistent mild or moderate insulin resistance and dyslipidemia without conversion to diabetes in midlife. Thus, a history of GDM may serve as an additional early indicator of elevated CVD risk before the onset of type 2 diabetes mellitus or overt metabolic disease in women.
Insulin resistance is associated with endothelial dysfunction (Citation20) and with CFVR (Citation24). HbA1c, as a marker of glucose metabolism, has been reported to be inversely correlated with flow-mediated vasodilation (Citation25) and coronary flow reserve (Citation24). Consistent with previous data, our study revealed that glucose metabolism disorders, such as insulin resistance and elevated HbA1c, are correlated with microvascular dysfunction. Previous GDM and HbA1c were found to be independent predictors for CFVR.
Hyperglycemia plays an important role in the pathogenesis of microvascular dysfunction. This mainly occurs with glycation and deterioration of the proteins acting to control microvascular functions. Hyperglycemia by several mechanisms, such as advanced glycation end-products, polyol, activation of diacylglycerol-protein kinase C pathways, and chronic or subclinical inflammation, finally activates oxidative stress, which plays a pivotal role in diabetic endothelial dysfunction (Citation26). Our study showed that insulin resistance, hyperglycemia parameters, and oxidative stress markers (such as uric acid and GGT) have a negative impact on CFVR.
Another hormone that may play a role in this observation is prolactin. Studies have shown vasoconstrictive effects of prolactin on coronary arteries (Citation27). It is also hypothesized that prolactin could be a co-stimulator of platelet activation in patients with acute coronary syndrome (Citation27,Citation28). Due to high levels of prolactin in lactation, impairment in CFVR may be caused by prolactin’s circulatory effects.
Epicardial fat tissue has been shown to be a true visceral fat with characteristics of a highly insulin-resistant tissue; it has been found to be a source of several inflammatory mediators (Citation29). Iacobellis et al. found a significant correlation between epicardial fat and waist circumference, diastolic blood pressure, fasting plasma insulin, LDL cholesterol, and plasma adiponectin. Moreover, they claimed that echocardiographic assessment of epicardial fat could be an easy method to identify patients with high cardiovascular risk (Citation30). Epicardial fat thickness was significantly higher in the women with prior GDM, but it was not an independent predictor of CFVR. Thus, systemic measures of insulin sensitivity seem to be more important than epicardial fat. Although abdominal obesity is acknowledged as a reliable predictor of intra-abdominal fat, it can be confounded by large amounts of subcutaneous fat, especially in obese cases (Citation20). However, epicardial fat represents true visceral adipose tissue and can be assessed without invasive measures.
EFT alters microcirculation with its metabolic properties and also with its local inflammatory effects. As an adipose tissue, epicardial fat can be a CRP synthesis source causing inflammatory burden (Citation29). In our study hsCRP levels were significantly higher in the p-GDM group than control group. Also, studies have shown that, due to the lack of any barrier between adipocytes and myocardium, adipokines secreted from EFT is directly transmitted to coronary arteries (Citation31,Citation32). These adipokines have the ability to hamper coronary arterial tone and impair CFVR.
We also found that although left ventricular systolic function and left ventricular mass index were similar between the two groups, the diastolic function parameters were impaired in the GDM group. It is well known that LV diastolic dysfunction is an early complication in type 2 diabetes mellitus, and it has been suggested to be the first stage in the development of diabetic cardiomyopathy (Citation33). Using tissue Doppler and strain/strain rate echocardiography, a recent study showed that LV longitudinal systolic and diastolic function was impaired in diabetic patients (Citation34). Since coronary blood flow predominantly occurs during diastole, impairment in LV diastolic function may also play an important role in CFVR impairment in gestational diabetics. In line with these suggestions, we found that there was an association between left ventricular diastolic function parameters (especially E/E') and CFVR in both groups.
There are several limitations of our study. First, it is an observational study, and surrogate markers are used to show microvascular and endothelial dysfunction. Second, we have used CFVR instead of coronary flow reserve because we were unable to measure coronary artery diameter. In addition, measurement of coronary flow velocity reserve obtained by TTDE is angle-dependent, and CFVR assessment by TTDE depends on linear rather than volumetric blood flow velocity measurements.
Clinical implications
GDM is a temporary state of hyperglycemia, but it can lead to diabetes and cardiovascular disease later in life. Echocardiographic CFVR measurement is a relatively less invasive and easily accessible method that can be used to follow up subclinical atherosclerosis. For prevention of atherosclerosis our finding that GDM is associated with early atherosclerosis even during pregnancy is important because we can establish a prevention strategy, such as weight control and lifestyle changes, for GDM patients earlier in life.
Declaration of interest
The authors declare there are no financial or other potential conflicts of interest regarding the manuscript.
This study received no external funding.
References
- American Diabetes Association. Diagnosis and classification of diabetes mellitus. Diabetes Care. 2014;37(Suppl 1):S81–90.
- Savitz DA, Danilack VA, Elston B, Lipkind HS. Pregnancy-induced hypertension and diabetes and the risk of cardiovascular disease, stroke, and diabetes hospitalization in the year following delivery. Am J Epidemiol. 2014;180:41–4.
- Retnakaran R, Shah BR. Mild glucose intolerance in pregnancy and risk of cardiovascular disease: a population-based cohort study. CMAJ. 2009;181:371–6.
- Knock GA, McCarthy AL, Lowy C, Poston L. Association of gestational diabetes with abnormal maternal vascular endothelial function. Br J Obstet Gynaecol. 1997;104:229–34.
- Chirayath HH, Wareing M, Taggart MJ, Baker PN. Endothelial dysfunction in myometrial arteries of women with gestational diabetes. Diabetes Res Clin Pract. 2010;89:134–40.
- Bo S, Valpreda S, Menato G, Bardelli C, Botto C, Gambino R, et al. Should we consider gestational diabetes a vascular risk factor? Atherosclerosis. 2007;194:e72–9.
- Tarim E, Yigit F, Kilicdag E, Bagis T, Demircan S, Simsek E, et al. Early onset of subclinical atherosclerosis in women with gestational diabetes mellitus. Ultrasound Obstet Gynecol. 2006;27:177–82.
- Vita JA, Keaney JF Jr. Endothelial function: a barometer for cardiovascular risk? Circulation. 2002;106:640–2.
- Hirata K, Amudha K, Elina R, Hozumi T, Yoshikawa J, Homma S, et al. Measurement of coronary vasomotor function: getting to the heart of the matter in cardiovascular research. Clin Sci (Lond). 2004;107:449–60.
- Tok D, Kadife I, Turak O, Ozcan F, Başar N, Cağlı K, et al. Increased epicardial fat thickness is associated with low grade systemic inflammation in metabolic syndrome. Turk Kardiyol Dern Ars. 2012;40:690–5.
- Eroglu S, Sade LE, Yildirir A, Bal U, Ozbicer S, Ozgul AS, et al. Epicardial adipose tissue thickness by echocardiography is a marker for the presence and severity of coronary artery disease. Nutr Metab Cardiovasc Dis. 2009;19:211–17.
- American Diabetes Association. Gestational diabetes mellitus. Diabetes Care. 2003;26(Suppl 1):s103–5.
- Hermans MP, Levy JC, Morris RJ, Turner RC. Comparison of insulin sensitivity tests across a range of glucose tolerance from normal to diabetes. Diabetologia. 1999;42:678–87.
- Lang RM, Bierig M, Devereux RB, Flachskampf FA, Foster E, Pellikka PA, et al. Chamber Quantification Writing Group; American Society of Echocardiography's Guidelines and Standards Committee; European Association of Echocardiography. Recommendations for chamber quantification: a report from the American Society of Echocardiography’s Guidelines and Standards Committee and the Chamber Quantification Writing Group, developed in conjunction with the European Association of Echocardiography, a branch of the European Society of Cardiology. J Am Soc Echocardiogr. 2005;18:1440–63.
- Gullu H, Caliskan M, Erdogan D, Yilmaz S, Dursun R, Ciftci O, et al. Patients with Behcet’s disease carry a higher risk for microvascular involvement in active disease period. Ann Med. 2007;39:154–59.
- Başar C, Beşli F, Türker Y, Ordu S, Bulur S, Başar F. Myocardial performance index in patients with dipper and nondipper hypertension. Blood Press Monit. 2014;19:216–19.
- Cortigiani L, Rigo F, Gherardi S, Galderisi M, Bovenzi F, Sicari R. Prognostic meaning of coronary microvascular disease in type 2 diabetes mellitus: a transthoracic doppler echocardiographic study. J Am Soc Echocardiogr. 2014;27:742–8.
- Crea F, Camici PG, Bairey Merz CN. Coronary microvascular dysfunction: an update. Eur Heart J. 2014;35:1101–11.
- Gunderson EP, Chiang V, Pletcher MJ, Jacobs DR, Quesenberry CP, Sidney S, et al. History of gestational diabetes mellitus and future risk of atherosclerosis in mid-life: the Coronary Artery Risk Development in Young Adults study. J Am Heart Assoc. 2014;3:e000490.
- Steinberg HO, Chaker H, Leaming R, Johnson A, Brechtel G, Baron AD. Obesity/insulin resistance is associated with endothelial dysfunction. Implications for the syndrome of insulin resistance. J Clin Invest. 1995;96:786–92.
- Ikonomidis I, Lambadiari V, Pavlidis G, Koukoulis C, Kousathana F, Varoudi M, et al. Insulin resistance and acute glucose changes determine arterial elastic properties and coronary flow reserve in dysglycaemic and first-degree relatives of diabetic patients. Atherosclerosis. 2015;241:455–62.
- Pallardo F, Herranz L, Garcia-Ingelmo T, Grande C, Martin-Vaquero P, Janez M, et al. Early postpartum metabolic assessment in women with prior gestational diabetes. Diabetes Care. 1999;22:1053–8.
- Selvin E, Coresh J, Golden SH, Brancati FL, Folsom AR, Steffes MW. Glycemic control and coronary heart disease risk in persons with and without diabetes: the atherosclerosis risk in communities study. Arch Intern Med. 2005;165:1910–16.
- Calişkan M, Pamuk BÖ, Güllü H, Çiftçi Ö, Çalişkan Z, Erdoğan D, et al. Effect of family history of type-2 diabetes on coronary flow reserve and its relationship with insulin resistance: an observational study. Anadolu Kardiyol Derg. 2013;13:48–56.
- Maruhashi T, Soga J, Fujimura N, Idei N, Mikami S, Iwamoto Y, et al. Relationship between flow-mediated vasodilation and cardiovascular risk factors in a large community-based study. Heart. 2013;99:1837–42.
- Picchi A, Capobianco S, Qiu T, Focardi M, Zou X, Cao JM, et al. Coronary microvascular dysfunction in diabetes mellitus: a review. World J Cardiol. 2010;2:377–90.
- Dal Lin C, Tona F, Osto E. Coronary microvascular function and beyond: the crosstalk between hormones, cytokines, and neurotransmitters. Int J Endocrinol. 2015;2015:312848.
- Molinari C, Grossini E, Mary DA, Uberti F, Ghigo E, Ribichini F, et al. Prolactin induces regional vasoconstriction through the beta2 adrenergic and nitric oxide mechanisms. Endocrinology. 2007;148:4080–90.
- Mazurek T, Zhang L, Zalewski A, Mannion JD, Diehl JT, Arafat H, et al. Human epicardial adipose tissue is a source of inflammatory mediators. Circulation. 2003;108:2460–6.
- Iacobellis G, Ribaudo MC, Assael F, Vecci E, Tiberti C, Zappaterreno A, et al. Echocardiographic epicardial adipose tissue is related to anthropometric and clinical parameters of metabolic syndrome: a new indicator of cardiovascular risk. J Clin Endocrinol Metab. 2003;88:5163–8.
- Iacobellis G, Corradi D, Sharma AM. Epicardial adipose tissue: anatomic, biomolecular and clinical relationships with the heart. Nat Clin Pract Cardiovasc Med. 2005;2:536–43.
- Sade LE, Eroglu S, Bozbaş H, Ozbiçer S, Hayran M, Haberal A, et al. Relation between epicardial fat thickness and coronary flow reserve in women with chest pain and angiographically normal coronary arteries. Atherosclerosis. 2009;204:580–5.
- Boudina S, Abel ED. Diabetic cardiomyopathy revisited. Circulation. 2007;115:3213–23.
- Ernande L, Bergerot C, Girerd N, Thibault H, Davidsen ES, Gautier Pignon-Blanc P, et al. Longitudinal myocardial strain alteration is associated with left ventricular remodeling in asymptomatic patients with type 2 diabetes mellitus. J Am Soc Echocardiogr. 2014;27:479–88.