
Abstract
Background: To compare the lipid profile between patients with and without inflammatory process in according nutritional status, gender and age.
Methods: One hundred and twenty-four children and adolescents in the emergency department were separated into two groups according to the levels of C-reactive protein (CRP). Total cholesterol, high-density lipoprotein (HDL) and low-density lipoprotein (LDL), triglycerides (TG) and albumin in patients with CRP < 5 mg/L were compared with patients with CRP ≥ 5 mg/L. Nutritional status was assessed by anthropometric measurements.
Results: Patients were mostly classified as well-nourished (76.5%) and had low levels of HDL (70%). There was no significant difference in lipid profile between the two groups of CRP. Linear regression analysis, however, it became clear that for each increase of 1 mg/L in the values of CRP expected an average reduction of 0.072 mg/dL of HDL, the 0.083 mg/dL of LDL, the 0.002 g/dL albumin and an average increase of 0.564 mg/dL of TG.
Conclusions: Patients with an inflammatory process exhibit changes in the serum levels of the lipids HDL, LDL and TG that are related to the degree of inflammation. These changes occurred regardless of nutritional status.
Lipoproteins are structures composed of lipids and proteins that transport fats in the circulation: HDL, LDL, IDL, VLDL and chylomicrons.
Lipoproteins, especially HDL, undergo changes during the systemic inflammatory response and play an important role as a modulator of the inflammatory response.
We believe this is a first study to show that inflammatory process modifies the serum levels of the lipoproteins and triglycerides independent of nutritional status, in paediatric patients.
Key Messages
Introduction
Childhood hyperlipidaemia is a predisposing factor for atherosclerosis and the development of heart disease in adulthood (Citation1). Risk factors such as hyperglycaemia, diabetes and hypertension in childhood are also important for the development of atherosclerosis in adulthood (Citation2).
The evaluation of the lipid profile and the early treatment for hyperlipidaemia and other atherosclerosis risk factors during childhood may prevent the development of cardiovascular diseases (Citation3,Citation4).
Clinical conditions that show inflammation also temporarily affect the lipid profile. Patients with sepsis and systemic inflammatory response syndrome (SIRS) have increased levels of triglycerides (TG) and decreased levels of high-density (HDL), low-density (LDL) and very low-density lipoprotein in the first 24 h following admission (Citation5,Citation6). Changes in the lipid profile during infection are most pronounced in the first 72 h; however, it may take more than 7 days to return to pre-infection values (Citation7).
A few studies have observed similar changes in the lipid profile of paediatric patients with a history of localized infection and have found that these changes are related to the process of atherogenesis (Citation8). HDL plays a protective role against the development of atherosclerosis. HDL participates in the removal of cholesterol in the blood vessels and promotes reverse cholesterol transport from the peripheral tissues to the liver (Citation9).
HDL also has an important role as a modulator of the systemic inflammatory response, among its many other functions. It plays an important role in neutralizing lipopolysaccharides during bacterial infection and acts on monocytes and macrophages to inhibit antigen presentation and suppress cytokine and chemokine production. HDL may contain proteins linked to the acute phase inflammatory response, lipid metabolism, activation of the complement system, regulation of tumour growth factor and proteolysis (Citation10,Citation11).
To examine the changes in the lipid profile, particularly in HDL, LDL and TG, in the early phases of the inflammatory process, which may or may not be associated with infection, we evaluated these indicators in children and adolescents treated in the paediatric emergency department of a secondary care teaching hospital.
Methods
Population
This study was conducted in infants, children and adolescents who were treated in the paediatric emergency department of a teaching hospital, which treat an average of 188 patients per day.
Calculation of sample size
The sample size was calculated to find a difference of at least 10 mg/dL in HDL levels in children with or without an inflammatory reaction, assuming the variability of HDL to be approximately 15 mg/dL, with a 95% confidence interval and 80% test power. The tests were performed with a 5% significance level.
Study design
This is a cross-sectional study in which the lipid profile of patients with infection-related complaints was analysed and the degree of inflammation was compared according to nutritional status, gender and age. Data collection was conducted from October 2012 to August 2013.
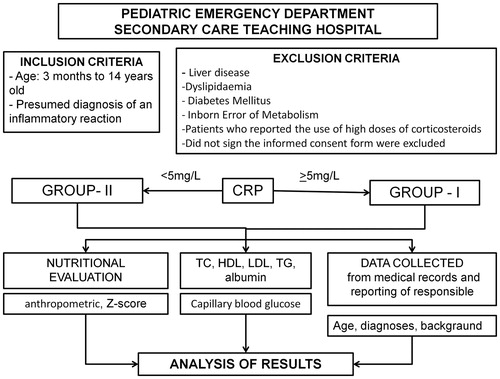
The study included patients between the ages of 3 months to 14 years old who were treated in the emergency department with a presumed diagnosis of an inflammatory reaction (primarily of infectious cause). Patients with a history of liver disease, dyslipidaemia or diabetes mellitus, patients who reported the use of high doses of corticosteroids and those whose caregivers did not sign the informed consent form were excluded.
The patients were divided into two groups for analysis based on their C-reactive protein (CRP) values, an important inflammatory marker. Group I, or the “with inflammation” patients, had a CRP ≥ 5 mg/L, and group II, or the “without inflammation” patients, had CRP values 5 mg/L.
During treatment in the emergency department, each patient’s total cholesterol (TC), HDL, LDL, TG, CRP, glucose, total protein and protein fractions were measured. The biological material was processed at the laboratory of the University Hospital of the University of São Paulo – Brazil (HU-USP), using the following methods: automated cholesterol oxidase for TC, automated direct for HDL, the Friedewald equation for LDL, automated peroxidase glycerol for TG, automated biuret for total protein, automated bromocresol green for albumin (ALB) and nephelometry for CRP (CardioPhase®hsCRP, Siemens Healthcare Diagnostics, Erlangen, Germany). Capillary blood glucose was measured using the Accu-Chek® (Mannheim, Germany) device. Patients did not need to be fasting for the laboratorial tests.
The results of the laboratory tests and nutritional status classification were compared between groups I and II. The differences were also analysed by age and gender.
The results for the patients’ lipid profiles were interpreted based on the recommendations of the Expert Panel on Integrated Guidelines for Cardiovascular Health and Risk Reduction in Children and Adolescents (Citation12) and the V Brazilian Guidelines for Dyslipidaemia and Atherosclerosis Prevention of the Brazilian Society of Cardiology (Sociedade Brasileira de Cardiologia – SBC) (Citation13). Lipid values were considered normal within the following ranges: TC < 170 mg/dL, LDL < 110 mg/dL, TG < 90 mg/dL and HDL > 45 mg/dL. Borderline and higher values were considered abnormal.
For the nutritional evaluation, the patients were classified into three groups according to their anthropometric measurements, specifically weight and height, body mass index (BMI) and Z-score: normal or well-nourished, overweight/obese and underweight/extremely underweight. The nutritional classification of the patient was determined according to the growth curves of the World Health Organization (WHO) (Citation14).
The flowchart below summarises the study design ().
Figure 1. Study design.
Statistical analysis
The qualitative variables and lipid profile classifications were described using absolute and relative frequencies, while the quantitative variables were described using means and standard deviations (SD). Personal characteristics, nutritional status classification and characterization of lipid profiles were described using summary measures (mean, SD, median, minimum and maximum) and compared between groups I and II using Student’s t-test.
For patients with CRP ≥ 5 mg/L, Spearman’s correlations between the lipid profile and the following variables were calculated: CRP, nutritional status and personal characteristics. Linear regression models were fit for variables that had a significant correlation, and only the variables with descriptive levels below 5% (p < 0.05) remained in the final models.
Results
A total of 129 patients were considered eligible for the study. Two patients were lost (insufficient biological samples for CRP measurement) and three patients did not have anthropometric measurements taken. Therefore, of the 129 eligible patients, 124 were included in the analysis.
The overall sample analysis revealed that the sample comprised 60 (48.5%) female and 64 (51.5%) male patients. The median age of the patients included in the study was 51 months, 38 (30.6%) infants, 31 (25%) preschoolers and 55 (44.4%) children/adolescents. In regard to the nutritional status, 76.5% of patients were classified as normal, 17% as overweight or obese and 6.5% as underweight or extremely underweight.
Within each age group patients had the following nutritional classification: among the infants 36 (94.7%) well-nourished, no overweight/obesity and two (5.3%) thinness/extremely underweight; among the preschoolers 28 (90.3%) well-nourished two (6.5%) overweight/obesity and one (3.2%) underweight/extremely underweight; among the children/adolescents 32 (58%) well-nourished, 19 (34%) overweight/obesity and four (7.3%) underweight/extremely underweight.
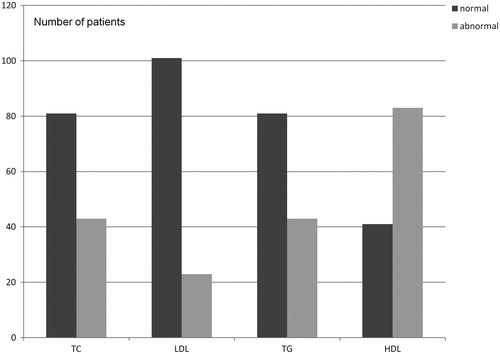
Regarding the lipid concentrations, the results were within the range considered normal of 65% for TC, 81% for LDL and 81% for TG. As for the HDL concentrations, the majority of patients (70%) had serum concentrations below the values considered normal. The laboratory results are shown in .
Figure 2. Lipids profile results (total sample).
Within the three nutritional classification groups, the majority of patients had low HDL levels; this change was independent of nutritional status ().
Table 1. Relationship between nutritional status and serum lipid concentrations.
Of the patients with abnormal levels of TC, 79% were well-nourished, 21% were overweight or obese, and none were considered underweight or extremely underweight. Among the patients with low concentrations of HDL, 76% were well-nourished, 18% were overweight or obese and 6% were underweight or extremely underweight ().
Table 2. The nutritional status of patients with abnormal concentration of TC and HDL.
The mean blood glucose level was 106.9 mg/dL (SD = 26.8), with a minimum value of 56 mg/dL and a maximum value of 288 mg/dL. It was not part of the study design of the fast, however most patients (70.2%) were at least two hours without eating. Nineteen patients (23.5%) had blood glucose values above 126 mg/dL, but only one throughout the sample presented blood glucose ≥ 200mg/dL (glycemic limit tolerated by oral glucose tolerance test – OGGT).
The main diagnosis of the patients were pneumonia, dengue virus infection, fever on unknown in children, acute diarrhoea, cellulitis, impetigo, acute appendicitis, urinary tract infection and pyelonephritis.
According to the CRP values, 82 patients were included in group I (CRP ≥ 5 mg/L) and 42 patients in group II (CRP < 5 mg/L). When comparing the two groups, there was no significant difference for the variables age, gender, nutritional status, serum albumin and lipid profile (TC, HDL, LDL and TG). Only capillary blood glucose was significantly higher in group I compared with group II (p = 0.01) ().
Table 3. Comparison of the Student’s t-test results for the groups I and II.
For the patients in Group I whose CRP ≥ 5 mg/dL, a linear regression analysis (Spearman’s correlation) was performed, where each variable was separately correlated to the CRP variable. The CRP level presented an inverse correlation with HDL (r = −0.363 e p = 0.001), LDL (r = −0.235 e p = 0.034) and ALB (r = −0.308 e p = 0.005). The higher the CRP the lower values of HDL, LDL and ALB. For TG, a significant direct correlation was observed (r = 0.426 e p > 0.001), so, the higher the CRP, the higher values for TG ().
Table 4. Results of the correlations between the variables studied in the Group I.
An inverse correlation was also observed for age (r = −0.261 e p = 0.018), where higher CRP values were associated with younger ages. There was no significant correlation between the BMI Z-score and any variable tested (p > 0.05).
For patients with some degree of inflammation, that is, CRP ≥ 5 mg/L, for each 1 mg/dL increase in CRP, we observed an average increase of 0.564 mg/dL in the TG serum concentration, an average decrease of 0.072 mg/dL in the HDL, an average decrease of 0.083 mg/dL in the LDL and an average decrease of 0.002 g/dL in the ALB, regardless of the other characteristics evaluated in this group ().
Table 5. Results of the regression models for lipid profile variables according to the CRP serum concentration.
Discussion
This study aims mainly to analyse the relationship between serum lipids, inflammatory response and nutritional status in patients who were attended in a paediatric emergency department in a public university hospital in a developing country.
In the present study, performed in a university hospital of a developing country, the concentrations of TC, LDL and TG were normal in the majority of patients. The percentage of patients who exhibited changes in the lipid profile was similar to the results found in other studies that evaluated the lipid concentration and nutritional status of children and adolescents (Citation15–18). In the USA, according to data from the National Health and Nutrition Examination Survey (NHANES), from 1999 to 2006, there was a 20.6% prevalence of dyslipidaemia in children from 6 to 19 years of age. Overweight and obese children were 1.6 and 3 times more prone to dyslipidaemia, respectively (Citation15). Between 2007 and 2010, there was a significant decrease in cholesterol levels in 10% of children from 6 to 19 years old and a decrease in hypertriglyceridemia from 11.3% to 8.1%, attributed to the establishment of prevention strategies in the American population between these periods (Citation16). In Brazil, in the city of Campinas, São Paulo, the lipid profile in 1600 schoolchildren from 7 to 14 years of age indicated that 35% had hypercholesterolemia (TC > 170 mg/dL) (Citation17). In 2001, in the city of Florianópolis, Santa Catarina – Brazil, an assessment of 1053 children between 7 and 18 years of age found hypercholesterolemia in 10% and hypertriglyceridemia in 22% (Citation18).
Obesity can be associated with dyslipidaemia in children (Citation18,Citation19). In this study, no association between the lipid profile and nutritional status was found. The percentage of patients with an abnormal lipid profile was similar among the different nutritional status groups. Most patients who had abnormal TC, TG and HDL levels were considered well-nourished.
Patients with severe acute systemic inflammation, SIRS and sepsis have acute changes in their lipid profile (Citation5,Citation6,Citation11). Minor acute infections also decrease the levels of HDL and LDL, as described in a study conducted in normal-BMI individuals from 9 to 21 years of age. The authors compared the HDL, LDL, TC and inflammatory status (CRP and orosomucoid concentration) of individuals with mild infections to a control group without infection, but did not included nutritional evaluation and information about health status (Citation8).
In the present study, no significant differences in the mean values for TC, LDL, HDL and TG were detected when comparing groups I and II. However there was a significant difference in blood glucose between the two groups, which can be explained by hormonal changes that occur during the acute phase of the inflammatory process. Changes in the lipid profile during sepsis also occur acutely, but are independent from the blood glucose levels during the inflammatory process (Citation20).
In the Group I, a significant correlation was observed between the lipid levels and the intensity of inflammation, indicating that the higher the CRP, the higher the TG and the lower the HDL, LDL and ALB. Similar results were found in adults patients admitted in intensive care unit with intense inflammatory state, SIRS or sepsis (Citation21). In paediatrics, a study has also shown similar acute changes in the lipid profile that was associated with mortality in children with a meningococcal infection (Citation22). In the present study, we emphasize that the changes in lipids concentration have been observed in patients with inflammation. Changes in TC, TG and HDL levels were associated to the inflammatory process however occurred regardless of the nutritional status of patients.
A very important characteristic observed in the lipid profile of the total sample was that most patients (70%) had abnormal HDL levels. This result differs from other studies in Brazilian children and adolescents without inflammatory process that reported a mean HDL value that is within the normal range (Citation14,Citation15). Mild acute infectious processes can be responsible for the decreased HDL levels (Citation8). This result is very important when considering that HDL can be a biomarker and plays a protective role during the infectious process. A study in hospitalized adults showed that for every 1 mg/dL increase in HDL levels, the chance of severe sepsis decreased by 3% (Citation23). Low HDL levels in adults with sepsis were associated with higher mortality and a longer intensive care unit stay (Citation24). The early and constant decline in HDL cholesterol in adults with severe sepsis is associated with adverse clinical outcome and increased mortality (Citation25).
In addition, it should be emphasized that HDL is responsible for esterification and reverse cholesterol transport (i.e., from the tissues to the liver) (Citation26). In this process, HDL promotes the removal of oxidized lipids from LDL, inhibits the attachment of adhesion molecules and of monocytes to the endothelium and stimulates nitric oxide release (Citation27). A study conducted in children who were hospitalized with acute infection showed that decreased HDL levels in the first 24 h of infection may have a correlation with the thickening of the intimal layer of the carotid artery, observed by ultrasound, when compared with a control group. In that study, the thickening of the carotid artery was greater in individuals who did not receive antibiotics (faster resolutions of inflammatory and infection processes) (Citation28).
The role of HDL during the initial phase of the inflammation process and the mechanisms by which a decrease in HDL circulating levels occurs are not well defined. Recent studies involving proteomic analysis of HDL showed that patients with different diseases (such as rheumatoid arthritis, coronary artery disease, chronic renal failure and psoriasis) have HDL with different protein compositions, reinforcing the important, but still unknown, function of this lipoprotein in inflammation (Citation29).
Human and animal studies have demonstrated a beneficial effect of higher levels of circulating HDL and apo AI, (the main apolipoprotein bound to HDL), including an improved immune response against severe systemic infections (Citation30,Citation31). Administration of apo AI in animals with severe infection reduced the production of inflammatory mediators and mortality in some of these studies, and can be a promise in future human research (Citation32–34).
The main strength of this was to perform a comparison lipids profile and nutritional evaluation between children and adolescents with inflammatory process (including mild cases) and without inflammation. The main limitations were: single nutritional evaluation; no evaluation of other lipid parameters (apolipoproteins), evaluation of inflammatory process based on exclusively CRP concentrations, the size of the sample and the chosen values for modifications in HDL.
Conclusions
Patients with an inflammatory process exhibit changes in the serum levels of the lipids HDL, LDL and TG that are related to the degree of inflammation. These changes occurred regardless of nutritional status.
Disclosure statement
The authors report no conflicts of interest.
References
- Raitakari OT, Juonala M, Kahonen M, Taittonen L, Laitinen T, Maki-Torkko N, et al. Cardiovascular risk factors in childhood and carotid artery intima-media thickness in adulthood: the Cardiovascular Risk in Young Finns Study. JAMA. 2003;290:2277–83.
- Morrison JA, Glueck CJ, Wang P. Childhood risk factors predict cardiovascular disease, impaired fasting glucose plus type 2 diabetes mellitus, and high blood pressure 26 years later at a mean age of 38 years: the Princeton-lipid research clinics follow-up study. Metab-Clin Exp. 2012;61:531–41.
- Magnussen CG, Koskinen J, Juonala M, Chen W, Srinivasan SR, Sabin MA, et al. A diagnosis of the metabolic syndrome in youth that resolves by adult life is associated with a normalization of high carotid intima-media thickness and type 2 diabetes mellitus risk the Bogalusa heart and cardiovascular risk in young Finns studies. J Am Coll Cardiol. 2012;60:1631–9.
- Juonala M, Jarvisalo MJ, Maki-Torkko N, Kahonen M, Viikari JSA, Raitakari OT. Risk factors identified in childhood and decreased carotid artery elasticity in adulthood: the cardiovascular risk in young Finns Study. Circulation. 2005;112:1486–93.
- Alvarez C, Ramos A. Lipids, lipoproteins, and apoproteins in serum during infection. Clin Chem. 1986;32:142–5.
- Chenaud C, Merlani PG, Roux-Lombard P, Burger D, Harbarth S, Luyasu S, et al. Low apolipoprotein A-I level at intensive care unit admission and systemic inflammatory response syndrome exacerbation. Crit Care Med. 2004;32:632–7.
- Gidding SS, Stone NJ, Bookstein LC, Laskarzewski PM. Month-to-month variability of lipids, lipoproteins, and apolipoproteins and the impact of acute infection in adolescents. J Pediatr. 1998;133:242–6.
- Aburawi EH, Grubb A, Raitakari OT, Viikari J, Pesonen EJ. Lowered levels of serum albumin and HDL-cholesterol in children with a recent mild infection. Ann Med. 2006;38:154–60.
- Soran H, Hama S, Yadav R, Durrington PN. HDL functionality. Curr Opin Lipidol. 2012;23:353–66.
- Murch O, Collin M, Hinds CJ, Thiemermann C. Lipoproteins in inflammation and sepsis. I. Basic science. Intensive Care Med. 2007;33:13–24.
- Chiarla C, Giovannini I, Giuliante F, Zadak Z, Vellone M, Ardito F, et al. Severe hypocholesterolemia in surgical patients, sepsis, and critical illness. J Crit Care. 2010;25:361.e7–12.
- Expert panel on integrated guidelines for cardiovascular health and risk reduction in children and adolescents [on-line]. National Heart, Lung, and Blood Institute; 2012 Oct. Available from: http://www.nhlbi.nih.gov/guidelines/cvd_ped/index.htm. [Accessed on 19 Jun 2014].
- Xavier HT, Izar MC, Faria Neto JR, Assad MH, Rocha VZ, Sposito AC, et al. V Diretriz Brasileira de Dislipidemias e Prevenção da Aterosclerose. Arq Bras Cardiol. 2013;101:1–20.
- WHO child growth Standards [on-line]. Available from: http://www.who.int/childgrowth/standards/bmi_for_age/en/e http://www.who.int/growthref/who2007_bmi_for_age/en/ [Accessed on 22 April 2014].
- May AL, Kuklina EV, Yoon PW. Prevalence of abnormal lipid levels among Youths-United States, 1999–2006 (Reprinted from MMWR, vol 59, pg 29–33, 2010). JAMA. 2010;303:930–3.
- Kit BK, Carroll MD, Lacher DA, Sorlie PD, DeJesus JM, Ogden CL. Trends in serum lipids among US youths aged 6 to 19 years, 1988–2010. JAMA. 2012;308:591–600.
- Moura EC, de Castro CM, Mellin AS, de Figueiredo DB. Lipid profile among school children in Campinas, Brazil. Rev Saude Publica. 2000;34:499–505.
- Giuliano IC, Coutinho MS, Freitas SF, Pires MM, Zunino JN, Ribeiro RQ. Serum lipids in school kids and adolescents from Florianópolis, SC, Brazil –Healthy Floripa 2040 study. Arq Bras Cardiol. 2005;85:85–91.
- Alcântara Neto OD, Silva Rde C, Assis AM, pinto Ede J. Factors associated with dyslipidemia in children and adolescents enrolled in public schools of Salvador, Bahia. Rev Bras Epidemiol. 2012;15:335–45.
- Cappi SB, Noritomi DT, Velasco IT, Curi R, Loureiro TCA, Soriano FG. Dyslipidemia: a prospective controlled randomized trial of intensive glycemic control in sepsis. Intensive Care Med. 2012;38:634–41.
- van Leeuwen HJ, Heezius E, van Strijp JAG, van Kessel KPM, Dallinga GM, Verhoef J. Lipoprotein metabolism in patients with severe sepsis. Crit Care Med. 2003;31:1359–66.
- Vermont CL, den Brinker M, Kakeci N, de Kleijn ED, de Rijke YB, Joosten KFM, et al. Serum lipids and disease severity in children with severe meningococcal sepsis. Crit Care Med. 2005;33:1610–15.
- Grion CMC, Cardoso LTQ, Perazolo TF, Garcia AS, Barbosa DS, Morimoto HK, et al. Lipoproteins and CETP levels as risk factors for severe sepsis in hospitalized patients. Eur J Clin Invest. 2010;40:330–8.
- Chien JY, Jerng JS, Yu CJ, Yang PC. Low serum level of high-density lipoprotein cholesterol is a poor prognostic factor for severe sepsis. Crit Care Med. 2005;33:1688–93.
- Lekkou A, Mouzaki A, Siagris D, Ravani I, Gogos CA. Serum lipid profile, cytokine production, and clinical outcome in patients with severe sepsis. J Crit Care. 2014;29:723–7.
- Tall AR. PLASMA high density lipoproteins. Metabolism and relationship to atherogenesis. J Clin Invest. 1990;86:379–84.
- Rosenson RS, Brewer HB Jr, Davidson WS, Fayad ZA, Fuster V, Goldstein J, et al. Cholesterol Efflux and atheroprotection: advancing the concept of reverse cholesterol transport. Circulation. 2012;125:1905–19.
- Liuba P, Persson J, Luoma J, Yla-Herttuala S, Pesonen E. Acute infections in children are accompanied by oxidative modification of LDL and decrease of HDL cholesterol, and are followed by thickening of carotid intima-media. Eur Heart J. 2003;24:517–23.
- Marsche G, Saemann MD, Heinemann A, Holzer M. Inflammation alters HDL composition and function: implications for HDL raising therapies. Pharmacol Ther. 2013;137:342–51.
- Hudgins LC, Parker TS, Levine DM, Gordon BR, Saal SD, Liang XC, et al. A single intravenous dose of endotoxin rapidly alters serum lipoproteins and lipid transfer proteins in normal volunteers. J Lipid Res. 2003;44:1489–98.
- Birjmohun RS, van Leuven SI, Levels JHM, van 't Veer C, Kuivenhoven JA, Meijers JCM, et al. High-density lipoprotein attenuates inflammation and coagulation response on endotoxin challenge in humans. Arterioscler Thromb Vasc Biol. 2007;27:1153–8.
- Imai T, Fugita T, Yamazaki Y. Beneficial effects of apolipoprotein A-I on endotoxemia. Surg Today. 2003;33:684–7.
- Jiao Y-I, Wu M-P. Apolipoprotein A-I diminishes acute lung injury and sepsis in mice induced by lipoteichoic acid. Cytokine. 2008;43:83–7.
- Guo L, Ai J, Zheng Z, Howatt DA, Daugherty A, Huang B, et al. High density lipoprotein protects against polymicrobe-induced sepsis in mice. J Biol Chem. 2013;288:17947–53.