Abstract
A scavenger receptor of the B class (SR-BI)/human homolog of SR-BI, CD36, and LIMP II analogous-1 (CLA-1), has been identified as a receptor for high-density lipoprotein (HDL). Mice lacking SR-B1 develop anemia, plausibly explained by the observation that the erythrocyte life-span in these animals is reduced. Erythropoietin (EPO) is known to promote survival of erythroid cells, in large part through protection from apoptosis. We have examined the role of EPO on hSR-BI/CLA-1 expression and erythrocyte apoptosis. Endogenous expression of hSR-BI/CLA-1 was increased by exposure to EPO. EPO increased transcriptional activity of hSR-BI/CLA-1 promoter. The stimulatory effect of EPO on hSR-BI/CLA-1 promoter activity was abrogated by LY294002, specific inhibitor of phosphatidylinositol-3 kinase (PI3K). Constitutively active Akt stimulates the activity of the hSR-BI/CLA-1 promoter and a dominant-negative mutant of Akt abolished the ability of EPO to stimulate promoter activity. Finally, EPO in combination with HDL protected the cell from apoptosis, which suggests that hSR-BI/CLA-1 induced by EPO might contribute to the erythrocyte life-span.
Key words::
Key messages
Erythropoietin (EPO) in combination with high-density lipoprotein protected the cell from apoptosis.
The hSRr-BI/CLA-1 induced by EPO might contribute to the erythrocyte life-span.
| Abbreviations | ||
| Akt-CA | = | constitutively active Akt |
| Akt-DN | = | a dominant negative form of Akt |
| AP-1 | = | transcription factor activator protein 1 |
| BIS | = | an inhibitor of protein kinase C; bisindolylmaleimide I |
| CLA-1 | = | human homolog of SR-BI |
| EDTA | = | ethylenediamine tetra-acetic acid |
| EPO | = | erythropoietin |
| ERK | = | extracellular signal-regulated kinase |
| FITC | = | fluorescein-isothiocyanate |
| HDL | = | high-density lipoproteinsh |
| Ig | = | immunoglobulin |
| MAPK | = | mitogen-activated protein kinase |
| PBS-T | = | 0.1% Tween 20 in PBS |
| PBS | = | phosphate buffer saline |
| PCRs | = | polymerase chain reactions |
| PD | = | an inhibitor of mitogen-activated ERK; PD98059 |
| PI | = | propidium iodide |
| PI3K | = | phosphatidylinositol-3 kinase |
| PTEN | = | a phosphatase and tensin homolog deleted on chromosome 10 |
| RPMI | = | Roswell Park Memorial Institute |
| SB | = | an inhibitor of p38-MAPK; SB203580 |
| SR-BI | = | scavenger receptor class BI |
| SR-BI/ | = | a scavenger receptor of the B class / |
| CLA-1 | = | human homolog of SR-BI |
| LY | = | an inhibitor of PI3K; LY294002 |
Introduction
Normal erythrocyte production is a function of the proliferation, death, and differentiation of erythroid progenitor cells. Erythropoietin (EPO) is the principal trophic hormone that controls red cell production by regulating apoptosis of erythroid progenitor cells (Citation1). EPO acts through cell surface receptors on immature erythroid cells (Citation2). The EPO receptor does not have a kinase domain and transmits an intracellular signal by interacting with cytoplasmic non-receptor tyrosine protein kinases. Known substrates of tyrosine protein kinases activated by EPO binding to its receptor include phosphatidylinositol-3 kinase (PI3K) and other signal transduction pathways (Citation3,Citation4).
High-density lipoproteins (HDL) play a critical role in cholesterol metabolism because they mediate a normal physiologic process, so-called reverse cholesterol transport (Citation5,Citation6). The mouse scavenger receptor class BI (SR-BI) mediated selective uptake of HDL cholesterol ester into transfected Chinese hamster ovary cells (Citation7). Our previous reports showed that hSR-BI/CLA-1 (a scavenger receptor of the B class / human homolog of SR-BI), like mouse SR-BI, functions as a receptor for HDL (Citation8,Citation9). A previous report indicated that disruption of SR-BI in mice results in a dramatic increase in the plasma HDL cholesterol level (Citation10). Interestingly, mice lacking SR-BI also develop anemia, as evidenced by the accumulation of reticulocytes in the circulation (Citation10). Meurs et al. (Citation11) reported that SR-BI is essential not only for HDL cholesterol homeostasis and atherosclerosis susceptibility, but also for maintaining normal erythrocyte life-span. In the present study, we examined the role of EPO in hSR-BI/ CLA-1 expression in a human erythroblastic cell line.
Material and methods
A previous report showed that not only EPO receptor but also hSR-BI/CLA-1 are expressed in HEL cells (Citation12), a human erythroleukemia cell line derived from peripheral blood of a patient with Hodgkin’s disease who later developed erythroleukemia, which is capable of globin synthesis and has both erythroid and megakaryocytic characteristics (Citation13,Citation14). HEL cells (Japanese Collection of Research Bioresources, Osaka, Japan) were grown in RPMI 1640 medium supplemented with 10% inactivated fetal bovine serum (FBS). Human HDL (d = 1.070–1.20 g/mL) and human LDL (d = 1.018–1.062 g/mL) were isolated by preparative ultracentrifugation from fresh plasma collected in EDTA (1 mg/mL) as described (Citation15). HDL was passed through a heparin-Sepharose affinity column to remove particles containing apolipoprotein-E (Citation16).
Immunolocalization of hSR-BI/CLA-1
Bone-marrow was aspirated at the posterior iliac crest from healthy adult volunteers using a protocol approved by the institutional review board of the Kagawa University. After antigen retrieval, slides were incubated with a guinea-pig antibody directed against hSR-BI/CLA-1 or anti-glycophorin (Dako, Glostrup, Denmark) as described previously (Citation9).
Immunofluorescence staining
Formaldehyde-fixed, paraffin-embedded samples were serially cut into 4-μm-thick sections for staining. Antigens were retrieved by boiling the sections in 0.01 M citric buffer (pH 7.0) for 8 min The sections were incubated for 1 hourat room temperature with the primary antibodies mouse anti-human IgM for hSR-BI/CLA-1 and rabbit anti-human IgG (LifeSpan Biosciences, Inc., Seattle, WA) for glycophorin-A (GLY-A), and the final concentrations were 1:50 of both anti-hSR-BI/CLA-1 and anti-GLY-A antibodies. In all cases, isotype-matched monoclonal antibodies were used as a negative control. The sections were washed with PBS and then incubated for 30 minat room temperature in a 1:100 diluted cocktail of FITC conjugated goat anti-mouse IgM (Gene Tex, Inc., Irvine, CA) and Texas-Red conjugated sheep anti-rabbit IgG (Affinity Bioreagents, Inc., Rockford, IL). The sections were finally washed with PBS and mounted. Fluorescence signals and digital images were acquired with an Olympus FluoView™ FV1000 confocal laser scanning microscope (Olympus, Tokyo, Japan) and analyzed using FV10-ASW image analysis software (Version 1.5; Olympus).
Detection of apoptotic cells
HEL cells (106/mL) were cultured without FBS for 12 hours. The cells were incubated with or without 1 U/mL EPO for 36 hours and then exposed to the anti-tumor drug, 100μM etoposide for 12 hours. To examine the effect of HDL, after EPO treatment for 24 hours, HEL cells were exposed to 500μg/mL HDL for 12 hours. We measured the percentage of apoptotic cells by the propidium iodide (PI) method as described previously (Citation17). Phosphatidyl-serine externalization of apoptotic cells in the early stage was also visualized using annexin-V-FITC stain and flow cytometer (EPICScan; Counter, Hialeah, FL) according to the manufacturer’s instructions (Immunotech, Marseille, France).
Transfection of HEL cells and luciferase reporter gene assay
The reporter construct contained the hSR-BI/CLA-1 gene sequence spanning the region from −1200 to +2 as determined from the published sequence (Citation18). The AP-1 reporter gene used in our studies was purchased from Stratagene (La Jolla, CA). Purified reporter plasmid with or without the appropriate expression vectors or empty plasmid vector was transfected into HEL cells using the conventional cationic liposome transfection method as described previously (Citation19) (Lipofectamine; Life Technologies, Gaithersburg, MD). All assays were corrected for β-galactosidase activity, and the total amount of protein in each reaction was identical. Twenty-μL aliquots were taken for the luciferase assay, which was performed according to the manufacturer’s instructions (ToyoInk, Tokyo, Japan).
Plasmid preparation
Expression vectors encoding a constitutively active Akt, a dominant-negative mutant of Akt, a constitutively active p110 subunit, or a phosphatase and tensin homolog deleted on chromosome 10 (PTEN) were constructed as described previously (Citation20). The reporter construct contained the hSR-BI/CLA-1 gene sequence spanning the region from −1200 to +2 as determined from the published sequence (Citation18).
Western blot analysis
The proteins were re-suspended under reducing conditions, and 15 μg was fractionated by size on 7.5% sodium dodecyl sulfate (SDS) polyacrylamide gels and transferred to polyvinylidene difluoride membranes for immunoblotting. The membranes were blocked overnight at room temperature with 0.1% Tween 20 in PBS (PBS-T) containing anti-hSR-BI/CLA-1 antibody (diluted 1/3,000 from whole antiserum) (Citation8) or anti-GAPDH (glyceraldehyde 3-phospate dehydrogenase) antibody (Biomol Research, Plymouth Meeting, PA; diluted 1/1000).
Real-time reverse transcriptase polymerase chain reaction
Polymerase chain reactions (PCRs) were performed in a final volume of 20 μL in LightCycler (Roche, Mannheim, Germany) glass capillaries. The sequences of the forward and reverse hSR-BI/CLA-1 primers were 5’-TTGAACTTCTGGGCAAATG-3’ and 5’-TGGGGATGCCTTCAAACAC-3’, respectively. Each set of PCR reactions included water as a negative control and five dilutions of standard. Known amounts of DNA were then diluted to provide standards, and a regression curve of crossing points versus concentration was generated with the LightCycler. β-Actin was used as housekeeping standard.
Immunoblotting of Akt
Cells were lysed for 10 minin ice-cold buffer A (50 mM Tris-HCl, pH 7.5; 1 mM EDTA (ethylene glycol-bis-tetra-acetic acid); 1 mM EGTA; 0.5 mM Na3VO4; 0.1% 2-mercaptoethanol; 1% Triton X-100; 50 mM NaF; 5 mM sodium pyrophosphate; 10 mM Na-glycerophosphate; 0.1 mM phenylmethylsulfonylfluoride; 1 μM microcystin; and 1 μg/mL each of pepstatin, aprotinin, and leupeptin). The lysates were centrifuged, and the supernatants were collected. The supernatants containing protein concentrations of 20 μg/mL were used for immunoblotting according to standard procedures. Akt polyclonal antibody and total Akt were detected by using phosphorylation-independent antibodies (Upstate Biotechnology, Lake Placid, NY) as described previously (Citation21). The protein bands were visualized by chemiluminescence.
ELISA of phosphorylated Akt
Cells were lysed for 10 minin ice-cold buffer A. The lysates were centrifuged, and the supernatants were collected. The supernatants containing protein concentrations of 400 μg/mL were used for ELISA (enzyme-linked immunosorbent assay) according to the manufacturer’s instructions (R&D Systems, Minneapolis, MN).
Transfection of siRNA
The siRNAs were designed to target the following cDNA sequences: scrambled, 5′-CCAGTACCGCTACGCAAACGT-3′; and hSR-BI/CLA-1 siRNA, 5′-AACGTACGCATCGACCCCAGT-3′ (Nippon Bioservice, Kanagawa, Japan). Transfection of hSR-BI/CLA-1 siRNA was performed using siPORT amine (Ambion, CA).
Statistical analysis
Statistical comparisons were made possible through the use of one-way analysis of variance and Student’s t test, with P < 0.05 considered significant.
Results and discussion
The distribution of hSR-BI/CLA-1 protein in adult human bone-marrow cells was determined by immunostaining. Immunostaining with hSR-BI/CLA-1 antibody showed that immunoreactivity was highest in erythrocyte precursors with less immunoreactivity in megakaryocytes (). The identity of erythrocyte precursors and red blood cells was determined by positive cytoplasmic and membranous staining with anti-glycophorin-A (). The use of non-specific IgG failed to show staining in the cells ().
Figure 1. Effect of EPO on hSR-BI/CLA-1 expression. A: hSR-BI/CLA-1 expression in human bone-marrow cells. Immunohistochemical localization of hSR-BI/CLA-1 in normal human bone-marrow is shown. Immunoperoxidase staining of hSR-BI/CLA-1 (i) (×200), (ii) (×400), or anti-glycophorin-A (iii) (×400) is present in the cytoplasm or membrane of erythroblasts, and tissue stained with control IgG (iv) (×400) is negative. The blue staining as counterstain is hematoxylin staining. Localization of the hSR-BI/CLA-1 and GLY-A in normal erythroid cells were observed by fluorescence microscopy. Sections were double-stained with anti-hSR-BI/CLA-1 and anti-GLY-A labeled with FITC and Texas-Red, respectively, as described in the Materials and methods section. The expression of hSR-BI/CLA-1 (green) (×400) (v) and GLY-A (red) (×400) (vi) was observed in the cells from a bone-marrow aspirated sample. Co-localization of hSR-BI/CLA-1 and GLY-A in the same cells was shown by merged images (yellow) (×400) (vii). Tissue stained with control IgM (viii) or IgG (ix) (×400) as the first antibody is negative. B, C: Effect of EPO on hSR-BI/CLA-1 protein (B) or mRNA (C) expression in HEL cells. HEL cells were incubated in the presence or absence of EPO for 24 hours. Control HEL cells were incubated in the absence of EPO. hSR-BI/CLA-1 protein or mRNA was detected by Western blot analysis probed with an anti-CLA-1 antibody or real-time PCR method, respectively. Abundance of GAPDH served as a control and is shown at the bottom of each lane (Cont = control; EPO(1) = 1 U/mL EPO; EPO(10) = 10 U/mL EPO). The ratio of hSR-BI/CLA-1/GAPDH or hSR-BI/CLA-1/β-actin is shown as per cent of control in the figure. Each data point shows the mean and SEM (n = 3) of separate experiments. The asterisk denotes a significant difference with that in the control HEL cells (cont) (P < 0.05).
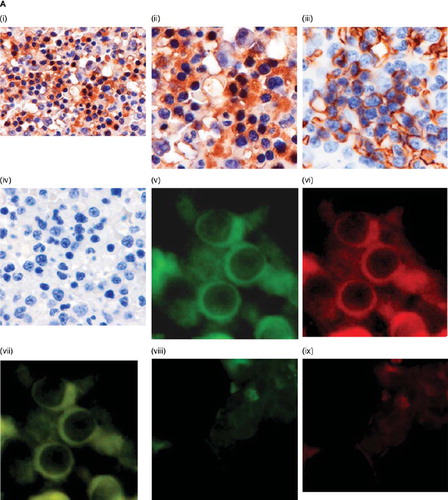
To confirm the co-localization of hSR-BI/CLA-1 and glycophorin-A on normal erythroid cells, immunofluorescence analysis using a confocal laser scanning microscope was performed. Merged images of immunofluorescence showed yellow coloration, indicating that distinct co-localization of the hSR-BI/CLA-1 protein and glycophorin-A was observed in a cytosol part of erythroid cells (). The use of non-specific IgM or IgG failed to show staining in the cells ().
To analyze the effect of EPO on hSR-BI/CLA-1 expression, we measured the level of endogenous hSR-BI/CLA-1 expression in HEL cells by Western blot analysis. Exposure of HEL cells to EPO increased the level of hSR-BI/CLA-1 protein in a dose-dependent manner compared with that in cells maintained in control media (). To further confirm this observation, we used real-time PCR analysis to assess hSR-BI/CLA-1 mRNA in the cells. Results () showed an increase in the abundance of hSR-BI mRNA following treatment with EPO, but expression of β-actin did not change. These results show clearly that EPO stimulates the expression of hSR-BI/CLA-1 in HEL cells.
We studied whether EPO up-regulated hSR-BI/CLA-1 expression in HEL cells by inducing changes in hSR-BI/CLA-1 promoter activity using transient transfections of HEL cells with a reporter that contained the hSR-BI/CLA-1 gene segment extending from −1200 to +2 (, , ). Consistently with the observed changes in the level of hSR-BI/CLA-1 protein, EPO stimulated the reporter gene activity in HEL cells. Thus, EPO increases hSR-BI/CLA-1 promoter transcriptional activity.
Figure 2. A: Effect of EPO on hSR-BI/CLA-1 promoter activity. Effect of inhibitors of various signaling pathways on EPO-induced up-regulation of hSR-BI/CLA-1 transcriptional activity in HEL cells. The effects of a p38 mitogen-activated protein kinase SB203580 (SB), a MAPK/ERK kinase 1 (MEK1) inhibitor PD98059 (PD), a protein kinase C (PKC) inhibitor bisindolylmaleimide I (BIS), a PI3K inhibitor LY294002 (LY), or no treatment (cont) on EPO (1 U/mL)-stimulated hSR-BI/CLA-1 transcriptional activity in HEL cells are shown. Each data point shows the mean ± SEM of three separate transfections that were performed on separate days. The asterisk denotes a significant difference (P < 0.05) (NS = no significant difference). B: Role of the PI3K/Akt signal transduction pathway on hSR-BI/CLA-1 promoter activation by EPO. Effects of PI3K components on hSR-BI/CLA-1 promoter activity. HEL cells were transfected with CLA-1 promoter inserted into the luciferase reporter gene (pCLA-LUC) and empty vector (cont), empty vector plus EPO treatment (EPO), P110 expression vector (P110), Akt-constitutive active form expression vector (Akt-CA), or PTEN expression vector (PTEN) for 24 hbefore cell harvest. The results were expressed as relative luciferase activity compared to that in control cells that was arbitrarily set at 100. Each data point shows the mean ± SEM of four separate transfections that were performed on separate days. The asterisk denotes a significant difference (P < 0.05). C: Effect of EPO on hSR-BI/CLA-1 promoter activity was blocked in cells expressing a dominant negative form of Akt (Akt-DN). HEL cells were transfected with pCLA-LUC and empty vector (control), empty vector plus EPO treatment (EPO), or a dominant negative Akt (Akt-DN) plus EPO treatment. The results were expressed as relative luciferase activity compared to that in control cells that was arbitrarily set at 100. Each data point shows the mean ± SEM of four separate transfections that were performed on separate days. The asterisk denotes a significant difference (P < 0.05) (NS = no significant difference). D: Effect of EPO on hSR-BI/CLA-1 protein expression in HEL cells and PI3K inhibitor (LY294002) blocked the actions of EPO. HEL cells were exposed to 1 U/mL EPO and LY294002 for 24 h The hSR-BI/CLA-1 protein was detected using Western blot analysis probed with an anti-hSR-BI/CLA-1 antibody, respectively. The ratio of hSR-BI/CLA-1/GAPDH was shown as per cent of control in the figure. Each data point shows the mean and SEM (n = 3) of separate experiments. Abundance of GAPDH served as a control and is shown at the bottom of each lane. The asterisk denotes a significant difference with that in the control HEL cells (cont) (P < 0.05) (NS = no significant difference; Cont = control; EPO = 1 U/mL EPO; LY = LY294002-treated; LY/EPO = EPO and LY294002-treated).
To clarify the signaling pathway, we used known inhibitors of signaling pathways to disrupt EPO induction of hSR-BI/CLA-1 promoter activity. We added compounds that inhibit PI3K (10 μM LY294002), mitogen-activated ERK (extracellular signal-regulated kinase) (10 μM PD98059), protein kinase C (1 μM bisindolylmaleimide I), or p38-MAPK (mitogen-activated protein kinase) (1 μM SB203580) prior to exposing transfected HEL cells to EPO. The results showed that inhibitors of the ERK kinase, protein kinase C, or p38-MAPK pathways had no effect on the action of EPO, but LY294002, an inhibitor of PI3K, abrogated the growth factor’s ability to induce hSR-BI/CLA-1 expression (). A PI3K inhibitor LY294002 (LY) blocked the actions of EPO at the level of hSR-BI/CLA-1 protein () or mRNA (data not shown) in HEL cells. These observations suggest that the actions of EPO are mediated by the PI3K cascade.
Since Akt is one of the downstream components of the PI3K cascade, we wondered whether it participates in EPO induction of hSR-BI/CLA-1 expression. Akt phosphorylation was detected within 15 minfollowing treatment of HEL cells with EPO (data not shown). To further confirm the roles of PI3K and Akt in the expression of hSR-BI/CLA-1 induced by EPO in HEL cells, we postulated that expressing the p110 catalytic subunit of PI3K or constitutively active Akt (Akt-CA) should induce hSR-BI/CLA-1 expression. As in the preceding studies (), there was a 1.5-fold increase in luciferase activity following EPO stimulation. Consistently with our prediction, both p110 and constitutively active Akt increased hSR-BI/CLA-1 promoter activity without exposure to EPO (). Akt phosphorylation is negatively regulated by PTEN/MMAC1/TEP1, a tumor suppressor gene product. This protein is a phosphatase that dephosphorylates the 3’ position to reverse the reactions catalyzed by PI3K (Citation22). The over-expression of PTEN reduced hSR-BI/CLA-1 promoter activity (). Further, the effect of EPO on hSR-BI/CLA-1 promoter activity was blocked in cells expressing a dominant negative form of Akt (Akt-DN) (). Together, these findings support that the PI3K/Akt pathway is required for EPO induction of hSR-BI/CLA-1 expression in HEL cells.
EPO is known to promote the survival of erythroid cells, in large part through protection from apoptosis (Citation1,Citation23). HDL also has anti-apoptotic effects on various cell types (Citation24). Our results showed that EPO increased the expression of hSR-BI/CLA-1 on HEL cells. We wondered whether the HDL-hSR-BI/CLA-1-mediated anti-apoptotic effect is modulated by EPO treatment. The results of a standard apoptosis assay showed the expected effect of etoposide on HEL cells, giving rise to typical features of apoptosis. EPO failed to suppress apoptosis in HEL cells treated with etoposide (). The addition of HDL alone also failed to protect the cells from apoptosis. The results of an annexin-V method also showed that HEL cells exposed to HDL after EPO treatment were protected from apoptosis caused by etoposide. But the addition of EPO or HDL alone failed to protect the cells from apoptosis (data not shown). Although the protective effect of EPO/HDL is not complete but partial, these results suggested that the treatment of the cells with HDL but not LDL after EPO is important to protect the cells from apoptosis ().
Figure 3. A: Anti-apoptotic effect of EPO/HDL treatment. Induction of apoptosis of HEL cells by etoposide was performed as described in the Material and methods section. The percentage of apoptotic cells was measured by the propidium iodide (PI) method. Positive cells in every 10,000 cell-count within each assay were detected as apoptotic cells. Each data point shows the mean and SEM (n = 3) of separate experiments. The asterisk denotes a significant difference (P < 0.05) (NS = no significant difference; cont = HEL cells without treatment; Etopo = HEL cells were treated with 100 μM etoposide; EPO/Etopo = etoposide 100 μM + EPO treatment; EPO/HDL-24/Etopo = etoposide 100 μM + EPO treatment + HDL treatment; HDL-24 h/Etopo = etoposide 100 μM + HDL treatment). B: Anti-apoptotic effect of EPO/LDL treatment. Induction of apoptosis of HEL cells by etoposide was performed as described in the Material and methods section. After HEL cells were incubated with or without 1 U/mL EPO for 24 h the cells were exposed with 200 μg/mL or 400 μg/mL LDL for 12 hbefore induction of apoptosis. The percentage of apoptotic cells was measured by the propidium iodide (PI) method. Positive cells in every 10,000 cell-count within each assay were detected as apoptotic cells. Each data point shows the mean and SEM (n = 3) of separate experiments (NS = no significant difference; cont = HEL cells with no treatment; Etopo = HEL cells were treated with 100 μM etoposide; EPO/Etopo = etoposide 100 μM + EPO 1 U/mL treatment; EPO/LDL/Etopo = etoposide 100 μM + EPO 1 U/mL treatment + LDL 200 μg/mL treatment; LDL/Etopo = etoposide 100 μM + LDL 200 μg/mL treatment).
To further characterize the role of hSR-BI/CLA-1 in the anti-apoptotic effect of EPO and HDL, we have used siRNA to block hSR-BI/CLA-1-expression. Initial studies showed that the expression of hSR-BI/CLA-1 was inhibited by hSR-BI/CLA-1 siRNA treatment but not by a scrambled siRNA (). Next, HEL cells were exposed to hSR-BI/CLA-1 specific or scrambled siRNA and then treated with EPO and HDL. As shown in , EPO and HDL treatment did not attenuate the apoptosis of HEL cells knocked-out hSR-BI/CLA-1 by siRNA following exposure to etoposide. Previously we reported that PI3K signaling is involved in SR-BI/CLA-1-mediated HDL effects (Citation25,Citation26). To analyze the PI3K signal transduction pathway that is involved in HDL-stimulated anti-apoptotic effect, we studied the effect of the pharmacological inhibitor used in the above studies. The result showed that it was sensitive to the inhibitor for PI3K (data not shown). These findings may be consistent with the idea that the anti-apoptotic effect of the treatment of EPO and HDL requires hSR-BI/CLA-1. Meurs et al. reported that erythrocyte turn-over was analyzed in SR-BI-deficient mice and wild-type litter-mates. Interestingly, the life-span of erythrocytes in SR-BI-deficient mice was dramatically reduced. In response to the shortened life-span of the erythrocytes in SR-BI- deficient mice, markers of erythropoiesis were enhanced. SR-BI thus plays an important role not only in HDL cholesterol homeostasis and atherosclerosis susceptibility, but also in maintaining normal erythrocyte life-span in mouse models (Citation11). However, the mechanisms have not been clarified yet. Our results may suggest one of the mechanisms for the role of hSR-BI/CLA-1 on erythrocyte life-span.
A previous report indicated that tumor necrosis factor (TNF)-α-induced endothelial cell apoptosis is also inhibited by HDL, and this is associated with attenuated induction of CPP32-like protease (caspase 3), which is a component of all primary apoptotic pathways (Citation27). Our recent studies showed that HDL induces AP-1 activity via the PI3K/Akt signaling pathway and participates in HDL-hSR-BI/CLA-1-mediated anti-apoptosis (Citation25,Citation26). In this study, our results ( and ) showed that the combined treatment of EPO and HDL activated the Akt phosphorylation and AP-1 activity much more than EPO or HDL treatment alone. The hSR-BI/CLA-1 expression level in HEL cells is relatively low compared to other cell lines, and therefore the combination of EPO and HDL might be required to protect these cells from apoptosis.
Figure 4. A: Knock-down of hSR-BI/CLA-1 by siRNA. The hSR-BI/CLA-1 protein (i) or mRNA (ii) expression in HEL cells was inhibited by hSR-BI/CLA-1 siRNA treatment but not by a scrambled siRNA. The hSR-BI/CLA-1 protein (i) or mRNA (ii) was detected using Western blot analysis probed with an anti-hSR-BI/CLA-1 antibody or real-time PCR method, respectively. The ratio of hSR-BI/CLA-1/GAPDH (i) or hSR-BI/CLA-1/β-actin (ii) was shown as per cent of control in the figure. Each data point shows the mean and SEM (n = 3) of separate experiments. Abundance of GAPDH served as a control and is shown at the bottom of each lane. The asterisk denotes a significant difference with that in the control HEL cells (cont) (P < 0.05). B: Effect of hSR-BI/CLA-1 knock-down on anti-apoptotic effect of EPO/HDL treatment. siRNA of hSR-BI/CLA-1 (si-hSR-BI/CLA-1) or scrambled siRNA (cont) was transfected into HEL cells, and the induction of apoptosis of HEL cells by etoposide with/without EPO/HDL treatment. The results were expressed as PI positive rate compared to that in the control cells that was arbitrarily set at 100. Each data point shows the mean ± SEM of three separate samples that were performed on separate days (Etopo = HEL cells were treated with 100 μM etoposide; EPO/HDL-24/Etopo = etoposide 100 μM + EPO treatment + HDL treatment; NS = no significant difference). The asterisk denotes a significant difference (P < 0.05). C: HEL cells were incubated with 1 U/mL EPO alone, 500 μg/mL HDL alone, or 500 μg/mL HDL for 20 minafter 1 U/mL EPO treatment for 24 h The quantification of phosphorylated Akt was determined by using ELISA. The results were expressed as relative compared to that in control cells which was arbitrarily set at 100. Each data point shows the mean and SEM of four separate ELISAs that were performed on separate days. The asterisk denotes a significant difference (P < 0.05) (cont = control; EPO = 1 U/mL EPO treatment; HDL = 500 μg/mL HDL treatment; EPO/HDL = 1 U/mL EPO-24 h and 500 μg/mL HDL). D: Effect of EPO and HDL on AP-1 transcriptional activity in HEL cells. HEL cells were transfected with 0.5 μg of pAP1-LUC and treated with 1 U/mL EPO and 500 μg/mL HDL for 24 hbefore cell harvest. All assays were corrected for b-galactosidase activity, and the total amounts of protein per reaction were identical. The results were expressed as relative luciferase activity compared with control cells arbitrarily set at 100. Each data point shows the mean and SEM of three separate transfections that were performed on separate days. The asterisk denotes a significant difference (P < 0.05) (Cont = Control; EPO = 1 U/mL EPO treatment; HDL = 500 μg/mL HDL treatment; EPO/HDL = 1 U/mL EPO and 500 μg/mL HDL for 24 h).
Further investigations are needed to clarify the inhibitory mechanism by which EPO-induced hSR-BI/CLA-1 protects cells from apoptosis.
Declaration of interest: The authors report no conflicts of interest. The authors alone are responsible for the content and writing of the paper.
Related Research Data
References
- Koury MJ, Bondurant MC. Erythropoietin retards DNA breakdown and prevents programmed death in erythroid progenitor cells. Science. 1990;248:378–81.
- Koury MJ, Bondurant MC. The molecular mechanism of erythropoietin action. Eur J Biochem. 1992;210:649–63.
- Miura O, Nakamura N, Ihle JN, Aoki N. Erythropoietin-dependent association of phosphatidylinositol 3-kinase with tyrosine-phosphorylated erythropoietin receptor. J Biol Chem. 1994;269:614–20.
- Taniguchi T. Cytokine signaling through nonreceptor protein tyrosine kinases. Science. 1995;268:251–55.
- Fielding CJ, Fielding PE. Molecular physiology of reverse cholesterol transport. J Lipid Res. 1995;36:211–28.
- Tall AR. Plasma high density lipoproteins. Metabolism and relationship to atherogenesis. J Clin Invest. 1990;86: 379–84.
- Acton S, Rigotti A, Landschulz KT, Xu S, Hobbs HH, Krieger M. Identification of scavenger receptor SR-BI as a high density lipoprotein receptor. Science. 1996;271:518–20.
- Murao K, Terpstra V, Green SR, Kondratenko N, Steinberg D, Quehenberger O. Characterization of CLA-1, a human homologue of rodent scavenger receptor BI, as a receptor for high density lipoprotein and apoptotic thymocytes. J Biol Chem. 1997;272:17551–7.
- Imachi H, Murao K, Cao W, Tada S, Taminato T, Wong NC, . Expression of human scavenger receptor B1 on and in human platelets. Arterioscler Thromb Vasc Biol. 2003;23: 898–904.
- Holm TM, Braun A, Trigatti BL, Brugnara C, Sakamoto M, Krieger M, . Failure of red blood cell maturation in mice with defects in the high-density lipoprotein receptor SR-BI. Blood. 2002;99:1817–24.
- Meurs I, Hoekstra M, van Wanrooij EJ, Hildebrand RB, Kuiper J, Kuipers F, . HDL cholesterol levels are an important factor for determining the lifespan of erythrocytes. Exp Hematol. 2005;33:1309–19.
- Calvo D, Vega MA. Identification, primary structure, and distribution of CLA-1, a novel member of the CD36/LIMPII gene family. J Biol Chem. 1993;268:18929–35.
- Martin P, Papayannopoulou T. HEL cells: A new erythroleukemia cell line with spontaneous and induced globin expression. Science. 1982;216:1233–5.
- Hong Y, Martin JF, Vainchenker W, Erusalimsky JD. Inhibition of protein kinase C suppresses megakaryocytic differentiation and stimulates erythroid differentiation in HEL cells. Blood. 1996;87:123–31.
- Havel RJ, Eder HA, Bragdon JH. The distribution and chemical composition of ultracentrifugally separated lipoproteins in human serum. J Clin Invest. 1955;34:1345–53.
- Murakami M, Horiuchi S, Takata K, Morino Y. Distinction in the mode of receptor-mediated endocytosis between high density lipoprotein and acetylated high density lipoprotein: evidence for high density lipoprotein receptor-mediated cholesterol transfer. J Biochem. 1987;101:729–41.
- Sayo Y, Murao K, Imachi H, Cao WM, Sato M, Dobashi H, . The multiple endocrine neoplasia type 1 gene product, menin, inhibits insulin production in rat insulinoma cells. Endocrinology. 2002;143:2437–40.
- Cao G, Garcia CK, Wyne KL, Schultz RA, Parker KL, Hobbs HH. Structure and localization of the human gene encoding SR-BI/CLA-1. Evidence for transcriptional control by steroidogenic factor 1. J Biol Chem. 1997;272: 33068–76.
- Yu X, Murao K, Imachi H, Cao WM, Li J, Matsumoto K, . Regulation of scavenger receptor class BI gene expression by angiotensin II in vascular endothelial cells. Hypertension. 2007;49:1378–84.
- Cao WM, Murao K, Imachi H, Yu X, Dobashi H, Yoshida K, . Insulin-like growth factor-i regulation of hepatic scavenger receptor class BI. Endocrinology. 2004;145: 5540–7.
- Murao K, Ohyama T, Imachi H, Ishida T, Cao WM, Namihira H, . TNF-α stimulation of MCP-1 expression is mediated by the Akt/PKB signal transduction pathway in vascular endothelial cells. Biochem Biophys Res Commun. 2000;276:791–6.
- Maehama T, Dixon JE. The tumor suppressor, PTEN/MMAC1, dephosphorylates the lipid second messenger, phosphatidylinositol 3,4,5-trisphosphate. J Biol Chem. 1998;273:13375–8.
- Bittorf T, Seiler J, Lüdtke B, Büchse T, Jaster R, Brock J. Activation of STAT5 during EPO directed suppression of apoptosis. Cell Signal. 2000;12:23–30.
- Suc I, Escargueil-Blanc I, Troly M, Salvayre R, Nègre-Salvayre A. HDL and ApoA prevent cell death of endothelial cells induced by oxidized LDL. Arterioscler Thromb Vasc Biol. 1997;17:2158–66.
- Cao WM, Murao K, Imachi H, Yu X, Abe H, Yamauchi A, . A mutant high-density lipoprotein receptor inhibits proliferation of human breast cancer cells. Cancer Res. 2004;64:1515–21.
- Murao K, Imachi H, Cao W, Yu X, Li J, Yoshida K, . High-density lipoprotein is a potential growth factor for adrenocortical cells. Biochem Biophys Res Commun. 2006; 344:226–32.
- Sugano M, Tsuchida K, Makino N. High-density lipoproteins protect endothelial cells from tumor necrosis factor-alpha-induced apoptosis. Biochem Biophys Res Commun. 2000;272:872–6.