
Abstract
During physical exercise, pulse transit time (PTT), expressed as the interval between ventricular electrical activity and peripheral pulse wave, may provide a surrogate estimate for blood pressure by the use of specific calibration procedures. The objective of this study was to determine systolic blood pressure (SBP) values derived from the PTT method and from an established method of non-invasive continuous blood pressure measurement based on the volume clamp technique, and to compare their agreement with sphygmomanometry during exercise tests. In 18 subjects, electrocardiogram (ECG) and finger-photoplethysmography were continuously recorded during maximal cycle exercise tests. Intermittent and continuous blood pressure measurements were simultaneously taken using automated sphygmomanometry and a Portapres Model-2 device, respectively. PTT was calculated for each ECG R-wave and the corresponding steepest upstroke slope in the photoplethysmogram, and was transformed to a continuous blood pressure estimate using multipoint nonlinear regression calibration based on the individual subject's sphygmomanometer readings. Bland–Altman limits of agreement between PTT-derived SBP estimates and sphygmomanometer values were –24.7 to 24.1 mmHg, and between Portapres and sphygmomanometer SBP values were –42.0 to 70.1 mmHg. For beat-to-beat SBP estimation during exercise, PTT measurement combined with multipoint nonlinear regression calibration based on intermittent sphygmomanometry may be an alternative to volume clamp devices.
Introduction
Pulse transit time (PTT) is defined as the time required for the pulse pressure wave to travel between two arterial sites, and can be easily estimated from the time interval between the R-wave of the electrocardiogram (ECG) and the peripheral arrival of the photoplethysmographic pulse wave (Citation1). It is assumed to be an index of arterial stiffness and cardiac output and, according to current knowledge, PTT is inversely related to systolic blood pressure (SBP) (Citation1–8). With increasing blood pressure, increasing arterial distending pressure and decreasing arterial compliance, pulse-wave velocity increases and thus PTT shortens (Citation1). Several authors have therefore proposed and investigated PTT as a potential surrogate measure for blood pressure changes (Citation9–15).
However, estimating blood pressure values from PTT is still a major challenge considering that the relationship between PTT and blood pressure varies widely from one subject to another (Citation4,Citation5,Citation11,Citation13,Citation14). Accordingly, several techniques to individually calibrate PTT measurements to arterial blood pressure have been proposed (Citation9–15). Depending on the specific field of application, PTT calibration algorithms are typically based on a given linear or nonlinear regression model and one or more single blood pressure readings obtained by sphygmomanometry at rest or when performing physical exercise, which are used to determine the subject's individual calibration parameters. In this context, a recent study demonstrated that, during cycle exercise, accurate beat-to-beat SBP estimates may be derived from PTT using a nonlinear regression formula and multiple calibration points from intermittently acquired sphygmomanometer measurements (Citation13).
At present, several devices are commercially available that measure beat-to-beat blood pressure non-invasively, most of them using the volume clamp (vascular unloading) method described by Peñáz in 1973 (Citation16). With this method, continuous arterial blood pressure is estimated from the servo-modulated pressure required for an inflatable finger cuff to maintain constant arterial size and transmural pressure in the finger. Some devices, such as Portapres Model-2, additionally provide a height correction unit to compensate for vertical finger positions. However, volume clamp devices have some drawbacks in terms of complex, vulnerable technology, large device size and cost.
Therefore, the present study was conducted to explore whether PTT-derived blood pressure estimation using multipoint nonlinear regression calibration based on intermittent sphygmomanometer readings could be an alternative to volume clamp devices in situations where beat-to-beat SBP monitoring over a wide range of blood pressure levels is required.
Methods
Subjects
Eighteen consecutive subjects from a cardiopulmonary unit who were referred for cardiopulmonary exercise testing (CPET) were prospectively enrolled into the study. Inclusion criteria were age 18 years or older and a documented clinical indication for CPET. Subjects were excluded if they had acute or life-threatening disease, congestive heart failure NYHA (New York Heart Association) class IV, difference in SBP or diastolic blood pressure (DBP) between arms greater than 10 mmHg or SBP at rest exceeding 200 mmHg. The protocol was approved by the local ethics committee and all subjects gave informed consent.
Measurement procedure
Subjects underwent maximal CPET on a semi- recumbent cycle ergometer (Ergoselect 1000; Ergoline, Bitz, Germany) using a standard continuously incremental ramp exercise protocol until individual exhaustion. The initial workload was 0 W and was linearly increased by individualized work rate increments to provide the maximal exercise level after approximately 10 min (Citation17). The test procedure included an additional 10 minute reference period before exercise and a 10 min recovery period after exercise.
Right arm blood pressure was measured every 2 min via an appropriately sized upper arm cuff, using the ergometer's automated combined auscultatory and oscillometric blood pressure module.
For continuous blood pressure recording, Portapres Model-2 equipment (Finapres Medical Systems, Amsterdam, The Netherlands) was mounted next to the ergometer. Appropriately sized finger cuffs were attached to two digits of the left hand, and the height correction unit was placed and nulled according to the manufacturer's instructions.
For PTT measurement, a polygraphy system (SOMNOlab 2/s; Weinmann, Hamburg, Germany) was used to record additional single-channel ECG and left-arm standard finger-photoplethysmography at 256 Hz and 50 Hz, respectively. Subjects were instructed to avoid upper limb movement during the study procedure.
Signal processing
Biosignal processing using SOMNOmat (version 1.0; C. Fischer, Germany) included time synchronization of Portapres and SOMNOlab data, as well as automated beat-to-beat PTT calculation as determined by the time intervals between each R-wave in the ECG and the steepest slope of the corresponding upstroke in the finger-photoplethysmography signal. To compensate for sample rate- and movement- associated interference, each resulting PTT curve was translated using a moving average curve with a window length of 20 s (from –10 s to 10 s). For the purpose of maintaining comparability, the same moving average procedure was applied to beat-to-beat Portapres blood pressure curves.
For each individual subject, data sets were created which included sphygmomanometer SBP values paired with the corresponding, time-synchronized PTT and Portapres SBP values. In these data sets, the assignment of PTT and Portapres values to sphygmomanometer values was done at 11 reference points where instantaneous sphygmomanometer values were available: two points during reference period (P1, P2), one point before the start of exercise (P3), three points during increasing exercise (P4, P5, P6), one point near maximum exercise (P7), two points after maximum exercise (P8, P9) and two points during recovery (P10, P11), using the following rules: P1: the first available blood pressure (BP) value during the reference period; P2: the second available BP value during the reference period; P3: the last available BP value during the reference period; P4: the first available BP value during increasing exercise; P5 the closest available BP value at half-maximum exercise; P6: the last available BP value during increasing exercise previous to P7; P7: the closest available BP value at maximum exercise; P8: the first available BP value after maximum exercise; P9: the second available BP value after maximum exercise; P10: the penultimate available BP value during recovery; and P11: the last available BP value during recovery.
If either the Portapres value or the PTT value was not available at a sphygmomanometer reference point, the reference point was excluded from further analysis.
Calibration
The relation between SBP and PTT was expressed as a simplified nonlinear function:
which was derived from the Moens–Korteweg equation as previously published (Citation13). With this function, nonlinear regression was performed separately for the data sets of each subject for determination of the subject's individual coefficients a, b and c. Goodness of fit of each individual calibration curve was quantified using the R² value. Owing to the comparative nature of this study, the subjects’ individual regression coefficients were specifically recalculated separately for each reference point (n = 11) based on a set of n – 1 data points, to ensure that the calibration procedures and subsequent comparison procedures related to different sets of data.
Using the resulting individual coefficients, each PTT value was translated to a PTT-derived, calculated SBP estimate.
Statistical analysis
Bland–Altman plots were used to assess the within-subject and overall agreements between sphygmomanometer SBP values and PTT-derived SBP estimates and accordingly between sphygmomanometer SBP values and Portapres SBP values in all data sets (Citation18). Limits of agreement were defined as average difference ± 1.96 standard deviation (SD). Overall correlations between sphygmomanometer SBP values and PTT-derived or Portapres SBP values were evaluated using Pearson's correlation coefficient (r).
Data are reported as mean ± SD unless otherwise stated. All data were analyzed with GraphPad Prism (version 5; GraphPad Software, La Jolla, CA, USA).
Results
Subject characteristics and cardiopulmonary exercise testing outcome
Subject characteristics are shown in . Clinical indications for CPET were pulmonary diseases in the majority of subjects (78%). One-third of the subjects were treated with antihypertensive medication. All of the 18 subjects completed the exercise protocol until individual exhaustion. Observed limitations to maximal exercise were either respiratory or muscle-induced, or both (). Higher mean volume clamp SBPs than mean sphygmomanometer SBPs could be observed at rest, under maximum exercise and during recovery ().
Table I. Subject characteristics.
Table II. Exercise test results.
Nonlinear regression and calibration
In all subjects, individual coefficients a, b and c could be determined by non-linear regression, resulting in 18 individual nonlinear calibration functions (, ). After translation of PTT values to SBP estimates using these individual calibration functions, close similarity between mean PTT-derived SBP estimates and mean systolic sphygmomanometer values at rest, under maximum exercise and during recovery could be observed (, ).
Figure 1. Plot of the 18 nonlinear calibration functions derived from the 18 individual data sets of systolic blood pressure and pulse transit time.
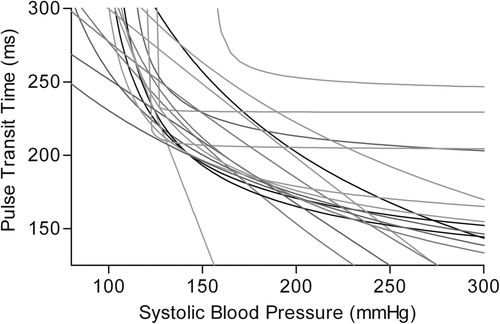
Figure 2. Box plot of pulse transit time (PTT) and corresponding sphygmomanometer systolic blood pressure (SBP), PTT-derived SBP estimate and volume clamp (Portapres) SBP at reference points P1–P11. The line through the box indicates the median, the box represents the interquartile range, and the whiskers represent the full range of values.
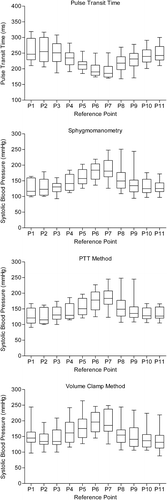
Table III. Bland–Altman comparisons: agreement between sphygmomanometer systolic blood pressure (SBP) values and pulse transit time (PTT)-derived SBP estimates, and between sphygmomanometer SBP values and volume-clamp derived SBP (Portapres).
Within-subject agreement
In the majority of subjects, observed bias and limits of agreement were smaller in the Bland–Altman comparisons between SBP measured by the sphygmomanometer and PTT-derived SBP estimates than in the comparisons between SBP measured by the sphygmomanometer and SBP measured by the volume clamp (Portapres) technique, or were similar ().
Overall agreement and correlation analysis
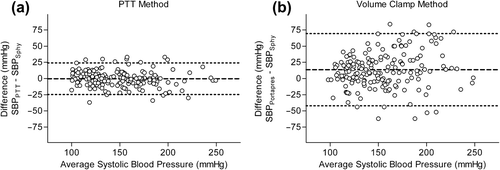
In the overall Bland–Altman comparisons, smaller bias (–0.3 ± 12.4 mmHg vs 14.0 ± 28.5 mmHg) and limits of agreement (–24.7 to 24.1 mmHg vs –42.0 to 70.1 mmHg) were observed in the comparisons between SBP measured by the sphygmomanometer and PTT-derived SBP estimates than in the comparisons between SBP measured by the sphygmomanometer and SBP measured by the volume clamp (Portapres) technique (, ). Correlation analysis yielded Pearson correlations of r = 0.93 (p < 0.001) between sphygmomanometer SBP and PTT-derived SBP estimates, and r = 0.70 (p < 0.001) between sphygmomanometer SBP and volume clamp (Portapres) SBP.
Figure 3. Bland–Altman plots. The outer lines indicate the limits of agreement, the inner line represents the mean difference. (a) Bias (–0.3 ± 12.4 mmHg) and limits of agreement (–24.7 to 24.1 mmHg) between systolic blood pressure measured by arm cuff sphygmomanometer (SBPSphy) and pulse transit time (PTT)-derived systolic blood pressure estimate (SBPPTT). (b) Bias (14.0 ± 28.5 mmHg) and limits of agreement (–42.0 to 70.1 mmHg) between systolic blood pressure measured by arm cuff sphygmomanometer (SBPSphy) and systolic blood pressure measured by volume clamp technique using Portapres Model-2 (SBPPortapres).
Discussion
The aim of this study was to investigate the ability of continuous PTT measurement, combined with simultaneous intermittent sphygmomanometry for personal nonlinear multipoint calibration, to provide an SBP estimate over a wide range of blood pressure levels during exercise as a comparable alternative to established techniques of beat-to-beat non-invasive blood pressure monitoring. First of all, the present findings indicate that it is possible, with the simple methods described in this paper using recordings from standard medical equipment including a sphygmomanometer, pulse oximeter and single-lead ECG, to derive beat-to-beat SBP estimates from PTT during exercise which are similar to reference SBPs measured by automated sphygmomanometry. Secondly, no evidence was found in this study that would suggest that SBPs measured by the volume clamp technique (Portapres) during exercise tests were more closely related to reference SBPs measured by automated sphygmomanometry than blood pressure estimates from PTT.
In exercise tests, blood pressure monitoring is generally recommended because of its diagnostic, prognostic and safety-related potential (Citation17,Citation19–23). However, despite the relevance of blood pressure assessment in clinical practice, there are relatively few studies comparing different methods of blood pressure measurement during physical exercise. Studies which compared volume clamp devices with intra-arterial and sphygmomanometer blood pressure monitoring during exercise consistently reported higher mean SBPs in volume clamp measurements than in intra-arterial and sphygmomanometer measurements (Citation24–26). Other studies assessed automated and manual sphygmomanometer devices during physical exercise and consistently showed that acceptable measurements of SBP during exercise can be obtained using automated as well as manual systems (Citation27–33). In summary, the available literature provides evidence that the volume clamp technique generally overestimates SBP during exercise tests, in accordance with the findings of the present study. Sphygmomanometry, however, appears to provide more accurate SBP measurements during exercise and is currently accepted as the standard method of non-invasive blood pressure measurement in clinical exercise stress tests (Citation21,Citation34).
For this reason, several studies on PTT used sphygmomanometry as a calibration and adjustment standard for the determination of blood pressure estimates from PTT during exercise (Citation11–15). Although previous studies demonstrated that, using such calibration procedures, acceptable SBP estimates can be derived from PTT during physical exercise (Citation11–15), the present study is the first to compare a PTT/sphygmomanometer-based method of blood pressure estimation with another method of blood pressure assessment during exercise.
Currently, there exists no standard recommendation to assess the accuracy of blood pressure measurement during exercise tests. Standard validation protocols for blood pressure measuring devices, such as the Association for the Advancement of Medical Instrumentation (AAMI) SP10-2002 protocol, the British Hypertension Society (BHS) protocol or the European Society of Hypertension International Protocol (ESH-IP) revision 2010, are not specified for use during exercise tests (Citation35–37).
Bland–Altman analysis has been shown to be the most popular and widely accepted method to assess agreement between different medical measurement methods, and is supposed to be superior to other statistical methods including correlation analysis, which has been reported to be inappropriate in this context (Citation38). Therefore, Bland–Altman analysis has been used in the present study to assess the agreement of PTT-derived and volume clamp blood pressure values with the values obtained by sphygmomanometry. The results showed that the PTT-based method showed smaller bias and limits of agreement than the volume clamp technique. Although smaller limits of agreement may be interpreted as better agreement, it has to be noted that the smaller bias observed for PTT-derived blood pressure values may largely be due to the calibration procedure which, for methodological reasons, has been exclusively performed in the PTT-based method but not in the volume clamp measurements. However, the present individual within-subject Bland–Altman comparisons, in particular, highlight that there may be not only a considerable bias but also a substantial lack of agreement between volume clamp and sphygmomanometer measurements. It may be hypothesized that this lack of agreement is caused to some extent by general imprecision and inaccuracy of commercially available continuous non-invasive blood pressure monitoring devices, as recently reported in a systematic review and meta-analysis (Citation39).
Estimation of beat-to-beat SBP using the PTT method in combination with intermittent sphygmomanometry as described in the present paper may therefore be an alternative to commercially available volume clamp devices, in situations where sphygmomanometry alone is too slow and where a higher temporal resolution of SBP measurement is needed for earlier detection or a more detailed assessment of short-term changes.
Limitations
The results of the present study must be interpreted within the context of some potential limitations. Although this study demonstrated that, using the PTT/sphygmomanometer method, blood pressure values similar to automated sphygmomanometry can be obtained, the results from this method are dependent, as a logical consequence, on the validity of the sphygmomanometer used. Owing to a lack of standard protocols for the validation of blood pressure measurement devices during exercise, sphygmomanometers validated for this specific use are currently not available. This study did not use a mercury- column sphygmomanometer because these devices are no longer allowed for use in clinical practice, notably in European countries. Instead, an automated sphygmomanometer was chosen, which is one of the accepted methods in clinical practice as a basis for clinical decision making and which appeared to be adequate for comparison with the equally automated volume clamp technique.
Another aspect is that, although beat-to-beat blood pressure values have been obtained in this study, for methodological reasons, only up to 11 values were used for comparison. Continuous invasive blood pressure measurement would have been necessary to compare each of the available beat-to-beat blood pressure values, but, for ethical reasons, this type of experiment may almost exclusively be performed in patients with cardiovascular disease who may expect to benefit from arterial catheterization. However, it can be expected that a representative sample of blood pressure values was obtained by the use of a clearly defined distribution of reference points in the present study.
In addition, the fact that reference and calibration values were both based on sphygmomanometer data might be questioned. However, one of the potential sources of bias in this approach was reduced through systematic exclusion of specific reference points from the calibration procedures, thus ensuring that calibration and subsequent comparison procedures did not use the same sets of data. In respect of the questions addressed in this study, the present approach was a necessary consequence of the method of simultaneous intermittent calibration demonstrated in this work. Other than in previous studies, this novel method does not assume that any of the simultaneously determined calibration coefficients remain constant within one individual from one exercise test to another, and therefore, in the present study, the reliability of the calibration coefficients has not been assessed in a second exercise test.
DBP values were not assessed in the present study because some evidence exists that DBP is not always inversely related to PTT in a consistent way, as is currently assumed for SBP (Citation13). Therefore, it is questionable whether DBPs, which typically show only little change during exercise, can be reliably estimated from PTT based on physiological considerations consistent with present knowledge, although statistical relationships may be present.
Another limitation is that the study population mainly consisted of subjects with a diagnosis of lung disease and, therefore, the present findings and conclusion may not easily be generalized to subjects with different characteristics. Further studies are warranted to explore the effects of subject and disease characteristics on PTT and on its relation to blood pressure during exercise.
It should also be noted that the PTT/sphygmomanometer method demonstrated in this study does not include a height correction unit. Therefore, depending on the specific application, the potential change of PTT in relation to vertical arm movement has to be taken into consideration (Citation40). For this reason, subjects were instructed to avoid arm movement in the present study.
In conclusion, for beat-to-beat estimation of SBP during exercise, PTT measurement combined with multipoint nonlinear regression calibration based on intermittent sphygmomanometry may be an alternative to the application of volume clamp devices in future research. However, restrictions arise with regard to the lack of DBP estimation and height correction.
Funding
This work was supported by the German Federal Ministry of Education and Research (BMBF) and MCC GmbH & Co. KG.
Declaration of interest: The authors report no conflicts of interest. The authors alone are responsible for the content and writing of the paper.
References
- Smith RP, Argod J, Pépin JL, Lévy PA. Pulse transit time: an appraisal of potential clinical applications. Thorax. 1999;54: 452–7.
- Laurent S, Cockcroft J, Van Bortel L, Boutouyrie P, Giannattasio C, Hayoz D, et al. Expert consensus document on arterial stiffness: methodological issues and clinical applications. Eur Heart J. 2006;27:2588–605.
- Kounalakis SN, Geladas ND. The role of pulse transit time as an index of arterial stiffness during exercise. Cardiovasc Eng. 2009;9:92–7.
- Lass J, Meigas K, Karai D, Kattai R, Kaik J, Rossmann M. Continuous blood pressure monitoring during exercise using pulse wave transit time measurement. Conf Proc IEEE Eng Med Biol Soc. 2004;3:2239–42.
- Wagner DR, Roesch N, Harpes P, Körtke H, Plumer P, Saberin A, et al. Relationship between pulse transit time and blood pressure is impaired in patients with chronic heart failure. Clin Res Cardiol. 2010;99:657–64.
- Sharwood-Smith G, Bruce J, Drummond G. Assessment of pulse transit time to indicate cardiovascular changes during obstetric spinal anaesthesia. Br J Anaesth. 2006;96:100–5.
- Yamada T, Tsutsui M, Sugo Y, Sato T, Akazawa T, Sato N, et al. Multicenter study verifying a method of noninvasive continuous cardiac output measurement using pulse wave transit time: a comparison with intermittent bolus thermodilution cardiac output. Anesth Analg. 2012;115:82–7.
- Kilic H, Yelgec S, Salih O, Akdemir R, Karakurt O, Cagirci G, et al. An invasive but simple and accurate method for ascending aorta–femoral artery pulse wave velocity measurement. Blood Press. 2013;22:45–50.
- Chen W, Kobayashi T, Ichikawa S, Takeuchi Y, Togawa T. Continuous estimation of systolic blood pressure using the pulse arrival time and intermittent calibration. Med Biol Eng Comput. 2000;38:569–74.
- Gu WB, Poon CCY, Leung HK, Sy MY, Wong MYM, Zhang YT. A novel method for the contactless and continuous measurement of arterial blood pressure on a sleeping bed. Conf Proc IEEE Eng Med Biol Soc. 2009;2009:6084–6.
- Masè M, Mattei W, Cucino R, Faes L, Nollo G. Feasibility of cuff-free measurement of systolic and diastolic arterial blood pressure. J Electrocardiol. 2011;44:201–7.
- Gesche H, Grosskurth D, Küchler G, Patzak A. Continuous blood pressure measurement by using the pulse transit time: comparison to a cuff-based method. Eur J Appl Physiol. 2012;112:309–15.
- Wibmer T, Doering K, Kropf-Sanchen C, Rüdiger S, Blanta I, Stoiber KM, et al. Pulse transit time and blood pressure during cardiopulmonary exercise tests. Physiol Res. 2014;63: 287–96.
- Wong MY-M, Poon CC-Y, Zhang Y-T. An evaluation of the cuffless blood pressure estimation based on pulse transit time technique: a half year study on normotensive subjects. Cardiovasc Eng. 2009;9:32–8.
- Jeong Ic, Wood J, Finkelstein J. Using individualized pulse transit time calibration to monitor blood pressure during exercise. Stud Health Technol Inform. 2013;190:39–41.
- Peñáz J. Photoelectric measurement of blood pressure, volume and flow in the finger. In: Albert A, Vogt W, Hellig W, editors. Digest of the 10th International Conference on Medical and Biomedical Engineering, Dresden; 1973. p. 104.
- Bland JM, Altman DG. Statistical methods for assessing agreement between two methods of clinical measurement. Lancet. 1986;i:307–10.
- Mansia G, De Backer G, Dominiczak A, Cifkova R, Fagard R, Germano G, et al. 2007 ESH-ESC Guidelines for the management of arterial hypertension: the task force for the management of arterial hypertension of the European Society of Hypertension (ESH) and of the European Society of Cardiology (ESC). Blood Press. 2007;16:135–232.
- Gibbons RJ, Balady GJ, Bricker JT, Chaitman BR, Fletcher GF, Froelicher VF, et al. ACC/AHA 2002 guideline update for exercise testing: summary article. A report of the American College of Cardiology/American Heart Association Task Force on Practice Guidelines (Committee to Update the 1997 Exercise Testing Guidelines). J Am Coll Cardiol. 2002;40:1531–40.
- American Thoracic Society, American College of Chest Physicians. ATS/ACCP Statement on cardiopulmonary exercise testing. Am J Respir Crit Care Med. 2003;167:211–77.
- Myers J, Arena R, Franklin B, Pina I, Kraus WE, McInnis K, et al. Recommendations for clinical exercise laboratories: a scientific statement from the American Heart Association. Circulation. 2009;119:3144–61.
- Schultz MG, Hare JL, Marwick TH, Stowasser M, Sharman JE. Masked hypertension is “unmasked” by low-intensity exercise blood pressure. Blood Press. 2011;20:284–9.
- Kontsas K, Triantafyllidi H, Trivilou P, Ikonomidis I, Tzortzis S, Liazos I, et al. Delayed blood pressure recovery ratio might indicate increased arterial stiffness in hypertensive patients with reduced aerobic exercise capacity. Blood Press. 2013;22:290–6.
- Silke B, Spiers JP, Boyd S, Graham E, McParland G, Scott ME. Evaluation of non-invasive blood pressure measurement by the Finapres method at rest and during dynamic exercise in subjects with cardiovascular insufficiency. Clin Auton Res. 1994;4:49–56.
- Blum V, Carrière EG, Kolsters W, Mosterd WL, Schiereck P, Wesseling KH. Aortic and peripheral blood pressure during isometric and dynamic exercise. Int J Sports Med. 1997;18:30–4.
- Eckert S, Horstkotte D. Comparison of Portapres non-invasive blood pressure measurement in the finger with intra-aortic pressure measurement during incremental bicycle exercise. Blood Press Monit. 2002;7:179–83.
- Griffin SE, Robergs RA, Heyward VH. Blood pressure measurement during exercise: a review. Med Sci Sports Exerc. 1997;29:149–59.
- Cameron JD, Stevenson I, Reed E, McGrath BP, Dart AM, Kingwell BA. Accuracy of automated auscultatory blood pressure measurement during supine exercise and treadmill stress electrocardiogram-testing. Blood Press Monit. 2004; 9:269–75.
- MacRae HS, Allen PJ. Automated blood pressure measurement at rest and during exercise: evaluation of the motion tolerant CardioDyne NBP2000. Med Sci Sports Exerc. 1998;30:328–31.
- Modesti PA, Carrabba N, Gensini GF, Bonechi F, Taddei T, Malfanti PL. Automated blood pressure determination during exercise test. Clinical evaluation of a new automated device. Angiology. 1992;43:980–7.
- White WB, Lund-Johansen P, McCabe EJ, Omvik P. Clinical evaluation of the Accutracker II ambulatory blood pressure monitor: assessment of performance in two countries and comparison with sphygmomanometry and intra-arterial blood pressure at rest and during exercise. J Hypertens. 1989;7: 967–75.
- White WB, Lund-Johansen P, McCabe EJ. Clinical evaluation of the Colin ABPM 630 at rest and during exercise: an ambulatory blood pressure monitor with gas-powered cuff inflation. J Hypertens. 1989;7:477–83.
- White WB, Lund-Johansen P, Omvik P. Assessment of four ambulatory blood pressure monitors and measurements by clinicians versus intraarterial blood pressure at rest and during exercise. Am J Cardiol. 1990;65:60–6.
- Sharman JE, LaGerche A. Exercise blood pressure: clinical relevance and correct measurement. J Hum Hypertens. 2015;29:351–8.
- Association for the Advancement of Medical Instrumentation. American National Standard. Electronic or automated sphygmomanometers ANSI/AAMI SP10-2002. Arlington, VA: AAMI; 2003.
- O’Brien E, Petrie J, Littler W, de Swiet M, Padfield PL, Altman DG, et al. The British Hypertension Society protocol for the evaluation of blood pressure measuring devices. J Hypertens. 1993;11(Suppl 2):S43–63.
- O’Brien E, Atkins N, Stergiou G, Karpettas N, Parati G, Asmar R, et al. European Society of Hypertension International Protocol revision 2010 for the validation of blood pressure measuring devices in adults. Blood Press Monit. 2010;15:23–38.
- Zaki R, Bulgiba A, Ismail R, Ismail NA. Statistical methods used to test for agreement of medical instruments measuring continuous variables in method comparison studies: a systematic review. PLoS One. 2012;7(5):e37908.
- Kim S-H, Lilot M, Sidhu KS, Rinehart J, Yu Z, Canales C, et al. Accuracy and precision of continuous noninvasive arterial pressure monitoring compared with invasive arterial pressure: a systematic review and meta-analysis. Anesthesiology. 2014;120:1080–97.
- Poon CCY, Zhang YT. Using the changes in hydrostatic pressure and pulse transit time to measure arterial blood pressure. Conf Proc IEEE Eng Med Biol Soc. 2007;2007: 2336–7.