
Abstract
We studied the relationships of automated blood pressure (BP), measured in the healthcare centre, with manual office BP and home BP. Stable outpatients treated for hypertension were measured automatically, seated alone in a quiet room, six times after a 5 min rest with the BpTRU device, and immediately afterwards using the auscultatory method. Home BP was measured in a subgroup during 7 days preceding the visit. The automated, office and home BP values were 131.2 ± 21.8/77.8 ± 12.1 mmHg, 146.9 ± 20.8/85.8 ± 12.4 mmHg and 137.7 ± 17.7/79.4 ± 8.2 mmHg, respectively. Limits of agreement between office and automated BP (2 SDs in Bland–Altman plots) were +42.6 to –12.6/+22.6 to –6.6 mmHg for systolic/diastolic BP; for home and automated BP they were +45.8 to –25.8/+20.8 to –12.6 mmHg. For patients with two visits, intraclass correlation coefficients of BP values measured during the first and second visits were 0.66/0.72 for systolic/diastolic automated BP and 0.68/0.74 for systolic/diastolic office BP. Automated BP was lower than home BP and no more closely related to home BP than to office BP. It did not show better repeatability than office BP. Whether automated BP and the “white-coat effect”, calculated cas the office BP–automated BP difference, have clinical and prognostic importance deserves further studies.
Introduction
Automated BP measurement, which consists of multiple fully automated blood pressure (BP) measurements taken in the healthcare centre without the presence of a physician or a nurse, has been developed during the past 10–15 years. Compared with routine manual office BP measurement, automated BP may correlate more strongly with awake ambulatory BP measurement, be more consistent from visit to visit, and virtually eliminate office-induced hypertension. Some data show that automated BP correlates more closely with left ventricular mass index and carotid intima–medial thickness.[Citation1–3] Automated BP may also eliminate the drawbacks of out-of-office BP measurement, ambulatory blood pressure monitoring (ABPM) or home BP self-measurements. These BP measurements are better predictors of cardiovascular events than office BP.[Citation4] However, ABPM is relatively expensive and may be poorly tolerated by the patient, while it is difficult to control the quality of home BP measurement. Manual office BP measurement in routine clinical practice often does not follow the recommendations stated in the guidelines,[Citation4] the routine office BP being on average 10/7 mmHg higher than research study BP.[Citation1] Thus, automated BP provides an attractive option to quickly and easily obtain BP values that show all the advantages mentioned above. In Canada, more than 25% of primary care physicians are now using automated BP measurement in their office practices.[Citation5]
Automated BP can be measured with the BpTRU device, which has successfully passed the validation study.[Citation6] It conforms to the standard of the Association for the Advancement of Medical Instrumentation and received the “A/A” grade according to the British Hypertension Society protocol. Moreover, it is relatively easy to use.
There have been several studies on the relationship between automated BP and daily ABPM[Citation1,Citation7,Citation8]; the majority of them, although not all, showed a good agreement. However, to our knowledge, the relationships between automated and home BP have been analysed in only one paper, published recently.[Citation9] Questions arise over the extent to which the automated BP values are related to out-of-office measurements, and whether they are more stable than BP measured manually in the office.
Therefore, in our study, we investigated the associations between automated BP and manual office BP in stable treated hypertensive patients, and compared the values measured during repeated visits. Furthermore, in a subgroup of patients with home BP available, we studied the relationships of all three BP measurement methods.
Methods
In total, 353 patients were examined in the hypertension centre by one of three participating physicians (JS, JF, ZK). During the visit, the patient was first seated alone in a separate room. After 5 min of rest measured with the stopwatch, the patient alone started the measurements with the BpTRU Medical Devices Ltd., Coquitlam, BC, Canada device by pressing the START button ( illustrates the settings). Immediately after these measurements, the patient proceeded to the office where auscultatory BP measurements were taken by the physician; the number of measurements was decided by the physician (two in the majority of patients). Of these patients, 62 had two visits with both automated BP and manual office BP measurements; the patients were examined by the same physician during the two visits with the treatment unchanged. The mean interval between visits was about 3 months.
Figure 1. Use of the BpTRU in our study.
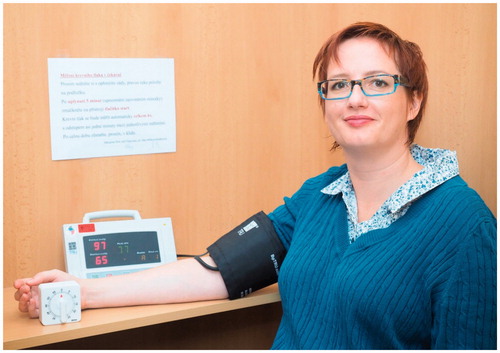
One-hundred and fourteen patients measured their BP at home. These patients were accustomed to measuring their home BP regularly; before the study, they were instructed both verbally and in writing that BP must be measured after a 5 min rest, in a sitting position, with the forearm supported. They were given a special form on which they filled in the BP measurements taken during the 7 days preceding the visit, with two measurements in the morning before taking the drugs and two in the evening.
The BpTRU device was set to measure BP six times in 1 min intervals. The BPM 200 model discards the first measurement and calculates the mean of the second to the sixth measurements. The sphygmomanometers used for auscultatory measurements were the Nissei DM-1000 (Japan Precision Instruments, Gunma, Japan Rudolf Riester GmbH, Jungingen, Germany) and Riester N desk model. All sphygmomanometers, including the BpTRU, were calibrated before the study.
For statistical analysis, we used SAS software version 9.3 (SAS Institute, Cary, NC). The results are presented as the arithmetic mean ± SD or as a proportion (percentage). We applied usual statistical methods: Pearson and intraclass correlation coefficients (ICCs) and multiple regression analysis. We constructed Bland–Altman plots to compare automated BP with manual office BP and home BP, and home BP with manual office BP.
Results
The basic characteristics of the sample are shown in . The majority of patients (82%) took at least two antihypertensive drugs, 55% were on hypolipidaemic therapy and 27% had diabetes mellitus. Means of the second to the sixth automated BP measurements are shown in Table SI (in the online supplement); the mean values dropped from 135/79 mmHg at the second measurement to 129/77 mmHg at the sixth measurement. In , the differences between office BP, automated BP and home BP and their correlations are shown. Automated BP was the lowest BP value, being 15/8 mmHg lower than office BP and 10/4 mmHg lower than home BP; the Pearson correlation coefficients of automated BP with office BP were slightly higher than with home BP for both systolic blood pressure (SBP) (0.79 and 0.65, respectively) and diastolic blood pressure (DBP) (0.82 and 0.68, respectively). Individual differences are shown in Bland–Altman plots of automated BP versus office BP and automated BP versus home BP (); and home BP versus office BP ().
Figure 2. Bland–Altman plots for (a) automated vs manual office systolic blood pressure (SBP) and diastolic blood pressure (DBP) and (b) automated vs home SBP and DBP. Mean differences (solid lines) and 2 SDs (dashed lines) are shown.
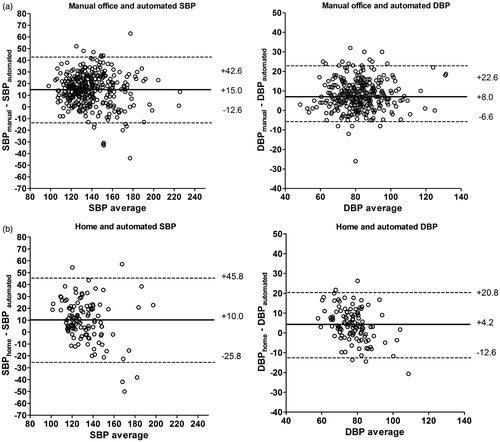
Figure 3. Bland–Altman plots for manual office vs home systolic blood pressure (SBP) and diastolic blood pressure (DBP). Mean differences (solid lines) and 2 SDs (dashed lines) are shown.
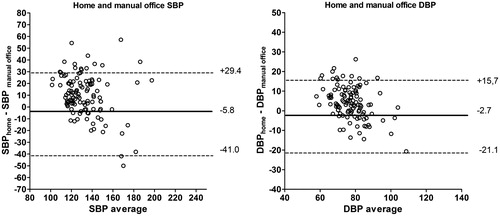
Table 1. Characteristics of the patients.
Table 2. Automated, manual office and home blood pressure (BP) values, their differences and correlations.
Multiple regression of the difference between systolic office BP and automated BP, which can be considered a “white-coat effect”, was calculated (Table SII, online supplement). The white-coat effect was predicted by the office BP value (positive association) and by the duration of the follow-up: the patients followed for more than 6 months in the centre had significantly larger differences in SBP, but there was no difference in DBP (Table SIII, online supplement).
Furthermore, we studied the repeatability of office BP in 62 patients who had data available from two consecutive visits. summarizes the associations between different BP measurements. The ICCs of the BP values from visits 1 and 2 were of similar magnitude for office BP and for automated BP. In , individual white-coat effects (i.e. differences between office BP and automated BP during visits 1 and 2) are shown.
Figure 4. Individual differences between office blood pressure (BP) and automated BP (“white-coat effect”) in 62 patients who had two visits. SBP, systolic blood pressure; DBP, diastolic blood pressure. Of 32 patients whose systolic office BP–automated BP difference was above the median during the first visit (high systolic white-coat effect, median = 16 mmHg), 23 (72%) were also above the median during the second visit; of 29 patients whose diastolic office BP–automated BP difference was above the median (= 6 mmHg) during the first visit, 17 (59%) were also above the median during the second visit.
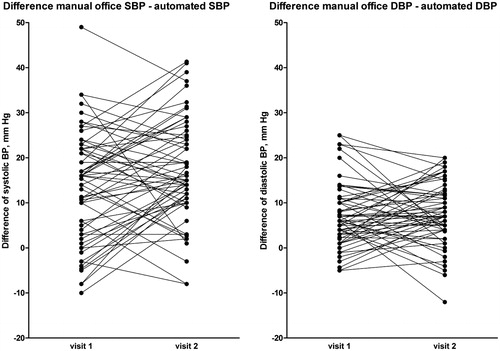
Table 3. Correlations of blood pressure measurements (n = 62).
Discussion
The key finding of our study is that automated BP in hypertensive patients was significantly lower than both office BP (by 15/8 mmHg) and home BP (by 10/4 mmHg). Moreover, we observed large individual differences between office and automated BP.
In our group, the limit for hypertension of 140/90 mmHg according to office BP corresponded to 125/82 mmHg with automated BP. In general, higher office BP values may be caused by improper measurements; this is, however, not the case in our study, where special attention was paid to high-quality measurements. They were taken by three physicians, all of whom had more than 10 years’ clinical experience in internal medicine/cardiology. Therefore, higher office BP in our study was mainly due to the white-coat effect. Saladini et al. [Citation10] studied the white-coat effect in untreated hypertensive subjects and found that BP increased by 12/6 mmHg when a physician only entered the examination room, without physical contact with the patient. Our results are in accordance with this finding.
In repeatability analysis, the ICCs were 0.66 and 0.72 for automated SBP and DBP, respectively. These values were lower than those found by Myers et al.,[Citation11] who reported ICCs for automated SBP/DBP measured at three visits of 0.896/0.873. We found the ICCs to be practically identical for office and automated BP. This was surprising because we expected that automated BP, measured in very standardized conditions, would be more stable. This means that automated BP also shows important intervisit variability, which may be caused by the patient’s mental state, the time from drug administration and external influences such as the weather. Since both manual and automated BPs are variable between visits, their difference (the white-coat effect) is variable as well.
Furthermore, we compared home BP with automated BP. We expected that the mean values would be similar, but home BP was much higher. When comparing office and home BP, we observed that there was a large number of patients with masked treated hypertension in our sample. For the analysis of home BP, we took all the measurements taken during the 7 days preceding clinical visit. The data were also recalculated after the exclusion of the first day measurement, as recommended by the European guidelines for home BP monitoring,[Citation12] and the results were practically identical (data not shown). These data show that compared to automated office BP, home measurements may be associated with a certain stress, either social (presence of family members) or due to the procedure of BP self-measurement. Individual differences between home and automated BP values were again very variable, and the standard deviations of automated BP–home BP differences were slightly larger than those of automated BP–office BP differences (). Therefore, we do not think that automated office BP could predict home BP measurements.
There are several studies showing that the automated office BP value is close to the mean of daily ambulatory BP: it usually differs by 2–4 mmHg for both SBP and DBP.[Citation1] The correlations between automated BP and mean ABPM are, however, not very close, with Pearson correlation coefficients ranging from 0.34 to 0.6.[Citation7] One study, performed in 329 hypertensive subjects, showed that the association of automated BP with daily ABPM was no better than that of office BP[Citation8]: the 95% limits of agreement were similarly large for both comparisons (–31 mmHg to +33 mmHg for systolic automated BP versus ABPM and –27.8 mmHg to +37.4 mmHg for office BP vs ABPM); the mean systolic office BP was 4.9 mmHg higher and automated BP 3.2 mmHg lower than the mean systolic ABPM. Large limits of agreement between automated BP and ABPM were also found in the CAMBO trial.[Citation13]
Our study had several limitations, which are mainly the consequence of the fact that it was an observational study conducted in usual patients of the hypertension centre. We performed repeated visits to evaluate the repeatability of the white-coat effect, but they were made only in a subsample. Moreover, more than two visits would have better determined the long-term stability of the white-coat effect, and this should be addressed in future studies. Another limitation concerns the home BP. The patients measured their BP with their own devices, which may introduce some imprecision. Only those patients, however, who measured their home BP regularly before the study were included in the analysis. When a patient starts monitoring his or her home BP, he or she is asked to bring the device into the office and instructed how to measure the BP, and the device is checked in the office with regard to auscultatory BP measurements.
In conclusion, automated BP may become important in the future, because its measurement is relatively easy, and it is more comfortable for the patient than ABPM and more reliable than home BP. As it is performed in the absence of a physician or a nurse, it may serve – in combination with office BP – to quantify the white-coat effect. Quantification of the white-coat effect or a correct diagnosis of white-coat hypertension is important. Although there is no direct evidence about how to treat white-coat hypertension,[Citation4] it is clear that it is associated with an increased probability of having subclinical organ damage,[Citation14] and of developing sustained hypertension [Citation15] or diabetes.[Citation16] Moreover, some studies have shown that white-coat hypertension is also associated with a higher incidence of cardiovascular events.[Citation17,Citation18]
A lot of research is, however, needed to determine the role of automated BP. Limited data are available about automated BP and subclinical organ damage,[Citation2,Citation3] we have no data about the association of automated BP with cardiovascular mortality, and standardization of the procedure (time interval before the beginning of the automated measurements, time intervals between the automated measurements and level of intimacy) is not yet sufficient. Once the measurement procedure has been standardized, limits of normal values, probably different from those for office BP, will be necessary.
The standardization of BP measurement becomes especially relevant in the light of the recently published results of the Systolic Blood Pressure Intervention Trial (SPRINT), which showed that intensive BP lowering in non-diabetic hypertensive subjects (SBP < 120 mmHg) is beneficial compared with < 140 mmHg.[Citation19] It is stated in the main publication that “dose adjustment was based on a mean of three blood-pressure measurements at an office visit while the patient was seated and after 5 minutes of quiet rest; the measurements were made with the use of an automated measurement system (Model 907, Omron Healthcare)”. The comments on SPRINT state that “automated manometer was preset to wait for 5 minutes before measurement” [Citation20] and even that the subjects were measured “3 times unobserved”.[Citation21] However, whether this was done systematically in all 102 participating clinical sites is not clear, as neither the protocol nor the publication on design and rationale [Citation22] specified the method of BP measurement sufficiently. Therefore, we do not know whether BP measurement in SPRINT was similar to the automated BP in our study.
The 2013 European Society of Hypertension/European Society of Cardiology Guidelines for the management of arterial hypertension [Citation4] state that “if feasible, automated recording of multiple BP readings in the office with the patient seated in an isolated room … might be considered as a means to improve reproducibility and make office BP values closer to those provided by daytime ABPM or home BP”. Our data show, however, that automated BP is very different from office BP and from home BP as well, and literary data show that the agreement between automated BP and ABPM is not, in our opinion, very high either. Therefore, automated BP at present should be used not instead of other BP measurements, but as a supplementary tool, along with well-established methods including classic manual office BP.
Funding information
The study was supported by the Charles University Research Fund (project no. P36).
Filipovsky_et_al_revised_manuscript_2.docx
Download MS Word (1.3 MB)Disclosure statement
No potential conflict of interest was reported by the authors.
Related Research Data
References
- Myers MG. The great myth of office blood pressure measurement. J Hypertens. 2012;30:1894–18.
- Andreadis EA, Agaliotis GD, Angelopoulos ET, Tsakanikas AP, Chaveles IA, Mousoulis GP. Automated office blood pressure and 24-h ambulatory measurements are equally associated with left ventricular mass index. Am J Hypertens. 2011;24:661–666.
- Campbell NR, McKay DW, Conradson H. et al. Automated oscillometric blood pressure versus auscultatory blood pressure as a predictor of carotid intima–medial thickness in male firefighters. J Hum Hypertens. 2007;21:588–590.
- 2013 Practice guidelines for the management of arterial hypertension of the European Society of Hypertension (ESH) and the European Society of Cardiology (ESC): ESH/ESC Task Force for the Management of Arterial Hypertension. J Hypertens. 2013;31:1925–1938.
- Myers MG, Kaczorowski J, Dawes M, Godwin M. Automated office blood pressure measurement in primary care. Can Fam Physician. 2014;60:127–132.
- Wright JM, Mattu GS, Perry TL Jr, et al. Validation of a new algorithm for the BPM-100 electronic oscillometric office blood pressure monitor. Blood Press Monit. 2001;6:161–165.
- Beckett L, Godwin M. The BpTRU automatic blood pressure monitor compared to 24 hour ambulatory blood pressure monitoring in the assessment of blood pressure in patients with hypertension. BMC Cardiovasc Disord. 2005;5:18.
- Edwards C, Hiremath S, Gupta A, et al. BpTRUth: do automated blood pressure monitors outperform mercury? J Am Soc Hypertens. 2013;7:448–453.
- Sheppard JP, Holder R, Nichols L, et al. Predicting out-of-office blood pressure level using repeated measurements in the clinic: an observational cohort study. J Hypertens. 2014;32:2171–2178.
- Saladini F, Benetti E, Malipiero G, et al. Does home blood pressure allow for a better assessment of the white-coat effect than ambulatory blood pressure? J Hypertens. 2012;30:2118–2124.
- Myers MG, Valdivieso M, Kiss A. Consistent relationship between automated office blood pressure recorded in different settings. Blood Press Monit. 2009;14:108–111.
- Parati G, Stergiou GS, Asmar R, et al. European Society of Hypertension guidelines for blood pressure monitoring at home: a summary report of the Second International Consensus Conference on Home Blood Pressure Monitoring. J Hypertens. 2008;26:1505–1530.
- Myers MG, Godwin M, Dawes M, et al. Conventional versus automated measurement of blood pressure in primary care patients with systolic hypertension: randomised parallel design controlled trial. BMJ. 2011;342:d286.
- Schillaci G, Pucci G, Pirro M, et al. Combined effects of office and 24-h blood pressure on aortic stiffness in human hypertension. J Hypertens. 2011;29:869–875.
- Mancia G, Bombelli M, Facchetti R, et al. Long-term risk of sustained hypertension in white-coat or masked hypertension. Hypertension. 2009;54:226–232.
- Mancia G, Bombelli M, Facchetti R, et al. Increased long-term risk of new-onset diabetes mellitus in white-coat and masked hypertension. J Hypertens. 2009;27:1672–1678.
- Verdecchia P, Reboldi GP, Angeli F, et al. Short- and long-term incidence of stroke in white-coat hypertension. Hypertension. 2005;45:203–208.
- Mancia G, Bombelli M, Brambilla G, et al. Long-term prognostic value of white coat hypertension: an insight from diagnostic use of both ambulatory and home blood pressure measurements. Hypertension. 2013;62:168–174.
- SPRINT Research Group. A randomized trial of intensive versus standard blood-pressure control. N Engl J Med. 2015;373:2103–2116.
- Cushman WC, Whelton PK, Fine LJ, et al., http://www.ncbi.nlm.nih.gov/pubmed/26553234 SPRINT Trial Results: Latest News in Hypertension Management. Hypertension. 2016;67:263–265.
- Schiffrin EL, Calhoun DA, Flack JM. SPRINT proves that lower is better for nondiabetic high-risk patients, but at a price. Am J Hypertens. 2016;29:2–4.
- SPRINT Research Group. The design and rationale of a multi-center clinical trial comparing two strategies for control of systolic blood pressure: the Systolic Blood Pressure Intervention Trial (SPRINT). Clin Trials. 2014;11:532–546.