Abstract
We aimed to assess the prevalence of CKD in the Black Sea Region, Turkey, and to evaluate any relationship between age, gender, diabetes, obesity, hypertension, and CKD. This study was conducted in 70 different areas in Tokat Province in the Black Sea Region, in the northern part of Turkey. The estimated glomerular filtration rate (eGFR) was calculated from the serum creatinine using MDRD formulas. CKD-defined estimated GFR was lower than 60 mL/min/1.73m2. A total of 1,079 persons were included in this study (mean age 41.4±17 years [range: 18–95 years], 49.4% males, 50.6% living in an urban area). Of the 1,079 individuals, 5.28% were diabetic, 22.9% were obese, and 37.8% were hypertensive. CKD was found in 62 of them (5.75%). The prevalence of CKD was 5.58% in non-diabetics and 8.77% in diabetics. No significant differences were found between two groups. The prevalence of CKD was 3.77% in non-hypertensive individuals and 8.82% in hypertensive patients, and 4.46% in non-obese and 9.31% in obese. The evident significant differences were found between groups (p < 0.0001 and p = 0.004, respectively). The prevalence of CKD increased with age within our population. A salient observation was the markedly higher prevalence of CKD in females than males (p = 0.046). There was an inverse correlation between eGFR and age (r = 0.529, p < 0.0001). The overall prevalence of CKD was 5.75% in general population. The prevalence of CKD increased with age within our population. Age, gender, obesity and hypertension were found to be significant risk factors for development of CKD in our population.
INTRODUCTION
Chronic kidney disease (CKD) remains one of the most important public health problems in Turkey and all over the world, and its prevalence is gradually increasing. It becomes more important due to a high mortality and morbidity rate mainly based on cardiovascular events, and also due to the need for expensive treatment such as hemodialysis, continuous ambulatory peritoneal dialysis, and renal transplantation due to end stage renal disease (ESRD). Early diagnosis may prevent or delay the progression to ESRD. However CKD diagnosis is delayed in considerable cases, leading to a progression in the disease and an increase in prevalence due to the lack of epidemiologic studies and consensus on diagnostic criteria.Citation[1,Citation2]
Chronic renal insufficiency (CRI) is a syndrome that results from progressive and irreversible nephrone loss for at least three months by multiple causes. Lack of agreement about the definition of CRI and CKD has added to complications when conducting epidemiologic studies. To resolve this problem, in 2002, the United States' National Kidney Foundation (NKF) has recommended new definitions for CRI and CKD.Citation[3,Citation4] According to these guidelines, CKD has been defined as kidney damage for three or more months, as described by objective structural or functional abnormalities with or without decreased GFR <60 mL per minute per 1.73 m2. Structural or functional abnormalities in this definition include pathologic, blood (renal tubular disease) or urine (proteinuria), imaging test, and renal transplantation.Citation[4,Citation5]
In Turkey, prevalence of ESRD is 709/1,000,000 as of 2007. In 2006, the incidence of ESRD was 186 per million. As of 2007, 50,401 patients have been treated by renal replacement.Citation[3,Citation6] While the information about incidence and prevalence of ESRD is available, there are no adequate data for the prevalence of CKD in Turkey. For this purpose, we aimed to determine the prevalence of CKD and detect the association between the prevalence and age, sex, location (rural or urban), BMI, and concomitant conditions (hypertension, diabetes) in Tokat Province in the Black Sea Region (northern parts of Turkey).
MATERIAL AND METHODS
Case Selection
Tokat city, which is located in the middle of the Black Sea Region, had 530,000 inhabitants (≥18 years old) in 2005. Our study has been conducted between August and October 2005 in 70 locations, including Tokat Province, 12 towns, and 58 villages. While locations have been selected by cluster sampling, population has been selected by stratified sampling. Sample size was calculated as 1,095. Distribution of age, sex, and location was determined to represent general city distribution. A maximum of two relatives was included in the study. Patients with acute illnesses were excluded. The study has been approved by Ethic Committee of Gaziosmanpaşa University Medical Faculty, and all participants gave a written consent form. Participants were examined by an internal medicine specialist having at least three years of experience. After 8–12 hours fasting, blood samples were taken for routine laboratory tests. Serum samples have been stored at −80ºC for additional tests. Sixteen subjects were excluded because their serum samples were not sufficient to test creatinine levels, reducing the number of subjects to 1,079. In all, 546 subjects were from rural areas, and 533 subjects were from urban areas.
Measurements
Body weights have been measured by using a digital bascule (Tefal Sensio) in kilograms. After measuring body weight and height, BMI has been calculated as kg/m². Obesity has been defined as BMI ≥ 30 kg/m².Citation[7]
Blood pressure has been measured by sphygmomanometer (Erka D-83646 Bad Tölz; Germany) twice after five minutes' rest with five-minute intervals. An average of two measurements has been recorded as mmHg. Hypertension has been defined as ≥140/90 mmHg.Citation[8]
Serum creatinine levels were measured by automatic device (Hitachi Modular E 170-kit from Roche Dignostics, Tokyo, Japan) using a modified kinetic Jaffe method.
Fasting blood glucose levels has been measured by automatic device (Hitachi Modular E 170-kit from Roche Dignostics, Tokyo, Japan). Diabetes has been defined as FBG ≥ 126 mg/dL.Citation[9]
Renal Function Measurement and Diagnosis of Renal Insufficiency
CKD was diagnosed by GFR measurement. GFR was calculated by MDRD formula. MDRD calculation has been performed in http://www.hdcn.com/calcf/gfr.htm using serum creatinine value (mg/dL) and weight (kg). CRI has been defined as GFH < 60 mL/min/1.73 m².Citation[10–12] The MDRD calculation used the following equation:
shows the patients in stages III, IV, and V according to GFR values.
Table 1 Demographic, clinical, and laboratory data of the participants (n = 1079)
Statistical Analysis
Results expressed as mean ± SD or rate as percentage. χ2 and t tests have been used for comparisons and independent groups, respectively. In addition, Pearson's and Spearman's correlation analysis have been used to detect the associations between GFR and some clinical and demographic parameters. Chi-square test (χ2) was performed to compare between quantitative groups of CKD. Univariate and multivariate logistic regression analysis were performed to determine any association between CKD and its risk factors. Logistic regression analysis results were shown with odds ratio (OR) and confidence interval (95% CI), and p < 0.05 was considered significant. Statistical analysis was performed by using SPSS vs 11.0 (SPSS Inc., Chicago, Illinois, USA).
RESULTS
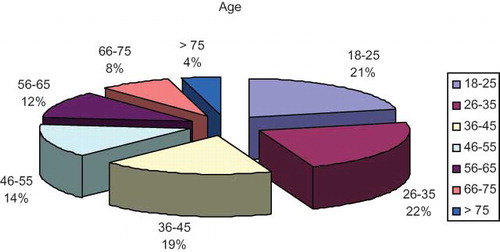
The mean age of the 1,079 participants was 41.4 ± 17 years old (18–95 years old). Of these, 533 participants were male (49.4%) and 546 of them lived in urban area. Age distribution of the participants is shown in . Rates for the presence of diabetes mellitus, obesity, and hypertension were 5.28%, 22.9%, and 37.8%, respectively. CKD has been detected in 62 cases, and prevalence estimate was 5.75%. Study descriptive data have been shown in .
Figure 1. Age distribution of the participants.
As shown in , CKD prevalence was greater among females and among persons with obesity, diabetes, and hypertension than among persons without these conditions. It has been also detected that prevalence in rural areas was greater than in urban areas. Finally, a positive correlation between CKD prevalence and monthly income has been determined.
Table 2 Risk factors distribution in CKD prevalence (Tokat province)
shows some of the demographic and biologic information of participants according their CKD status. We determined 55 cases of Stage III CKD (5.10%) and 7 cases of Stage IV CKD (0.65%). While mean GFR of all participants was 91 ± 21 mL/min, GFR was 79 ± 15 mL/min, 84 ± 19 mL/min, and 83 ± 15 mL/min in diabetic, obese, and hypertensive patients, respectively.
Table 3 Demographic and biologic comparisons between the participants with or without CKD
According to Gender
There was no mean age difference between the gender groups. Mean GFR has been found as 92 ± 20 mL/min and 88 ± 21 mL/min in male and females, respectively (p = 0.01). In the male group, the rate of CKD, diabetes, obesity, and hypertension were 4.32%, 5.44%, 12.6%, and 34.6%, respectively. Among females, these rates were found to be 7.14%, 5.13%, 33%, and 41.6%, respectively. While the rate of diabetic patients was not different between the gender groups, there was a significant difference in CKD, obese, and hypertensive patients rate between the groups (p < 0.0001).
According to Location
About half of our cases was located in rural areas. The mean age of this population was significantly higher than the urban population (43 ± 17 years old vs. 39 ± 16 years old; p = 0.001). In the rural areas, the female population was greater than male population, though there was no statistical significance. In the rural population, mean serum creatinine values and mean GFR were 0.90 ± 0.24 mg/dL and 89 ± 21 mL/min, respectively. In the urban population, these values were determined as 0.87 ± 0.18 mg/dL and 91 ± 20 mL/min, respectively. Both of these differences have statistical significance (p = 0.018 and p = 0.042, respectively). The prevalence of CKD in rural and urban areas was found as 6.57% and 4.95%, respectively. There was no statistical significance between the prevalence in two areas.
In Diabetic Patients
The rate of diabetes in our population was 5.28%. Mean age of diabetic cases was higher than non-diabetics (56 ± 11 years old vs. 40 ± 16 years old, p = 0.0001). Mean GFR in diabetics and non-diabetics was 79 ± 15 mL/min and 91 ± 21 mL/min, respectively (p < 0.0001). There was no statistical significance in CKD rate between diabetic and non-diabetic population (8.77% vs. 5.58%).
According to Blood Pressure
The rate of hypertension in our population was 37.8% (408). The mean ages of hypertensive and normotensive population were 49 ± 16 and 36 ± 15 years, respectively (p < 0.0001). Hypertension was more common in females than males. The prevalence of CKD in hypertensive and normotensive population were 8.82% and 3.77% respectively (p = 0.001).
Obesity and CKD
The frequency of obesity in our population was 22.8%. Obesity was significantly more frequent in female (33% in female and 12.6% in male; p < 0.0001). Mean age of obese population was significantly higher than in non-obese population (48 ± 14 vs. 39 ± 17 years, p < 0.0001). The prevalence of CKD was higher in the obese population than the non-obese population (9.31% and 4.46%, respectively; p = 0.004). GFR value was significantly lower in the obese population (84 ± 19 mL/min vs. 92 ± 19 mL/min, p < 0.0001). A negative correlation between the waist circumflex and GFR has been detected (r = −0.355, p < 0.0001). This correlation has been also detected between the waist circumflex and serum creatinine values (r = −0.124, p < 0.0001).
According to Age
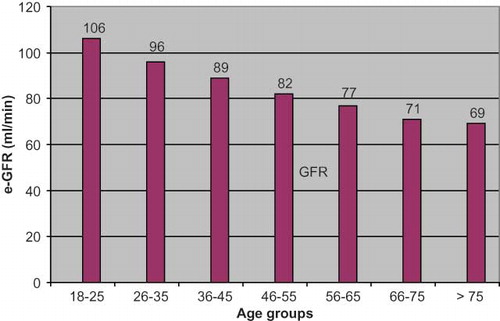
Our study population has been divided in seven age groups as 18–25, 26–35, 36–45, 46–55, 56–65, 66–75 and >75 years old. shows serum creatinine, GFR values, and rate of CKD in these age groups. GFR showed significantly decrease with age. There was a negative correlation between the GFR and age (r = −0.529, p < 0.0001). and shows age distribution and GFR change in age groups, respectively.
Figure 2. GFR changes in age groups.
DISCUSSION
CKD, a serious condition associated with premature mortality, decreased quality of life, and increased health-care expenditures, has become a global epidemics and public health problem.Citation[3] While the information about incidence and prevalence of ESRD is available, there is no adequate data for the prevalence of CKD in Turkey.Citation[3] While there is an ongoing study conducted by Turkish Nephrology Association (i.e., the CREDIT study), there are no available data about CKD prevalence in Turkey so far. In our study, CKD prevalence estimate for adults in Tokat province was 5.75%. These are valuable first data in Turkey.
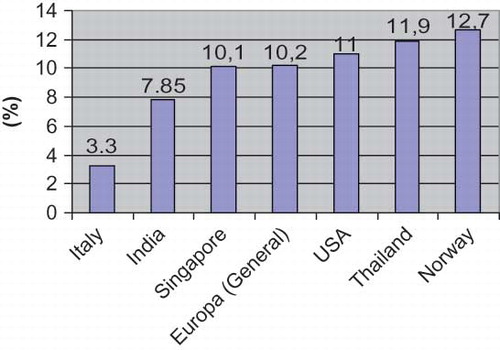
The prevalence of ESRD and CKD are increasing all over the world. Moreover, ethnical and geographical factors have an impact on this prevalence. For example, in the UK, the prevalence and incidence of ESRD has been estimated at 636 and 101/1,000,000, respectively. In Europe, the mean prevalence and incidence has been reported as 700 and 136/1,000,000, respectively. In 2003, the incidence and prevalence of ESRD have been found in the United States to be 336 and 1,403/1,000,000, respectively. In the black population, the incidence and prevalence of ESRD increased to 982 and 4,432/1,000,000, respectively.Citation[13–16] Although there are differences in prevalence data of CKD between the countries, in some of them, the prevalence of CKD has reached a serious level. While it has been reported to be as low as 3.3% in Italy, the prevalence of CKD has been found to be 12.7% in Norway,Citation[14,Citation17] and it has been reported in Singapore and Australia as 10.1% and 16%, respectively.Citation[18] Wen et al.Citation[19] reported that the prevalence of CKD in a Taiwan population was 11.9% (462,000). Data from China, Korea, and Japan gives some values between 7.85 and 18.7%. shows the CKD prevalence in different countries.Citation[13–19] The main reason for this high prevalence in these countries is the assessment that patients having proteinuria more than three months as having CKD.Citation[20,Citation21] Thus, it has been included in evaluating patients from stages I and II. In our study, we determined the prevalence as 5.75%. This rate is lower than in Europe, the United States, and Asia. This may be caused by the relatively young population of Turkey. Moreover the CKD has been diagnosed by using e-GFR.
Figure 3. The prevalence of CKD in different countries (see references 13 through 19).
The prevalence of CKD increases with age. Viktorsdottir et al.Citation[22] reported in their Iceland study that CKD prevalence increased with age in both sexes. In the younger age group (age 35–39), the prevalence was 0.75% and 2.19% in the male and female population, respectively. This rate increased in the 75–79 age group to 24.4% (male) and 53% (female).Citation[12] In the UK, the prevalence of the dialysis population in the 18–64 and >65 age groups has been estimated at 72/ 1,000,000 and 300/1,000,000, respectively.Citation[23] In the United States, the prevalence of the dialysis population in the > 65 age group reaches 1,200/1,000,000.Citation[24] In fact, it has been demonstrated that risk for CKD increases by 2.36 times with every 10 years of age in the Framingham study.Citation[25] Similarly, we found an increase of CKD prevalence with age in our study. In age groups of 66–75 and >75, we found the prevalence of CKD as 23.3% and 22.7% respectively (see ). Our results comply with literature data.
There is a debate about the sex impact on CKD prevalence in literature. In some studies, it has been reported that hypertensive males had a greater risk for CKD than females.Citation[26] Coresh et al.Citation[27] described CKD as kidney damage (micro and macroalbuminuria) and reported a higher prevalence in female in their study. They reported CKD prevalence in males and females as 11.1% and 15%, respectively.Citation[27] Ryan et al.Citation[28] reported that CKD prevalence was significantly higher in females than males, with 9% and 7.4%, respectively. The study conducted by the Australian Creatinine Consensus Working Group in 2005 used the Cockcroft-Gault formula (GFR < 60 mL/min) for CKD diagnosis and reported that CKD prevalence was higher in female in all age groups.Citation[29] Similarly, we also found that CKD prevalence was higher among females. This may be explained by the high incidence of hypertension and obesity in female population where the MDRD formula was used for diagnosis of CKD.
The cheapest and most commonly used test for GFR is to evaluate renal function. GFR is widely used in general public screening.Citation[30] In GFR measurement, renal iothalamate clearance is the gold standard. However, MDRD study results demonstrated that the MDRD formula gave favorable GFR results compared with the other tests.Citation[11,Citation31] We used the MDRD formula to measure GFR and diagnose CKD in our study. The result of higher prevalence in the female population has caused us to question the suitability of the formula in our country. We believe that it is necessary to conduct large, multicenter studies to compare GFR measurement tests for validation of the MDRD formula in our country.
Hypertension is a very important risk factor for CKD development.Citation[32] Systemic hypertension causes CKD by damaging small vessels of nephrons directly. Thus, renal autoregulation impairment and microalbuminuria/proteinuria occur. Glomerular damage increases by vasoactive substances, which are released because of excess protein reabsorption from proximal tubules. Moreover, it has been shown that blood pressure control may delay renal progression.Citation[26] In our study, CKD prevalence was more than 1.5 times greater among the hypertensive population than among the normotensive population. In line with this result, in the hypertensive population, GFR values were lower and serum creatinine values were higher compared with normotensive groups. Interestingly, hypertension prevalence was 59.1% and 36.8% in CKD and non-CKD groups, respectively. Thus, it has been strongly suggested that hypertension was an important factor for CKD.
Diabetes is one of the most important risk factors for CKD development.Citation[33] Both in our country and developed countries, diabetes is the prominent cause of ESRD. One-third of pre-dialysis population is diabetic in the United States. In Turkey, 27% of the pre-dialysis population is diabetic.Citation[6,Citation24] Chadban et al. reported that the prevalence of patients with GFR < 60 mL/min in the diabetic population was 27.6% in the Australian Aus Diab study, including 420 diabetic.Citation[32] In our study, CKD prevalence in the diabetic population was approximately 1.5–2 times greater than in the non-diabetic population. Similarly, diabetes prevalence in CKD and non-CKD population was 8.06% and 5.11%, respectively. Thus, it has been strongly suggested that diabetes was an important factor for CKD.
It has been suggested that obesity was a risk factor having a direct and indirect impact on CKD development. It is known that some renal pathologies such as focal segmental glomerulosclerosis is more prevalent in obese patients, and some glomerulonephritis—particularly IgA nephropathies—progress more rapidly in obese patients.Citation[20] Although it is unknown if there is a clear relation between obesity and CKD, hypertension, microalbuminuria, dyslipidemia, and diabetes are more common in obese patients. These are the factors that affect CKD progression. Thus, this comorbidity can explain the high prevalence of CKD in obese patients.Citation[20,Citation34] In our study, CKD prevalence in obese and non-obese population was 9.31% and 4.46%, respectively. This difference was statistically significant. Moreover, obesity prevalence was significantly greater among the CKD population than in the non-CKD population (38.1% vs. 22%). High prevalence of CKD in the obese population can be explained by the high prevalence of hypertension and diabetes in this group. Furthermore, the negative correlation between the waist/hip circumflex and GFR determined by our study supports the idea that obesity is a relevant factor in CKD development.
In our study, while CKD prevalence in rural areas was greater than in urban areas, this difference has not reached statistical significance. Although higher serum creatinine values and lower GFR values calculated by MDRD have been detected in rural population, it may be explained by the mean age of the rural population, which is higher than the urban population, and high prevalence of hypertension.
In our study, it was shown that risk factors such as gender, obesity, and hypertension have a significant impact individually on CKD prevalence (univariate logistic regression analysis). In composite analysis, only hypertension has shown an association with CKD (multivariate logistic analysis). It is considered that obesity and gender have an impact on CKD indirectly, as they have an association with hypertension (see ).Citation[17]
Table 4 Associations between the CKD and some risk factors (univariate and multivariate logistic regression analysis)
In conclusion, CKD prevalence has been determined to be 5.75% in Tokat Province (Black Sea Region) in Turkey. CKD is a more common syndrome in obese and hypertensive patients. A higher prevalence has been determined in females than males. It may be related that obesity and hypertension are more common in females.
ACKNOWLEDGMENTS
The study has been supported by Gaziosmanpaşa University Scientific Research Project Commission with Project number 2005/26.
REFERENCES
- Ruggenenti P, Schieppati A, Remuzzi G. Progression, remission, regression of chronic renal diseases. Lancet. 2001;357:1601–1608.
- Chittinandana A, Chailimpamontree W, Chaloeiphap P. Prevalence of chronic kidney disease in Thai adult's population. J Med Assoc Thai. 2006;89(Suppl. 2):S112–S120.
- Süleymanlar G, CKD, CRI. Definition, stages and epidemiology. Turk Klin J Intern Med Sci. 2007;3(38):1–7.
- National Kidney Foundation. K/DOQI clinical practice guidelines for chronic kidney disease: Evaluation, classification, and stratification. Am J Kidney Dis. 2002;39((2)(Suppl. 1)):S1–S266.
- Levey AS, Eckardt KU, Tsukamoto Y, Levin A, Coresh J, Rossert J, Definition and classification of chronic kidney disease: A position statement from Kidney Disease: Improving Global Outcomes (KDIGO). Kidney Int. 2005;67:2089–2100.
- Erek E, Süleymanlar G, Serdengeçti K. TND Registry grubu, Türk Nefroloji Derneği Kayıt Sistemi Raporları 1992–2007. Available at: http://www.tsn.org.tr/.
- Orzano AJ, Scott JG. Diagnosis and treatment in obesity in adults: An applied evidence-based review. Am J Board Fam Pract. 2004;17:359–369.
- Chobanian AV, Bakris GL, Black HR, Cushman WC, Green LA, Izzo JLJr, National Heart, Lung, and Blood Institute Joint National Committee on Prevention, Detection, Evaluation, and Treatment of High Blood Pressure; National High Blood Pressure Education Program Coordinating Committee. The Seventh Report of the Joint National Committee on Prevention, Detection, Evaluation, and Treatment of High Blood Pressure: The JNC 7 report. JAMA. 2003;289:2560–2572.
- Satman I, Yilmaz T, Sengül A, Salman S, Salman F, Uygur S, Population based study of diabetes and risk characteristics in Turkey: Results of Turkish Diabetes Epidemiology Study (TURDEP). Diabetes Care. 2002;25:1551–1556.
- Levey AS, Coresh J, Greene T, Stevens LA, Zhang YL, Hendriksen S, Using standardized serum creatinine values in the modification of diet in renal disease study equation for estimating glomerular filtration rate. Ann Intern Med. 2006;145:247–254.
- Levey AS, Bosch JP, Lewis JB, Greene T, Rogers N, Roth D. Modification of Diet in Renal Disease Study Group. A more accurate method to estimate glomerular filtration rate from serum creatinine: A new prediction equation. Ann Intern Med. 1999;130:461–470.
- Akoğlu H, Altun B. Böbrek hastalıklarında tarama testleri. Turk Klin J Intern Med Sci. 2007;3(38):8–18.
- Obrador GT, Pereira BJG. Epidemiology of chronic kidney disease and screening recommendations. UpToDate (15.3); 2007. .
- Hallan SI, Coresh J, Astor BC, Asberg A, Powe NR, Romundstad S, International comparison of the relationship of chronic kidney disease prevalence and ESRD risk. J Am Soc Nephrol. 2006;17:2275–2284.
- El Nahas AM, Bello AK. Chronic kidney disease: The global challenge. Lancet. 2005;365:331–340.
- Hallan SI, Dahl K, Oien CM, Grootendorst DC, Aasberg A, Holmen J, Screening strategies for chronic kidney disease in the general population: Follow-up of cross-sectional health survey. BMJ. 2006;333:1047–1053.
- Sumaili EK, Krzesinski JM, Zinga CV, Cohen EP, Delanaye P, Munyanga SM, Prevalence of chronic kidney disease in Kinshasa: Results of a pilot study from Democratic Republic of Congo. Nephrol Dial Transplant. 2009;24:117–122.
- Cirillo M, Laurenzi M, Mancini M, Low glomerular filtration in the population: Prevalance, associated disorders, and awareness. Kidney Int. 2006;70:800–806.
- Wen CP, Cheng TY, Tsai MK, Chang YC, Chan HT, Tsai SP, All-cause mortality attributable to chronic kidney disease (CKD): A prospective cohort study based on 462 293 adults in Taiwan. Lancet. 2008;371:2173–2182.
- İmai E, Matsuo S. Chronic kidney disease in Asia. Lancet. 2008;371:2147–2148.
- Udayakumar N. Chronic kidney disease in India: From a resident physician’ perspective. Postgrad Med J. 2006;82:697–698.
- Viktorsdottir O, Palsson R, Andresdottir MB, Aspelund T, Gudnason V. İndridason OS. Prevalence of chronic kidney disease based on estimated gomerular filtration rate and proteinuria in İcelandic adults. Nephrol Dial Transplant. 2005;20:1799–1807.
- Sims RJA, Cassidy MJD, Masud T. The increasing number of older patients with renal disease. Br Med J. 2003;327:463–464.
- United States Renal Data System. Annual data report. Incidence and prevalence of ESRD (2003). Am J Kidney Dis. 2003;42(Suppl. 5):S37–S173.
- Fox CS, Larson MG, Leip EP, Culleton B, Wilson PW, Levy D. Predictors of new-onset kidney disease in a community-based population. JAMA. 2004;291:844–850.
- Snively CS, Gutierrez C. Chronic kidney disease: Prevention and treatment of common complications. Am Fam Physician. 2004;70:1921–1928.
- Coresh J, Selvin E, Stevens LA, Manzi J, Kusek JW, Eggers P, Prevalence of chronic kidney disease in the United States. JAMA. 2007;298:2038–2047.
- Ryan TP, Sloand JA, Winters PC, Corsetti JP, Fsiher SG. Chronic kidney disease prevalence and rate of diagnosis. Am J Med. 2007;120:981–986.
- The Australasian Creatinine Consensus Working Group. Chronic kidney disease and automatic reporting of estimated glomerular filtration rate: A position statement. Med J Australia. 2005;183:138–141.
- Stevens S, Levey AS. Clinical implications of estimating equations for glomerular filtration rate. Ann Int Med. 2004;141:959–961.
- Levey A, Green T, Kusek J, Beck GJ. MDRD Study Group. A simplified equation to predict glomerular filtration rate from serum creatinine. J Am Soc Nephrol. 2000;11:155A.
- Chadban SJ, Briganti EM, Kerr PG, Dunstan DW, Welborn TA, Zimmet PZ, Prevalence of kidney damage in Australian adults: The AusDiab Kidney Study. J Am Soc Nephrol. 2003;14(Suppl. 2):S131–S138.
- Haroun MK, Jaar BG, Hoffman SC, Comstock GW, Klag MJ, Coresh J. Risk factors for chronic kidney disease: A prospective study of 23,534 men and women in Washington County, Maryland. J Am Soc Nephrol. 2003;14:2934–2941.
- Ejerblad E, Fored CM, Lindblad P, Fryzek J, McLaughlin JK, Nyren O. Obesity and risk for chronic renal failure. J Am Soc Nephrol. 2006;17:1695–1702.