Abstract
Objectives. Few studies mention how to objectively adjust peritoneal dialysis (PD) dwell volume for adult continuous ambulatory peritoneal dialysis (CAPD) patients. We proposed a reference equation composed of parameters from the peritoneal equilibrium test (PET) for adjusting daily dialysate dwell volume to obtain more ultrafiltration volume. Better fluid control could reduce more fluid overload-related complications. Design. We used body mass index, waist circumference, intraperitoneal pressure, and other parameters from peritoneal equilibrium test to compose a reference equation for fine-tuning daily dwell volume. Patients and Setting. Eighty-eight PD patients in one center with laboratory data collected during half-yearly PET evaluations were enrolled. Instilled dialysate was composed of 2.57% glucose PD fluid, either 1500 ml or 2000 ml in volume. In addition to other demographic data, intraperitoneal pressure (IPP) was also measured twice in the supine position four hours apart. We applied statistical multivariate techniques of discrimination analysis and logistic regression to verify the most feasible and optimal formula to determine infill volumes for patients. Results. We determined a novel formula for calculating daily dialysate dwell volume, Z: Z = (0.523 × waist circumference) + (0.852 × body mass index), derived from rotating axes to obtain an accurate prediction rate of 80.68% using the multivariate approach. Conclusion. The novel formula used objective, real-time parameters for determining appropriate dwell volumes for PD patients to optimize maximal ultrafiltration volumes and reduce subjective abdominal discomfort. The novel formula makes frequent adjustment of daily dwell volume by physicians or patients easy to calculate.
INTRODUCTION
Both the incidence and prevalence of end-stage renal disease (ESRD) in Taiwan are highest in the world, with incident ESRD at 418 per million population and prevalent rate at 2,226 per million population, according to the U.S. Renal Data System 2008 Annual Data Report.Citation[1] The percentage of patients with ESRD on continuous ambulatory peritoneal dialysis (CAPD) is relatively lower, around 7.6%.Citation[1] Multiple factors cause patients to drop out of peritoneal dialysis treatment, such as feelings of abdominal fullness and decreased appetite resulting from large dialysate volumes or inadequate fluid removal with resulting hypertension, congestive heart failure, and increased mortality.Citation[2] A previous clinical study confirmed no apparent survival superiority with increasing peritoneal small molecular weight uremic toxin clearances.Citation[3] On the contrary, inadequate ultrafiltration volume and higher peritoneal transport are associated with increased mortality.Citation[2] We believe that developing a formula accounting for patient characteristics, peritoneal equilibrium test (PET) data, and intraperitoneal pressure (IPP) for predicting appropriate dialysate volume to achieve maximal ultrafiltration volume is crucial.
Using measurements of intraperitoneal pressure for adjustment of individual dwell volume is extensively applied among pediatric PD patients to obtain maximal volume tolerances and ultrafiltration volumes.Citation[4,Citation5] Increasing dwell volume recruits more peritoneal membrane surface area for better uremic toxin clearance and larger ultrafiltration volume. Several researchers revealed negative linear correlation between mean IPP and ultrafiltration volume.Citation[6–8] Maintaining IPP levels of less than 18 cmH2O is well tolerated by adult and pediatric PD patients, without subjective discomfort, while achieving optimal ultrafiltration volumes.Citation[7,Citation9] Only a few studies applied IPP measurement as part of adjusting dwell volume in addition to subjective tolerance levels of adult patients and objective observation of a physician.
We studied adult CAPD patients concerned with maximizing ultrafiltration volume during PET evaluations. The waist circumference, body mass index (BMI), and tolerability of patients are usually considered by the physician to decide the infill volume for an individual PD patient. A smaller difference between dialysate/plasma creatinine ratio measured at the second and the fourth hour of PET, as well as a smaller reduction in IPP, reduced the outflow volume for CAPD treatment. The issue of how to determine the appropriate dialysate volume for a CAPD patient is controversial.
In this study, we developed a formula for both physicians and patients to determine and adjust appropriate infill volumes frequently and successfully to attain the maximum ultrafiltration volumes.
METHODS
Subjects
This is a cross-sectional study with consecutive participants on CAPD treatment recruited from a medical center in southern Taiwan. In total, 88 subjects were recruited (66 females, 22 males; age of 18–78 years; duration of dialysis 3.7–121.5 months). Of these, 20 patients used infill volumes of 1500 ml (group 1) and 68 used volumes of 2000 ml (group 2) during PET evaluations. All of the study subjects had been on regular PD treatments for more than three months, and none had a major operation, peritonitis, or acute illness within one month before enrollment.
The protocol of this study was approved by the Research and Ethics Review Board of Chi-Mei Medical Center. All authors certify that there are no known conflicts of interest with any third party.
Study Variables
IPP was measuredCitation[5,Citation10] during routine biannual peritoneal equilibrium test (PET) evaluations. The dwell dialysate was 2.57% glucose solution (Baxter Healthcare SA, Singapore Branch, DIANEAL PD-2 Peritoneal Dialysis Solution in ULTRABAG Container), and dwell volume was either 2000 ml or 1500 ml, which was the same as in the daily exchange regimen. The IPP data were collected at the beginning and end of the PET evaluations.
The PET protocol was performed according to Twardowski's recommendations.Citation[11] The intraperitoneal pressure was measured in the supine position as previously described,Citation[5,Citation12] just after instillation of a defined dialysate volume (P0) and before the dialysate was drained four hours later (P4). The difference between P0 and P4 was defined as ΔIPP. The dwell volume was determined by the physician with consideration of both subjective abdominal discomfort of patients and objective BMI.
Gender, age, height, weight, CAPD duration, infill and dwell volumes, maximum ultrafiltration volume, ΔH4-H2 (the difference between dialysate/plasma creatinine ratio at the second and fourth hours), ΔIPP, waist circumference, and BMI were recorded, and differences between the two experimented groups were examined for statistical significance. The main variables that significantly affected ultrafiltration were then studied to develop the optimal formula to determine the appropriate infill volumes for individual patients.
Formulas and Discriminating Groups
Indentifying the New Axis
Traditionally, a separate independent Student's t-test for two groups based on a univariate approach is done for each variable. A preferred method is to perform a multivariate test in which both variables are tested simultaneously or jointly.
A new axis, Z, in the multivariate approach makes an angle with a variable axis, on which the projection of any point, say patient (p), on Z will be given by:
This equation represents a linear combination of two variables (i.e., waist circumference and BMI in this study) for patient p. The Z-axis gives a new variable Z, which is a linear combination of the original two variables. The ratio of the between-group to the within-group sums of squares for each angle implies that the greatest angle on the new axis provides the maximum separation between the two groups, to which the cutoff value can be decided by the number of observations and the average discriminant score for groups as the following equationCitation[13]:where ni and Zi bars are the sample sizes and the means of two groups, respectively.
Group Discriminant Analysis
Discriminant analysis is one of the available techniques for separating groups using specific discriminator variables. The first step is to identify a set of variables that best discriminates between groups. The next is to identify a new axis as in Eq. (1) to provide the maximum separation or discrimination between groups. The last step is to classify future observations into one of the groups for suggesting an appropriate dialysate infill-volume adjustment, such that the infill volume for an individual CAPD patient is either 1500 ml or 2000 ml.
The prior probabilities of the groups should be decided before conducting the discriminant analysis. We adopted two ways to examine grouping accuracy by assuming prior probabilities were equal and computing them from sample sizes with either two (waist circumference and BMI) or four variables (the two previous variables plus ΔH4–H2 and ΔIPP). The discriminant function denoting Z1 and Z2 was constructed, assigning observations to a specific group in accordance with the largest classification score.
Logistic Regression
When physicians are interested in determining the probability that a CAPD patient should be assigned to either infill volume group (1500 ml or 2000 ml), discriminant analysis can be used in terms of holding the multivariate normality assumption. Fortunately, the independent variables are a mixture of categorical and continuous variables, in which the logistic regression can be applied without assuming the normality of the distributions of the independent variables. That is, logistical regression is normally recommended when the independent variables do not satisfy the multivariate normality assumption.Citation[13,Citation14] We showed two approaches for independent variables consisting of two (waist circumference and BMI) or four variables (adding another two variables, ΔH4–H2 and ΔIPP, to waist circumference and BMI) as that in discriminant analysis.
Statistical Analysis
Statistical analyses were performed using MedCalc for Windows, version 9.5.0.0 (MedCalc Software, Mariakerke, Belgium), and using SPSS for Windows (Version 15) (SPSS Inc., Chicago, Illinois, USA).
RESULTS
Eighty-eight peritoneal dialysis patients underwent PET with two infill volumes: 1500 ml (20 patients, group 1) and 2000 ml (68 patients, group 2). There were no differences in the distributions of age and gender between the two groups. Additionally, the differences of underlying diseases and durations of PD treatment between the two groups were insignificant (see ).
Table 1 Demographic data of study subjects (n = 88)
Discriminant Analysis
Identifying a set of variables that provides the best discrimination between the two groups is the first objective of discriminant analysis. shows that the discriminator variables providing the best discrimination are dwell outflow volume (UF is insignificant), waist circumference, and BMI. Only waist circumference and BMI were significantly and practically extracted. That is, Student's t-test suggests that the two groups are statistically different with respect to both waist circumference and BMI at a significant level of 0.05 (see ).
Table 2 Variables compared with two groups of 1500 ml and 2000 ml
Formulas Predicting Infill Volume
Indentifying a New Axis
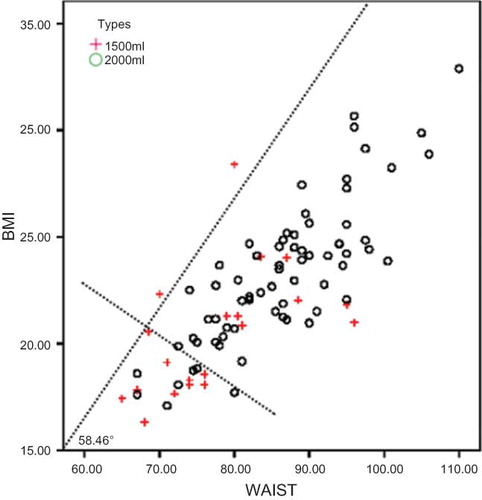
In , a new axis, Z, in the two-dimensional space makes an angle of, for example, 58.46° with the waist circumference axis, on which the projection of any point—say, patient (p— on Z will be given according to Eq. (1). This represents a linear combination of the waist circumference and BMI for patient p. shows each ratio, λ, of the between-group to the within-group sums of squares for each angle (θ), implying that the greatest λ on the new axis provides the maximum separation between the two groups. We chose an angle of 58.46° as the optimal solution, and cutoffs of 21.5 and 68.5 referred to the BMI and waist circumference scores, respectively. This represents overall accuracy of 80.68%, which is shown as alternative A in and .
Table 3 Summary statistics for various linear combinations
Table 4 Six prediction methods for original observed volume
Figure 1. Plot of study data and new axis of Z (new axis) for alternative A.
Grouping Analysis
We constructed three sets of formulas as alternatives B to D shown in with overall percentages of grouping accuracy of 68.20%, 77.30%, and 83.00%, respectively. The highest (i.e., alternative D) is computed from prior probabilities according to the group sample sizes with four discriminator variables.
Logistic Regression
The percentage accuracy of the two and four variables manipulated in logistic regression was 78.40% and 81.80% (as alternatives E and F in ); this indicates that the more variables that are recruited, the higher the classification accuracy obtained. Though logistic regression (LR) with a little lower in percentage accuracy and less visually geometric illustration than discriminant analysis was displayed, the probability that a CAPD patient be assigned to the 1500-ml infill group can be decided when the Z value of LR is less than 5; otherwise, the patient should be assigned to the 2000-ml infill group when Z value of LR greater or equal to 5.
DISCUSSION
We studied the key factors affecting the maximum ultrafiltration volume (i.e., effluent minus instilled dialysate volume for CAPD treatment) as the maximum ultrafiltration volume (see ), including waist circumference, BMI, ΔH4-H2, and ΔIPP. The highest discriminating probability of those six alternatives in is alternative D, with an accuracy percentage of 83.00%, which is arrived at from the four independent variables with prior probabilities decided by sample sizes. Even though the computation can be easily performed at the hospital after obtaining the discrepant values of H4, H2, and IPP measured at beginning and end of the PET evaluation, our recommended novel formula is the one of alternative A derived from rotating axis (see ):
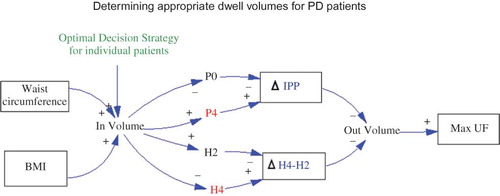
Figure 2. Relationships of causes and effects obtaining appropriate PD dwell volume to maximum UF volumes for continuous ambulatory peritoneal dialysis (CAPD) treatment.
With only two variables, it can be simply used by patients or their physicians to accurately predict the optimal dialysate infill volume, 1500 ml or 2000 ml, for an individual patient. Traditionally, we decided the infill volume using the two variables of waist circumference and BMI, which showed significant differences in . Referring to , even if using the criterion of waist circumference greater than 68.5 cm and BMI greater than 21.5, we misclassified several patients using the univariate approach. The multivariate method, with the newly calculated axis, obtained a greater success rate for classification whether considering the interception or not.
One of the limitations of this study was that only one set of measurements was obtained during PET, which was performed regularly every six months. That is also the reason why we recommend applying the formula for adjustment of daily dwell volume by patients themselves to obtain maximal ultrafiltration volumes. The sooner adjustments of dwell volumes are made, the better fluid control is, which reduces mortality.
Readers may doubt that only two infill volumes (1500 ml or 2000 ml) would suffice for clinical practice and meet most patients' needs. After performing clustering analyses for the four groups by K-mean of cluster analysis using SPSS for Windows, we suggest that the cutoff threshold values of 57, 65, and 74 of raw scores computed by the formula for axis rotation with alternative A in , be for four types of infill volumes for individual patients corresponding to 1500, 1700, 1850, and 2000 ml, respectively.
ACKNOWLEDGMENTS
This study was supported by grant CMFHR-9758 from Chi-Mei Medical Center.
The authors report no conflicts of interest. The authors alone are responsible for the content and writing of the paper.
Related Research Data
REFERENCES
- U.S. Renal Data System. USRDS 2008 Annual Data Report: Atlas of chronic kidney disease and end-stage renal disease in the United States. Bethesda, Md.: National Institutes of Health, National Institute of Diabetes and Digestive and Kidney Diseases; 2008.
- Brown EA, Davies SJ, Rutherford P, Meeus F, Borras M, Riegel W, Survival of functionally anuric patients on automated peritoneal dialysis: The European APD Outcome Study. J Am Soc Nephrol. 2003 Nov;14(11):2948–2957.
- Paniagua R, Amato D, Vonesh E, Correa-Rotter R, Ramos A, Moran J, Effects of increased peritoneal clearances on mortality rates in peritoneal dialysis: ADEMEX, a prospective, randomized, controlled trial. J Am Soc Nephrol. 2002 May;13(5):1307–1320.
- Fischbach M, Desprez P, Donnars F, Geisert J. Hydrostatic intraperitoneal pressure in children on peritoneal dialysis: Practical implications. An 18-month clinical experience. Adv Perit Dial. 1994;10:294–296.
- Durand PY, Chanliau J, Gamberoni J, Hestin D, Kessler M. Routine measurement of hydrostatic intraperitoneal pressure. Adv Perit Dial. 1992;8:108–112.
- Rusthoven E, van der Vlugt ME, van Lingen-van Bueren LJ, van Schaijk TC, Willems HL, Monnens LA, Evaluation of intraperitoneal pressure and the effect of different osmotic agents on intraperitoneal pressure in children. Perit Dial Int. 2005 Jul–Aug;25(4):352–356.
- Durand PY, Chanliau J, Gamberoni J, Hestin D, Kessler M. Measurement of hydrostatic intraperitoneal pressure: A necessary routine test in peritoneal dialysis. Perit Dial Int. 1996;16 (Suppl. 1):S84–S87.
- Durand PY, Chanliau J, Gamberoni J, Hestin D, Kessler M. Intraperitoneal hydrostatic pressure and ultrafiltration volume in CAPD. Adv Perit Dial. 1993;9:46–48.
- Fischbach M, Terzic J, Becmeur F, Lahlou A, Desprez P, Battouche D, Relationship between intraperitoneal hydrostatic pressure and dialysate volume in children on PD. Adv Perit Dial. 1996;12:330–334.
- Fischbach M, Terzic J, Provot E, Weiss L, Bergere V, Menouer S, Intraperitoneal pressure in children: Fill-volume related and impacted by body mass index. Perit Dial Int. 2003 Jul–Aug;23(4):391–394.
- Twardowski ZJ, Nolph KD, Khanna R, Prowant BF, Ryan LP, Moore HL, Peritoneal equilibration test. Perit Dial Bull. 1987;7:138–147.
- Fischbach M, Terzic J, Laugel V, Escande B, Dangelser C, Helmstetter A. Measurement of hydrostatic intraperitoneal pressure: A useful tool for the improvement of dialysis dose prescription. Pediatr Nephrol. 2003 Oct;18(10):976–980.
- Sharma S. Applied multivariate techniques. Hoboken, NJ: Wiley; 1995.
- Forthofer R, Lee E. Introduction to biostatistics: A guide to design, analysis, and discovery. San Diego: Academic Press; 1995.