Abstract
Background: Anderson-Fabry disease (AFD) is an X-linked genetic disorder with deficient α-galactosidase A activity. The main aim of this work was to investigate possible differences in urine proteins between healthy controls and AFD patients and to identify abnormal proteins as potential biomarkers of disease. Material and methods: We studied 2D electrophoresis images of urine samples collected from AFD patients and healthy subjects. The proteins were separated using isoelectric focusing method followed by SDS-PAGE. The proteins were then visualized by silver staining and characterized by matrix-assisted laser desorption/ionization time-of-flight mass spectrometry (MALDI-TOF MS). Results: We found out that the urinary spectra of all the Fabry disease samples included identical proteins with molecular weight around 20–40 kDa. The concentration of some proteins was more than three times higher in the AFD samples, compared to the controls. The abundant proteins were identified by MALDI-TOF MS and included the following: alpha-1-antitrypsin, alpha-1-microglobulin, prostaglandin H2 d-isomerase, complement-c1q tumor necrosis factor-related protein, and Ig kappa chain V–III. Possible glycosylation at Asn51 and Asn78 sites of the prostaglandin H2 d-isomerase was detected. Conclusions: AFD urinary proteomics revealed increased secretion of several proteins. We postulate that the observed difference in the amount of prostaglandin H2 d-isomerase and its position on two-dimensional gels might be related to different glycosylation in AFD subjects.
INTRODUCTION
Anderson-Fabry disease (AFD) is an X-linked glycolipid storage disorder that is caused by deficient activity of the lysosomal enzyme α-galactosidase A (α-gal A).Citation1,Citation2 Globotriaosylceramide (Gb3), the glycolipid substrate for this enzyme, progressively accumulates within vulnerable cells and tissues of affected patients, which leads to a wide clinical spectrum of clinical manifestations. Endothelial, perithelial, and smooth muscle cells of the vascular system, renal epithelial cells, myocardial cells, dorsal root ganglia, and cells of the autonomic nervous system are selectively damaged by Gb3.Citation3–5 The diagnosis of AFD is usually established by detection of low α-gal A activity in plasma, leukocytes, or fibroblasts, or by detection of increased Gb3 levels in urine kidney, skin, and heart, or by detection of gene mutations.Citation6 The activity of α-gal A in hemizygous Fabry disease patients is hardly detectable, whereas in milder disease variants (cardiac), in atypical hemizygous patients, and in female carriers, the residual activity of α-gal A is detectable with variable intensity.Citation4
The incidence of AFD is estimated to be 1:40,000,Citation7,Citation8 in some studies up to 1:3500.Citation8 As in other X-linked recessive disorders, symptoms in carriers are expected to be rare; however, in AFD, up to 80% of female carriers suffer from some typical disease symptoms and up to 20% of these women present with health-endangering symptoms. The classical AFD phenotypes suffer from a multiorgan disorder affecting blood vessels, kidneys, heart, and the central and peripheral nervous system. The clinical onset of the disease typically occurs during childhood or adolescence, with symptoms of recurrent episodes of severe pain in extremities. Vital organs are progressively affected with increasing age in hemizygous males with death, resulting from renal, cardiac, or cerebrovascular complications, usually occurring during the fourth or the fifth decade of life.Citation9 Enzyme replacement therapy (ERT) with human recombinant α-gal A has become available since 2001.Citation10,Citation11 Recent evidence suggests that the ERT is more efficacious if started early, before the development of advanced kidney involvement with overt proteinuria.Citation7,Citation12 Until now, assessment of Gb3 excretion and its concentration in plasma and urine has been used as a biomarker to monitor the disease response to the treatment. Recently, lyso-Gb3 has been suggested as a more promising tool. Lyso-Gb3 is a soluble compound, in contrast to Gb3, that can easily move in and out of cells. It lacks a hydrophobic (acyl) fragment compared to Gb3. Lyso-Gb3 is virtually not detectable in plasma obtained from normal individuals, but relatively high concentrations occur in samples from Fabry males. Also in the case of symptomatic Fabry females, increased levels of lyso-Gb3 were detected.Citation13 However, there is a critical need to find new biomarkers for assessment of the disease severity and the ERT efficacy.Citation14 Our study was designed to analyze potential differences in urinary proteomes between AFD patients and healthy controls, using modern analytical techniques, such as isoelectric focusing and two-dimensional (2D) electrophoresis in polyacrylamide gels. Employment of a similar technique of protein determination by 2D electrophoresis was shown in previous studies,Citation15–18 in which some protein differences specific to certain diagnoses (nephrotic syndrome, Fanconi syndrome, or various carcinomas) were detected.
The main aim of this work was to establish the differences between the healthy controls and the AFD subjects and to identify potential disease-specific proteins using matrix-assisted laser desorption/ionization time-of-flight mass spectrometry (MALDI-TOF MS). We expect this finding to facilitate better understanding of the AFD.
MATERIAL AND METHODS
Study population
Urinary samples from 20 patients with AFD (11 males, 9 females, age range 18–69 years) were collected. Their proteinuria varied between 0.1 and 1 g/24 h; 13 patients were on ERT (nine of them were given agalsidase beta (Fabrazyme®) 1 mg/kg every other week, four of them were given agalsidase alfa (Replagal®) 0.2 mg/kg every other week) and 7 subjects received no therapy. Physiologic proteinuria is usually estimated to be between 30 and 50 mg/day and is mostly composed of tubular proteins, namely uromodulin (Tamm–Horsfall protein). Proteinuria of 150 mg/day may be accepted as an upper limit of “normal” proteinuria. So our patients had only small proteinuria, which would be tagged as normal and could be determined using the routine laboratory evaluation (). The control group consisted of 10 healthy individuals (five males and five females aged between 27 and 42 years of age). Samples (30 mL) from their 24-h urine collections were used for the analyses. Proteinuria is usually very low (up to 1 g/24 h) in patients with Fabry disease; therefore, most of the urine samples (proteinuria of less than 1 g/24 h) had to be concentrated (10 kDa, 5 min, 3000 ×g, 4°C)Citation19 using Amicon Ultra (Millipore, Billerica, Massachusetts, USA) before their 2D analysis. The samples were either analyzed immediately, or the sample aliquots were stored at −80°C. Stability of the urine samples during their storage was confirmed by urine sample reanalysis 30 and 180 days after the first analysis. The protein spectrum analysis confirmed that freezing and subsequent storage did not affect the presence of proteins in the urine samples.Citation15 The study was approved by a local ethical committee ().
Table 1. Clinical data of Anderson-Fabry disease patients
Determination of protein concentration
The Bradford spectrophotometric methodCitation20 was used to determine protein concentration in urine in concentrated samples. Absorption was monitored at 595 nm against a standard. Then, a method described by WatanabeCitation21 using pyrogallol red was used to determine a total protein concentration at the beginning of the analyses. Absorption was measured by the Modular spectrophotometric instrument (Roche, Basel, Switzerland).
2D electrophoresis
The proteins were separated by the isoelectric focusing method using 7 cm polyacrylamide strips with immobilized linear gradient, pH 3–10 (IPG strip pH 3–10 L, Amersham Biosciences, Upsala, Sweden; electrophoresis Multiphor II, Amersham Biosciences). The total amount of protein placed on each polyacrylamide strip was 20 μg. The isoelectric focusing was performed in three steps to reach 3500 V (Power Supply EPS 3501, Amersham Biosciences). The second dimensional separation was performed in the SE260 Mini-Vertical Electrophoresis Unit (Scie-Plas, Warwickshire, UK) in the 12% polyacrylamide gel. The proteins were then visualized by silver staining (Silver Bullit Kit, Amresco, St. Louis, Missouri, USA).
Gel comparison
The Phoretix 2D expression 2005 software was used for the protein analysis. A urine sample from a healthy control was used as a reference gel. This reference gel was then used to compare the proteins in the investigation gels from the AFD patients with those from the healthy controls. The protein content increase (in percentage) was calculated using the following formula:
% increase protein: [total protein in the sample (Fabry disease)/total protein in the sample (healthy control)] × 100
In-gel protein digestion
The silver-stained protein spots were excised from the 2D gels, cut into small pieces, and washed several times with fresh 1:1 solution of 30 mM potassium ferricyanide and 100 mM sodium thiosulfate. Upon complete destaining, the gel pieces were washed with water, dehydrated in acetonitrile (ACN), and again rehydrated in water. The supernatant was removed and the gel was partly dried in a vacuum concentrator. The gel pieces were then reconstituted in a cleavage buffer containing 0.01% 2-mercaptoethanol, 0.1 M 4-ethylmorpholine acetate, 1 mM CaCl2, 10% ACN, and sequencing grade modified trypsin (50 ng/mL, Promega, Fitchburg, Wisconsin). After overnight digestion, the resulting peptides were extracted with 40% ACN/0.5% trifluoroacetic acid (TFA). For the low-abundance proteins, the peptides were purified and concentrated prior to mass spectrometric analysis according to manufacturer's user guide using ZipTip tips with 0.6 μL C18 resin (Millipore, Billerica, Massachusetts).
MALDI-TOF MS and protein identification
Ten milligrams per milliliter solution of α-cyano-4-hydroxycinnamic acid (Bruker Daltonik, Bremen, Germany) in 30% ACN/30% MeOH water solution containing 0.2% TFA was used as a MALDI matrix. A sample (1 mL) was placed on the polished steel MALDI target plate, allowed to air-dry at room temperature, and then 1 mL of the matrix solution was added. Positive ion mass spectra were obtained using a matrix-assisted laser desorption/ionization time-of-flight/time-of-flight (MALDI-TOF/TOF) mass spectrometer (Autoflex II, Bruker Daltonik) in reflectron mode, equipped with a 337 nm nitrogen laser. The generated spectra were within the mass range of 700–4500 Da. The data were calibrated against the Peptide calibration standard I (Bruker Daltonik) as an external calibration standard, using a seven-point calibration. Mass spectrometric sequencing of selected peptides was done by MALDI LIFT-TOF/TOF MS of the same prepared samples with the above instrument operated in MS/MS mode. Using the FlexAnalysis 2.4 program with the SNAP peak detection algorithm, peak lists in the XML data format were created. Statistical calibration was included in the program and no further adjustments were applied; the maximum number of assigned peaks was set to 50. After the peak labeling, all known contaminant signals were manually removed. The peak lists were examined against Swiss-Prot or NCBInr database subsets of human proteins, using the MASCOT search engine with the following search criteria settings: peptide tolerance of 100 ppm, the number of allowed missed cleavage sites was set to 1, fixed modifications of cysteine carbamidomethylation, and variable methionine oxidation. No restriction criteria were set with respect to protein molecular weight and pI values. Identity of a particular candidate protein was confirmed by MS/MS peptide sequencing, when either the probability-based Mowse score was only slightly higher than the threshold value calculated for the parameters used or the sequence coverage was too low.
Statistical analysis
Statistical analysis was performed using a Student's t-test, the p-values of <0.05 being considered significant.Citation22
RESULTS
Changes in proteins
Twenty urine samples collected from AFD patients were analyzed in this study. Two examples of electrophoretograms are shown in . Urinary spectra of all the AFD samples included identical proteins, most of them with molecular weight around 20–40 kDa ().
Figure 1. Comparison of 2D electrophoreograms of urine samples collected from patients with Fabry disease (A, B) and healthy controls (C, D). The urine samples were analyzed immediately after their collection and short-time centrifugation, using 7 cm polyacrylamide strips, pH 3–10 L, and SDS-PAGE. BenchMarkTM Protein Ladder (Invitrogen, Glasgow, UK) was used as a molecular mass marker.
There was no significant difference in the distribution of proteins on electrophoretograms in AFD patients undergoing ERT, compared to those without therapy or healthy controls (). No α-gal A activity was detected in the urine samples examined. α-gal A activity was measured as published.Citation23
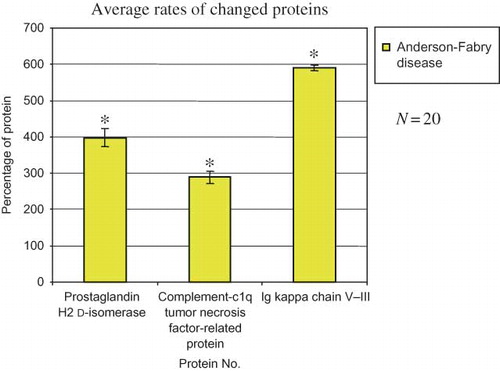
Quantitative analysis revealed significantly increased amount of some proteins with molecular weights about 30 kDa in AFD patients. This finding was then confirmed by software Phoretix 2D expression 2005. We picked out three proteins, the quantities of which were significantly higher in the AFD subjects, compared to the healthy controls; in the AFD samples, the levels of prostaglandin H2 d-isomerase and complement-c1q tumor necrosis factor-related protein were three times higher and the Ig kappa chain V–III levels were more than five times higher, compared to the controls (, ).
Table 2. Changes of selected proteins observed using Phoretix 2D expression software version 2005
Figure 2. Changes in the protein amount in the samples collected from 20 patients with Fabry disease compared with those in healthy controls. *p < 0.05 versus healthy controls.
Characterization of proteins
Some AFD proteins also included differentially expressed spots. These were then excised and subjected to in-gel tryptic digestion and identification by MALDI-TOF MS. In cases when the sequence coverage was too low, identity of the protein candidate was confirmed by MS/MS peptide sequencing. The abundant proteins in the gels were characterized as alpha-1-antitrypsin, alpha-1-microglobulin, prostaglandin H2 d-isomerase, complement-c1q tumor necrosis factor-related protein, Ig kappa chain V–III (). Positions of all the proteins identified on 2D gels were compared with their theoretical isoelectric points and molecular sizes (). Most of the proteins were in the expected range, except prostaglandin H2 d-isomerase. This exception may be caused by glycosylation at Asn51 and Asn78 sites.
Figure 3. A representative 2D gel image of the Fabry disease proteome, depicting all identified proteins. All urine samples were analyzed immediately after their collection using 7 cm polyacrylamide strips, pH 3–10 L, and SDS-PAGE.
Table 3. Comparison of experimental and theoretical molecular size and isoelectric point of identified proteins by MALDI-TOF MS
DISCUSSION
Two-dimensional electrophoresis followed by MALDI-TOF MS is a powerful tool for studying protein changes and for their identification. The main aim of most clinical studies using this technique is to identify possible biomarkers typical for specific diseases. In our previous study,Citation15 lucid spectra of proteins were investigated in patients with nephrotic proteinuria and other diagnoses, such as systemic lupus erythematosus with renal involvement (lupus nephritis) and anti-neutrophil cytoplasmic antibody (ANCA)-associated vasculitis. The main aim of our study was to analyze the composition or structure of proteins in urine samples in AFD patients, compared to that in normal subjects. No significant differences in the number of spots were detected between the healthy controls and the AFD patients; therefore, we may conclude that the disease does not lead to any formation of new proteins or degradation products. This conclusion can also be confirmed by comparison of the spectra obtained from AFD patients with the protein spectra obtained from nephrotic patients, in whom the protein quantity on the gel is substantially higher than in healthy volunteers.
Although qualitative changes were not detected, quantitative differences in protein contents were noted. We hypothesize that the increased quantity of proteins in urine is caused by the disease, because AFD is usually associated with impairment of proximal tubular function. This proximal tubular function impairment results in a failure to reabsorb a variety of filtered substances, particularly low-molecular-weight proteins. Most of the identified proteins were of plasma origin and, under normal conditions, would be reabsorbed in the proximal tubule via receptor-mediated endocytosis. On the other hand, analysis of quantitative changes revealed substantially increased Ig kappa chain V–III, complement-c1q tumor necrosis factor-related protein, and prostaglandin H2 d-isomerase. The first two protein levels were more than three times higher and the prostaglandin H2 d-isomerase level was five times higher than the respective values in the control subjects. The latter protein plays an important role in the regulation of phospholipid metabolismCitation6 and its excretion is significantly increased in patients with chronic renal failure.Citation24–26 The higher quantity of these three proteins could result from their increased synthesis or from increased glomerular basement membrane permeability.Citation27,Citation28 Impairment of secretion–reabsorption tubular processes because of lysosomal vacuoles affecting the renal tubular system appears to be the most likely cause, as the composition of the proteins, identified in the AFD subjects, appears to be very similar to a proteome found in patients with tubular proteinuria.Citation6,Citation29 Other changes in protein excretion were reported in a histochemical studyCitation30 showing that urinary excretion of integrin β3 originating from the vitronectin receptor was significantly increased in the AFD group, compared to a healthy control group.
Finally, the abundant proteins identified on 2D gels were subjected to MALDI-TOF MS analysis. All seven studied proteins (alpha-1-antitrypsin, alpha-1-microglobulin, prostaglandin H2 d-isomerase, complement-c1q tumor necrosis factor-related protein, Ig kappa chain V–III) were also found to be present in healthy individuals. Except for H2 d-isomerase, positions of all the other proteins on 2D gels corresponded to their theoretical isoelectric points and molecular sizes. We assumed that modifications such as glycosylation of H2 d-isomerase at Asn51 and Asn78 sites might have occurred, which could result in a change in molecular size of the enzyme and its isoelectric point. The glycosylation changes at the protein sites are of potential relevance and might serve as potential biomarkers. However, this presumption should be confirmed by future studies analyzing the relationship between the above findings and the disease severity and progression. Most of the articles published last year were focused on clinical studies of various types of therapy of the Fabry disease patients,Citation31 studies in patients prior to their ERT initiation,Citation32 or in patients treated with α-gal A (a glycoprotein of molecular size 101 kDa with a homodimeric structure) infusions, aimed at reducing the Gb3 storage in tissues.Citation11
CONCLUSION
Our proteomic analysis revealed no significant qualitative differences between the urine samples collected from the treated and untreated AFD subjects and the samples collected from the control subjects. However, quantity of several proteins was substantially different in the AFD group and the control group. In addition, the molecular size of H2 d-isomerase was shown to be modified. These findings should be confirmed by future studies analyzing the relevance of the observed changes for prediction of the disease severity and outcomes.
Acknowledgments
The authors are grateful to K. Pelinková, MSc, and A. Břichnáčová, MSc, from the Institute of Clinical Biochemistry and Laboratory Diagnostics, First Faculty of Medicine of Charles University and General Teaching Hospital, for technical cooperation. This study was supported by research project of the Ministry of Health of the Czech Republic (No. 64165), the Grant Agency of Charles University (No. 203434/54), and by grants of the Ministry of Education, Youth and Sports of the Czech Republic (MSM 0021620806 and LC 06044).
Declaration of interest: The authors report no conflicts of interest. The authors alone are responsible for the content and writing of the paper.
REFERENCES
- Beck M, Ricci R, Widmer U, Fabry disease: Overall effects of agalsidase alfa treatment. Eur J Clin Invest. 2004;34:838–844.
- Mehta A, Ricci R, Widmer U, Fabry disease defined: Baseline clinical manifestations of 366 patients in the Fabry Outcome Survey. Eur J Clin Invest. 2004;34:236–242.
- Elleder M. Sequelae of storage in Fabry disease – pathology and comparison with other lysosomal storage diseases. Acta Paediatr Suppl. 2003;92:46–53.
- Linhart A, Palecek T, Bultas J, New insights in cardiac structural changes in patients with Fabry's disease. Am Heart J. 2000;139:1101–1108.
- Linhart A, Elliott PM. The heart in Anderson-Fabry disease and other lysosomal storage disorders. Heart. 2007;93:528–535.
- Tesar V, Zima T, Kalousová M. Pathobiochemistry of nephrotic syndrome. Adv Clin Chem. 2003;37:173–218.
- Schiffmann R, Murray GJ, Treco D, Infusion of α-galactosidase A reduces tissue globotriaozylceramide storage in patients with Fabry disease. Proc Natl Acad Sci USA. 2000;97:365–370.
- Spada M, Pagliardini S, Yasuda M, High incidence of later-onset Fabry disease revealed by newborn screening. Am J Hum Genet. 2006;79:31–40.
- MecDermot J, Holmes A, Miners A. Anderson-Fabry disease: Clinical manifestations in a cohort of 60 obligate carrier females. J Med Genet. 2001;38:769–775.
- Eng CM, Guffon N, Wilcox WR, Safety and efficacy of recombinant human α-galactosidase A-replacement therapy in Fabry's disease. N Engl J Med. 2001;345:9–16.
- Schiffmann R, Kopp JB, Austin HA. Enzyme replacement therapy in Fabry disease: A randomized controlled trial. J Am Med Assoc. 2001;285:2743–2749.
- Banikazemi M, Bultas J, Waldek S, Agalsidase-beta therapy for advanced Fabry disease: A randomized trial. Ann Intern Med. 2007;146:77–86.
- Aerts JM, Groener JE, Kuiper S, Elevated globotriaosylsphingosine is a hallmark of Fabry disease. Proc Natl Acad Sci USA. 2008;105(8):2812–2817.
- Schiffmann R, Waldek S, Benigni A, Auray-Blais Ch. Biomarkers of Fabry disease nephropathy. Clin J Am Soc Nephrol. 2010;5(2):360–364.
- Vojtová L, Zima T, Tesar V, Kazderová M. Study of urinary proteomes in patients with nephrotic syndrome. Folia Biol (Praha). 2007;53(2):58–65.
- Cutillas PR, Chalkley RJ, Hansen KC, The urinary proteome in Fanconi syndrome implies specificity in the reabsorption of proteins by renal proximal tubule cells. Am J Physiol Renal Physiol. 2004;287:F353–F364.
- Pieper R, Gatlin ChL, McGrath AM. Characterization of the human urinary proteome A method for high-resolution display of urinary proteins on two-dimensional electrophoresis gels with a yield of nearly 1400 distinct protein spots. Proteomics. 2004;4:1159–1174.
- Rossing K, Mischak H, Parving H-H. Impact of diabetic nephropathy and angiotensin II receptor blockade on urinary polypeptide patterns. Kidney Int. 2005;68:193–205.
- Joo W-A, Lee D-Y, Kim Ch-W. Development of an effective sample preparation method for the proteome analysis of body fluids using 2-D gel electrophoresis. Biosci Biotechnol Bioc hem. 2003;67:1574–1577.
- Bradford MM. A rapid and sensitive method for the quantitation of microgram quantities of protein utilizing the principle of protein-dye binding. Anal Biochem. 1976;72:248.
- Watanabe N, Kamei S, Ohkubo A. Urinary protein as measured with a pyrogallol red-molybdate complex, manually and in a Hitachi 726 automated analyzer. Clin Chem. 1986;32: 1551–1554.
- Kleinbaum DG, Kupper CL, Muller KF. Applied Regression Analysis and Other Multivariable Methods. Boston: PWS-Kent; 1988.
- Dean KJ, Sung SS, Sweeley CC. The identification of alpha-galactosidase B from human liver as an alpha-N-acetylgalactosaminidase. Biochem Biophys Res Commun. 1977;77(4):1411–1417.
- Ogawa M, Hirawa N, Tsuchida T. Urinary excretions of lipocalin-type prostaglandin D2 synthase predict the development of proteinuria and renal injury in OLETF rats. Nephrol Dial Transplant. 2005;21:924–934.
- Oda H, Shiina Y, Seiki K. Development and evaluation of a practical ELISA for human urinary lipocalin-type prostaglandin D synthase. Clin Chem. 2002;48:1445–1453.
- Tsuchida T, Eguchi N, Eguchi Y. Lipocalin-type prostaglandin D synthase in urine in adriamycin-induced nephropathy of mice. Nephrol Physiol. 2004;96:42–51.
- Tesar V, Zima T. Recent progress in pathogenesis of nephrotic proteinuria. Crit Rev Clin Lab Sci. 2008;45:139–220.
- Haraldsson B, Nystrom J, Deen WM. Properties of the glomerular barrier and mechanisms of proteinuria. Physiol Rev. 2008;88:451–487.
- Vilasi A, Cutillas PR, Maher AD. Combined proteomic and metabonomic studies in three genetic forms of the renal Fanconi syndrome. Am J Physiol Renal Physiol. 2007;293:456–467.
- Utsumi K, Itoh K, Kase R. Urinary excretion of the vitronectin receptor (integrin αVβ3) in patients with Fabry disease. Clin Chem Acta. 1999;279:55–68.
- Moran V, Obrador GT, Thandahi R. Fabry kidney disease. Saudi J Kidney Dis Transpl. 2003;14(1):367–377.
- Ortiz A, Oliviera JP, Waldek S. Nephropathy in males and females with Fabry disease: Cross-sectional description of patients before treatment with enzymereplacement therapy. Nephrol Dial Transplant. 2008;23:1600–1607.