Abstract
This study aims to investigate the role of Notch pathway in the renal ischemia/reperfusion injury (IRI)-associated inflammation and apoptosis. Materials and methods: Male Sprague–Dawley rats were divided into three groups: normal saline (NS)-treated sham rats, NS-treated ischemia/reperfusion (I/R) rats, and N-[N-(3,5-difluorophenacetyl-l-alanyl)]-S-phenylglycine t-butyl ester (DAPT) (a γ-secretase inhibitor) treated I/R rats. I/R rat model underwent nephrectomy of the right kidney and was subjected to 60 min of left renal pedicle occlusion followed by 24 h, 48 h, and 72 h of reperfusion, respectively. The levels of creatinine, urea nitrogen (BUN), interleukin (IL)-6, tumor necrosis factor (TNF)-α in serum samples and urinary N-acety-β-d-glucosaminidase (NAG) were assayed. Histological examinations were performed. The protein expression of Notch2, hairy/enhancer of split 1 (hes-1), NF-κB2, monocyte chemoattractant protein (MCP)-1, B-cell lymphoma 2 (bcl-2), and bcl-2-associated X (bax) were detected and the degree of apoptosis of tubular cells was evaluated. Results: Renal IR induced severe tubular damage, caused significant increases in the Scr, BUN, IL-6, TNF-α, urinary NAG, Notch2, hes-1, NF-κB2, MCP-1, ratio of tubule cells apoptosis, and reduction in the ratio of bcl-2 to bax. However, DAPT treatment significantly reduced the level of Scr, BUN, IL-6, TNF-α, and NAG. Thus, I/R activates Notch2/hes-1 signaling and DAPT treatment can ameliorate the severity of tubular damage after renal IRI, lower the expression of NF-κB2, MCP-1, and bax protein, increase the expression of bcl-2 protein, and reduce the ratio of terminal 2-deoxyuridine 5-triphosphate nick end-labeling-positive cells. Conclusion: Notch signaling plays an important role in the renal IRI-associated inflammation and apoptosis. DAPT can protect against IRI through partly suppressing inflammation and apoptosis, which could constitute a new target for AKI.
INTRODUCTION
Acute kidney injury (AKI) is a common clinical syndrome with an abrupt decrease in kidney function. Although significant advances have been made in basic research along with important technical advances in the recent decades, AKI still has high morbidity and mortality due to unclear mechanisms and a lack of disease-specific interventions.Citation1 Ischemia/reperfusion injury (IRI) is one of the major causes of AKI. Both inflammation and apoptosis contribute to the development and progression of renal IRI.Citation2,Citation3 IRI can lead to endothelial dysfunction that initiates the inflammatory cascades by inflammatory corpuscle infiltration and cytokine/chemotactic cytokine production.Citation2,Citation4 The generation of tumor necrosis factor (TNF)-α, interleukin (IL)-6, and monocyte chemoattractant protein (MCP)-1 by leukomonocytes and monocytes causes tubular damage, resulting in the initiation of AKI.Citation4 Tubular epithelial cells, acting as a kind of inflammatory cell in the setting of IRI, also produce MCP-1 and IL-8Citation4 by increasing complement binding and upregulating toll-like receptorsCitation5 to amplify the inflammation. Nuclear transcription factor-kappa B (NF-κB), thought to play a central role in the regulation of inflammatory mediator and apoptosis, mediates the transcription of MCP-1 factors.Citation6 The important role of inflammatory mediators such as IL-2 and IL-6 in patients with AKI has been confirmed by clinical studies in which their removal from the plasma by dialysis has proved beneficial.Citation7 Inhibition of IL-6, IL-1, and TNF-α provided protection against IRI-induced inflammation and apoptosis.Citation8–10 Thus the resolution of inflammation and apoptosis within the kidney following IRI provides a promising therapeutic strategy for AKI. However, employing these findings into the clinical setting still remains elusive because clinical trials have not proven their effectiveness.Citation4 It is thus necessary to further understand the mechanisms and search for new targets for AKI.
Notch signaling pathway, comprising transmembrane receptors, their ligands, negative and positive modifiers, and transcription factors,Citation11 influences cellular proliferation and differentiation.Citation12,Citation13 The Notch receptor is cleaved by γ-secretase followed by binding of Notch receptors (Notch 1–4) with their ligands (Delta-1, Delta-3, Delta-4, Jagged-1, and Jagged-2) on adjacent cells. This results in the release of the intracellular domain of Notch (NICD) that translocates to the nucleus and interacts with recombination signal binding protein-Jk (RBP-Jk), converting it from a repressor to an activator of gene transcriptionCitation14 and activates transcription from the RBP-Jk DNA binding site. The NICD–RBP-Jk complex up-regulates expression of hairy/enhancer of split 1 (hes-1), which promotes NF-κB gene transcription.Citation15 A number of studies have recently identified requirements for Notch signaling during kidney organogenesis.Citation16,Citation17 Notch2 gene mutation leads to the abnormal development of proximal nephron structure.Citation18 During development, Notch signaling activity is very high in the kidney, but very little active expression of Notch pathway in the mature kidney can be detected.Citation19 However, Notch signaling has been seen to induce podocyte apoptosis in diabetic nephropathy (DN) kidneys,Citation20 lead to epithelial-to-mesenchymal transition in kidney fibrosis,Citation21 and promote the development of inflammation.Citation22,Citation23 Recent studies have demonstrated that Notch pathway could also be reactivated in rats with renal IRI.Citation24,Citation25 Therefore, we presume that reactivated Notch signaling contributes to the development of renal IRI followed by inflammation and apoptosis.
To confirm this hypothesis, we used rats with renal IRI to examine the activation of the Notch signaling pathway within the kidney, its role in the regulation of inflammatory factors (NF-κB, MCP-1, IL-6, TNF-α) and apoptosis [bcl-2, bax, ratio of terminal 2-deoxyuridine 5-triphosphate nick end-labeling (TUNEL)-positive cells], and the presence of γ-secretase inhibitor N-[N-(3,5-difluorophenacetyl-l-alanyl)]-S-phenylglycine t-butyl ester (DAPT)-induced nephroprotective effect against renal IRI.
MATERIALS AND METHODS
Animals and Induction of Renal IRI
All protocols were approved by the Institutional Animal Care and Use Committee of Central South University. Experiments were performed in adult healthy male Sprague–Dawley (SD) rats weighing 200 ± 20 g, which were housed at a constant temperature and humidity, with a 12–12 h light–dark cycle, and unrestricted access to a standard diet and water. The 45 SD rats were randomly divided into three groups: normal saline (NS)-treated sham group (sham, n = 15), NS-treated ischemia/reperfusion (I/R) group (I/R + NS, n = 15), and DAPT treatment group (I/R + DAPT, n = 15). Renal IRI models were induced as described previously.Citation26 Rats were anesthetized with intraperitoneal pentobarbital (50 mg/kg) and placed in a heating pad under a warming light to maintain body temperature between 36°C and 38°C. Additional pentobarbital was given as needed. Unilateral flank incisions were made, and right kidneys were excised and collected as the normal group kidneys. After a 10 min stabilization period, the left kidney was subjected to 60 min of ischemia with atraumatic vascular clamp. Then the clamp was removed. Kidneys showed restoration of renal blood flow within 5 min. Twenty-four hours before operation and 16 h after reperfusion, the rats in the DAPT treatment group received DAPT (500 µg/100 g1) by intraperitoneal injection. NS-control group received the vehicle NS with an equivalent volume. Sham group rats, subjected to the same surgical procedure without clamping the left renal vessels, received the same volume of (vehicle) NS. At 24 h, 48 h, and 72 h, respectively, after I/R, the rats in each group (n = 5) were killed. Urine was collected for the N-acetyl-β-d-glucosaminidase (NAG) test. Intravenous blood for chemical analysis was obtained at the indicated time points. Serum samples were obtained by centrifugation.
The Detection of Kidney Function
Kidney function was evaluated by the measurement of Scr and BUN with a Biochemical Autoanalyzer (Olympus, Tokyo, Japan).
The Detection of the Level of Serum TNF-α and IL-6
The concentrations of serum TNF-α and IL-6 were measured by enzyme-linked immunosorbent assay (ELISA) according to the protocol provided by the supplier (BPB Biomedical, Stoughton, MA, USA). The reactions were read using an ELISA reader at 450 nm.
The Evaluation of Renal Tubular Damage
In this study, we assessed renal tubular damage by the detection of urinary NAG with Microplate colorimetric assay. Meanwhile, histological examinations were used as a means of evaluating tubular damage. In brief, the left kidney samples were excised at the specific time points as detailed above. One-half of each kidney was snap-frozen in liquid nitrogen and stored at −70°C; the other half was fixed in 4% paraformaldehyde phosphate buffer solution overnight. After automated dehydration through a graded alcohol series, transverse kidney slices were embedded in paraffin, and sections of 5–8 µm made. Serial sections were stained with hematoxylin and eosin for histopathological analysis. Ten fields (×400, 1 mm2/field) per section observed in the outer stripe of the outer medulla were examined by pathologists who were blind to this experiment. In terms of semi-quan titative score from 0 to 5 as described previously,Citation27 histopathological change was scored based on the percentage of injured renal tubules: 0, none; 1, less than 10%; 2, less than 25%; 3, less than 45%; 4, less than 75%; and 5, higher than 75%. Histological changes included effacement and loss of proximal tubule brush border, patchy loss of tubule cells, focal areas of proximal tubular dilation and distal tubular casts, as well as areas of cellular regeneration.Citation4
Immunofluorescence Staining
The kidney samples stored at −70°C were used to make frozen sections. Then the frozen sections were fixed with 95% alcohol for 1 min at room temperature, and permeabilized in 0.1% Triton X-100 for 15 min. The frozen sections were then blocked in 10% goat blocking serum at 37°C for 30 min followed by incubation with Notch2 goat polyclonal IgG (1:150) (Santa Cruz, CA, USA), hes-1 goat polyclonal IgG (1:150) (Santa Cruz), NF-κB2 goat polyclonal IgG (1:150) (ABM, Richmond, BC, Canada), Mcp-1 goat polyclonal IgG (1:150) (Boster Biotch, Wuhan, China) overnight. After three washings with phosphate-buffered saline, the sections were incubated with fluorescein isothiocyanate-conjugated goat anti-rabbit IgG (1:50) at 37°C for 1 h. The results were evaluated under a confocal laser-scanning microscope.
Western Blot
Protein samples were prepared by homogenizing kidneys in a Dounce homogenizer, and immediately placed in ice-cold RIPA buffer (150 mM NaCl, 50 mM Tris–HCl, 1 mM ethylenediaminetetraacetic acid, and 1% Triton X-100, pH 7.4) for 10 min on ice. The samples were centrifuged for 10 min at 12,000 g/min. The supernatant was collected. We mixed the kidney protein samples in Laemmli loading buffer; the mixtures were boiled for 10 min, and then subjected to SDS-PAGE. After electrophoresis, proteins were transferred onto a polyvinylidene fluoride membrane (Immobilon-P; Millipore, Bedford, MA, USA) in a transfer buffer (25 mmol Tris, 0.2 mol glycine, and 20% methanol) using a wet transfer unit of the X cell SureLock system and blotted against Notch2 goat polyclonal IgG (1:300) dilution (Santa Cruz), hes-1 goat polyclonal IgG (1:300 dilution, Santa Cruz), NF-κB2 goat polyclonal IgG (1:300 dilution, ABM), MCP-1 goat polyclonal IgG (1:300 dilution) (Boster Biotch), and β-actin (Santa Cruz, 1:300 dilution) overnight. Membranes were washed with phosphate-buffered saline with 0.05% TWEEN-20 and incubated with a secondary antibody (1:1000 dilution) for 2 h. Protein bands were visualized by chemiluminescence reaction. The integrated optical density (IOD) was measured by the Image-pro Plus Software. The ratio of IOD between target protein bands and β-actin bands was used as a quantitative indicator of Notch2, hes-1, NF-κB2, and MCP-1 protein expression.
Terminal 2-Deoxyuridine 5-Triphosphate Nick End-Labeling Assay
A TUNEL was performed using an in situ apoptosis detection kit (TBD, Tianjin, China) according to a modified manufacturer's protocol. Color was developed using 0.05% diaminobenzidine with 0.006% H2O2 as a substrate. The sections were washed in water, counterstained with methyl green, dehydrated through a graded alcohol series, cleared in xylene, and mounted with Permount for observation under a light microscope. As a negative control, distilled water was used in place of the terminal deoxynucleotidyl transferase enzyme. The ratio of TUNEL-positive cells to the total number of cells in ten fields per section (original magnification ×200) was used to represent renal tubular apoptosis.
Statistical Analysis
Results were expressed as mean ± SEM. Statistical differences among groups were analyzed using analysis of variance and a t-test carried out using the least squares difference method as a post hoc comparison. A p-value of <0.05 was considered significant.
RESULTS
Effect of DAPT on Kidney Function after Renal IRI
Compared with rats in the sham group, BUN and Scr levels in the I/R + NS group were significantly higher (p < 0.05, ), both peaking at 24 h after reperfusion, then decreasing and still maintaining higher levels at 72 h following I/R. However, DAPT treatment significantly reduced the level of BUN and Scr when compared with I/R + NS group rats (p < 0.05, ). Urinary NAG levels in the I/R + NS group rats were markedly higher than those in the sham group, which were consistent with the levels of BUN and Scr, which peaked at 24 h following reperfusion (p < 0.05, ). DAPT treatment resulted in a significant reduction of urinary NAG concentrations when compared with the I/R + NS group (p < 0.05, ).
Figure 1. The effect of DAPT on the kidney function: (A) the level of BUN, (B) the level of serum creatinine. Values are presented as mean ± SEM, *p < 0.05 versus sham. **p < 0.05 versus I/R + NS at the same time point.
Figure 2. The effect of DAPT on the the urinary NAG level. Values are presented as mean ± SEM, *p < 0.05 versus sham at the same time point. **p < 0.05 versus I/R + NS, at the same time point.
Effect of DAPT on the Histology after Renal IRI
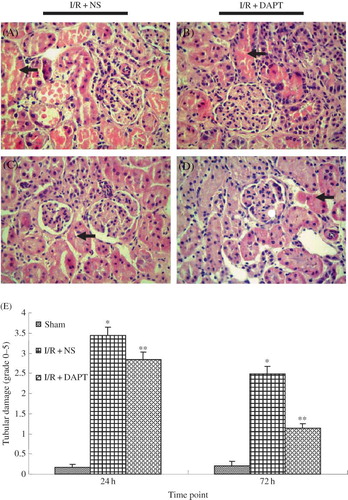
Histological examination revealed that renal IRI induced tubulointerstitial injury including focal areas of proximal tubular dilation and distal tubular casts, effacement and loss of proximal tubule brush border, and interstitial inflammatory cell infiltration.Citation4 However, the semi-quantitative scores showed that rats in the renal I/R group presented severe pathological alterations at 24 h compared with those in the sham group (3.44 ± 0.21 vs. 0.16 ± 0.09, p < 0.05, ). The semi-quantitative scores in the I/R + DAPT group were decreased at 24 h and 72 h post-reperfusion, respectively, compared with the I/R + NS group (2.84 ± 0.19 vs. 3.44 ± 0.21 at 24 h, 1.14 ± 0.11 vs. 2.48 ± 0.19 at 72 h, p < 0.05, ).
Figure 3. The effect of DAPT on the Histology: (A–D) Renal histological changes at 24 h, 72 h after renal IRI, (A) I/R + NS group at 24 h; (B) I/R + DAPT group at 24 h; (C) I/R + NS group at 72 h; (D) I/R + DAPT group at 24 h; and (E) semi-quantitative score of tubular damage. Each column represents the mean of acquired data (mean ± SEM), *p < 0.05 versus sham group at the same time point. **p < 0.05) versus I/R + NS group at the same time point.
Activation of Notch Signaling after Renal IRI
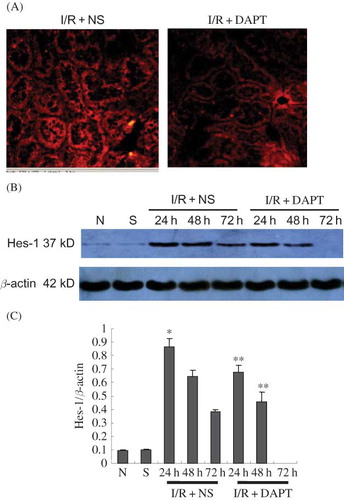
Immunofluorescence indicated that there was no positive protein expression of Notch2 in either the normal group or the sham group rats. Slight hes-1 expressions were found in both normal group and sham group. However, IRI induced strongly positive staining of both Notch2 () and hes-1 proteins () in the renal tubules. DAPT treatment weakened the intensity of fluorescence due to Notch2 () and hes-1 (). Western blot showed that renal IRI led to the increase of Notch2 and hes-1 protein expression, which reached a peak at 24 h after reperfusion, then gradually decreased at 48 h and 72 h ( and ). There was significant difference in hes-1 protein between I/R + NS group and sham group (0.86 ± 0.06 vs. 0.810 ± 0.00, p < 0.05, ) at 24 h post-reperfusion. However, DAPT treatment led to faster reduction in the expression of Notch2 (0.66 ± 0.06 vs. 0.82 ± 0.04 at 24 h, 0.40 ± 0.04 vs. 0.58 ± 0.05 at 48 h, p < 0.05, ) and hes-1 protein (0.67 ± 0.06 vs. 0.86 ± 0.06 at 24 h, 0.46 ± 0.07 vs. 0.65 ± 0.04 at 48 h, p < 0.05, ) when compared with the I/R + NS group.
Figure 4. The expression of Notch2 protein (A–C): (A) The expression of Notch2 in the kidney at 24 h following IRI by immunofluorescence staining (original magnification ×400): renal IRI induced the increase of Notch2 protein expression in the renal tubules. DAPT treatment reduced the expression of Notch2 protein. (B) Immunoblot analysis of Notch2 protein at 24 h, 48 h, and 72 h of post-reperfusion, respectively. (C) The density of band was quantified. Values presented are ratio of Notch2 to β-actin, which was used as an equal protein loading marker. Results are presented as mean ± SEM (n = 5), *p < 0.05 versus respective IR + NS at the same time point.
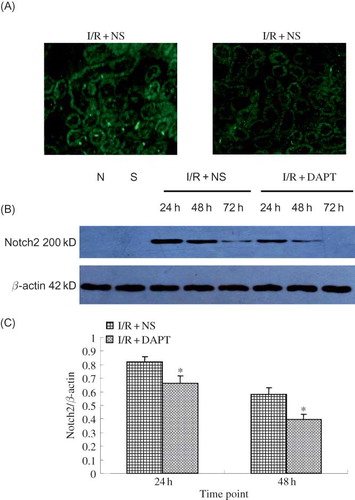
Figure 5. The expression of hes-1 protein (A–C): (A) The expression of hes-1 protein in the kidney at 24 h following IRI by immunohistochemistry staining (original magnification ×400). Renal IRI induced the increase of hes-1 protein expression in the renal tubules. DAPT treatment reduced the expression of hes-1 protein. (B) Immunoblot analysis of hes-1 protein at 24 h, 48 h, and 72 h of post-reperfusion, respectively. (C) The density of band was quantified. Values presented are ratios of hes-1 to β-actin, which was used as an equal protein loading marker. Results are presented as mean ± SEM (n = 5), *p < 0.05 versus sham group at the same time point. **p < 0.05 versus respective IR + NS at the same time point.
Effect of DAPT on the Inflammation after Renal IRI
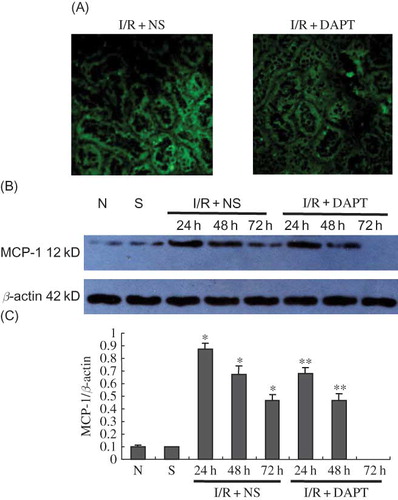
ELISA results indicated that renal IRI induced sharp increases in the concentration of TNF-α and IL-6 in the serum, which also reached a peak at 24 h after reperfusion, then gradually decreased at 48 h and 72 h. There was significant difference between I/R + NS group and sham group in serum TNF-α (2071.00 ± 391.77 vs. 112.94 ± 47.90, p < 0.05, ) and IL-6 (3749.20 ± 588.94 vs. 782.20 ± 99.11, p < 0.05, ) at 24 h. The difference in serum TNF-α and IL-6 at the same time points between I/R + DAPT group and I/R + NS group was also significant (p < 0.05, ). We then observed the protein expression of NF-κB2 and MCP-1. Our immunofluorescence results showed that normal and sham group rats exhibited weaker staining of NF-κB2 in the kidney tubules (). However, the strongest positive staining against NF-κB2 antibody was observed mainly in the tubule at 24 h, and gradually weakened at 48 h and 72 h after renal IRI (). We also found strongly positive staining against MCP-1 antibody in the kidney tissues that presented the same trend with the NF-κB2 staining (). Our Western Blot results showed that renal IRI led to a marked increase of NF-κB2 () and MCP-1 () protein expression in the kidney tissue at 24 h, with later gradual reduction at 48 h and 72 h after reperfusion. DAPT treatment resulted in a much more rapid decrease in the protein expression of NF-κB2 (p < 0.05, ) and MCP-1 (p < 0.05, ) than those in the I/R + NS group by inactivation of Notch signaling.
Figure 6. The effect of DAPT on the serum IL-6 and TNF-α level. (A) the level of IL-6, (B) the level of TNF-α. Values are presented as mean ± SEM, *p < 0.05 versus sham at the same time point. **p < 0.05 versus I/R + NS, at the same time point.
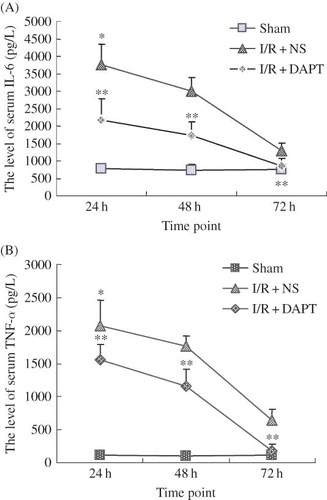
Figure 7. (A) The expression of NF-κB2 in the kidney at 24 h following IRI by immunofluorescence staining (original magnification ×400); renal IRI induced the increase in expression of NF-κB2 protein that translocates into the nucleus; DAPT treatment reduced the expression of NF-κB2 protein. (B) Immunoblot analysis of NF-κB2 protein at 24 h, 48 h, and 72 h of post-reperfusion, respectively. (C) The density of band was quantified. Values presented are ratios of NF-κB2 to β-actin, which was used as an equal protein loading marker. Results are presented as mean ± SEM (n = 5), *p < 0.05 versus sham group.**p < 0.05 versus respective IR + NS at the same time point.
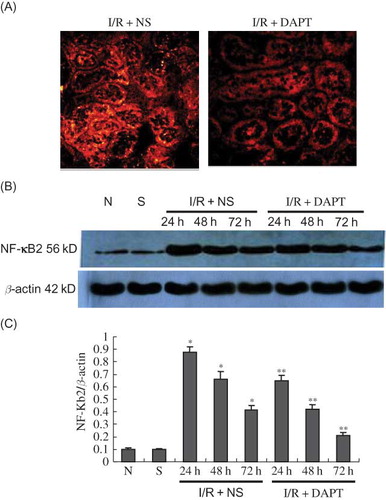
Figure 8. The expression of MCP-1 protein (A–C): (A) The expression of MCP-1 protein in the kidney at 24 h following IRI by immunofluorescence staining (original magnification ×400); renal IRI induced the increase of MCP-1 protein expression in the renal tubules; DAPT treatment reduced the expression of MCP-1 protein. (B) Immunoblot analysis of MCP-1 protein at 24 h, 48 h, and 72 h of post-reperfusion, respectively. (C) The density of the bands was quantified. Values presented are ratios of MCP-1 to β-actin, which was used as an equal protein loading marker. Results are presented as mean ± SEM (n = 5), *p < 0.05 versus respective sham. **p < 0.05 versus respective IR + NS at the same time point.
Effect of DAPT on Renal Tubule Epithelium Cell Apoptosis Following Renal IRI
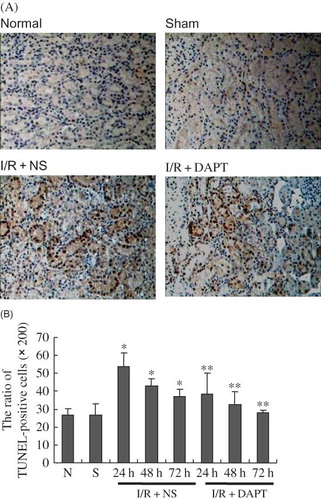
Our results showed that the ratio of TUNEL-positive renal tubule epithelium cells was increased significantly compared with the normal or sham rats (p < 0.05, ), which peaked at 24 h after renal IRI. DAPT treatment significantly reduced the ratio of TUNEL-positive cells in I/R + NS group rats (p < 0.05, ). We next determined the expression of bcl-2 and bax proteins in the kidney following IRI using Western blot. Both bcl-2 and bax proteins in I/R + NS group rats were significantly increased at 24 h after renal IR compared with normal or sham rats (p < 0.05, ), and gradually decreased at 48 h and 72 h. However, the ratio of Bcl-2 to bax was significantly lowered in I/R + NS rats compared with normal or sham rats (p < 0.05, ), but DAPT raised the bcl-2/bax ratio.
Figure 9. The expression of bcl-2 and bax protein (A–D): (A) Immunoblot analysis of bcl-2 and bax protein in kidneys. (B–D) Renal IRI induced the increase of bcl-2 and bax expression at 24 h post-reperfusion. However, bcl-2 protein continued to increase and bax expression gradually kept decreasing at 48 h and 72 h of post-reperfusion. DAPT treatment resulted in increased bcl-2 protein and decreased bax protein, giving a higher ratio between bcl-2 and bax. The band density was quantified. Values presented are ratios of bcl-2(or bax) to β-actin, which was used as an equal protein loading marker. Results are presented as mean ± SEM (n = 5), *p < 0.05 versus respective sham. **p < 0.05 versus respective IR + NS.) versus I/R + NS at the same time point.
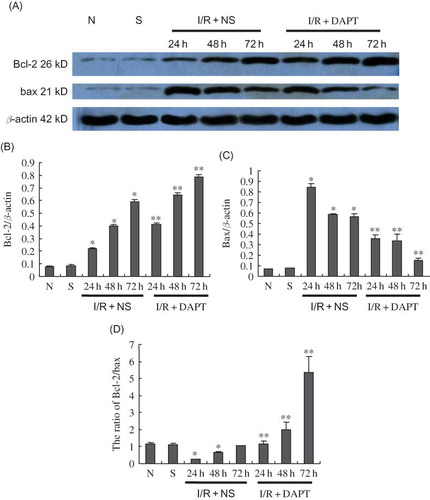
Figure 10. Photomicrographs of representative TUNEL assay results (original magnification ×200) (A) The expression of TUNEL-positive cells in the kidney at 24 h following IRI; DAPT treatment reduced IRI-induced significant increase of renal tubular cell apoptosis. (B) The ratio of numbers of TUNEL-positive cells at 24 h, 48 h, and 72 h of post-reperfusion, respectively, Results are presented as mean ± SEM (n = 5), *p < 0.05 versus respective sham. **p < 0.05 versus respective IR + NS at the same time point.
DISCUSSION
In this study, our results reveal that DAPT protects against renal IRI by reducing urinary NAG, decreasing level of BUN, Scr, and attenuating renal tubule histological injury. This protection may result primarily from the suppression of IRI-associated inflammation and apoptosis, as demonstrated by our findings. Inhibition of Notch2/hes-1 signaling activation by DAPT treatment lowers the level of NF-κB2, MCP-1, TNF-α, IL-6, and bax protein, increases the expression of bcl-2 protein, and reduces the ratio of TUNEL-positive cells.
Notch signaling pathway plays a critical role in the regulation of organ development (including kidney,Citation12 cardiovascular system,Citation28 etc.). Mice with homozygous targeted mutations in Jagged1,Citation29 Notch1,Citation30 and Notch2 genesCitation17 showed lethal defects in the development of the kidney. Recently, in vitro and in vivo studies have shown that the reactivation of Notch signaling pathway was implicated in apoptosis of podocytes in rodent models of focal segmental glomerulosclerosis and DN.Citation19 Our study finds that, in agreement with previous studies,Citation19,Citation31 protein expression of Notch2 is not observed in the normal and sham group rats. However, Renal IRI induces significant increase in the protein expression of Notch2 and hes-1. These results reveal that Notch pathway is activated after reperfusion.Citation24,Citation25 Our work also indicates that the expression of Notch2 and hes-1 proteins reaches a peak at 24 h after reperfusion, a time point that coincides with the peak of renal tubular injury, urinary NAG levels, BUN, Scr, serum TNF-α and IL-6, and tubule cell apoptosis. Furthermore, inhibition of Notch2/hes-1 signaling activation by DAPT treatment attenuates the severity of renal tubule damage, improves kidney function, lowers the concentration of pre-inflammation factors (TNF-α and IL-6), and reduces the number of apoptotic tubule cells. These results strongly suggest that Notch pathway might be involved in inflammation and apoptosis associated with IRI and that DAPT might protect against renal IRI.
NF-κB, as a key mediator of inflammation factors, is a target gene of activated Notch-1 via RBP-JkCitation15,Citation32 that shares a high degree of similarity with an 8-bp DNA motif in the NF-kB2 promoter.Citation33 Moran et al. have also demonstrated the existence of cross-talk between Notch2 and NF-κB signaling during the development of Marginal Zone B Lymphocytes.Citation34 In the present work, we find that expression of both NF-kB2 that is translocated into the nucleus and MCP-1 protein also reach a peak at 24 h after reperfusion, a time point that coincides with the peak of Notch2 and hes-1 proteins. Likewise, DAPT treatment reduces their expression, suggesting that Notch pathway enhances the transcription of NF-kB2 and subsequently mediates increase in MCP-1 production. Nakazawa M et al.,Citation22 have found that NF-kB2 promoter activation via Notch signaling pathway plays an important role in the development of rheumatoid arthritis. Thus we deem it reasonable to attribute the anti-inflammation role of DAPT to the inhibition of NF kappa B-mediated transcription of TNF-α, IL-6, and MCP-1.
Apoptosis also contributes to the development and progression of renal IRI. The Bcl-2 family of proteins is composed of B-cell lymphoma 2 (bcl-2), bcl-2 associated X (bax) etc.Citation35 The ratio of Bcl-2 to bax determines the susceptibility to apoptosis through regulating the release of Cytochrome C from mitochondria.Citation36 Up-regulation of the ratio of Bcl-2 to bax can provide protection against tubule cell apoptosis.Citation37,Citation38 Our results show that, although the expressions of bcl-2 and bax protein were up-regulated post-reperfusion, the ratio of bcl-2 to bax was decreased, and DAPT enhanced the bcl-2/bax ratio following a sharp reduction of TUNEL-positive cells in the tubules, which suggests that Notch pathway may play an important role in the I/R-associated tubular apoptosis. Studies have shown that blockage of TNF-α receptor can improve resistance to renal injury by increasing the Bcl-2/bax ratio.Citation10 Thus we speculate that the mechanism of DAPT against apoptosis results from the reduction of TNF-α production.
γ-Secretase is a key proteinase for the activation of Notch pathway by cleaving NICD. The inhibition of γ-Secretase can lead to blockage of the Notch pathway.Citation39 DAPT is a well-known γ-Secretase inhibitor. Interestingly, studies by Baiyang Shenga et al. demonstrated that inhibition of γ-Secretase by DAPT could reduce oxidative stress, increase the ratio of bcl-2/bax and lead to increased resistance to apoptosis.Citation40 Recent studies found that GSIXX, another γ-Secretase inhibitor, presented protection against apoptosis of podocytes.Citation19 Therefore, we believe that γ-Secretase may be considered as a promising pharmacological target.
In conclusion, we posit that Notch2/hes-1 signaling plays an important role in the inflammation and apoptosis following IRI, which may constitute a new target for the treatment of AKI. Further, DAPT can significantly suppress the inflammation and apoptosis following IRI.
Declaration of interest: The authors report no conflicts of interest. The authors alone are responsible for the content and writing of the paper.
References
- Togel F, Weiss K, Yang Y, Vasculotropic, paracrine actions of infused mesenchymal stem cells are important to the recovery from acute kidney injury. Am J Physiol Renal Physiol. 2007;292:1626–1635.
- Thurman JM. Trigger of inflammation after renal ischemia/reperfusion. Clin Immunol. 2007;123:7–13.
- Nakazawa J, Isshiki K, Sugimoto T, Renoprotective effects of asialoerythropoietin in diabetic mice against ischemia-reperfusion-induced acute kidney injury. Nephrology (Carlton). 2010;15(1):93–101.
- Devarajan P. Update on mechanisms of ischemic acute kidney injury. J Am Soc Nephrol. 2006;17:1503–1520.
- Kinsey GR, Li L, Okusa MD. Inflammation in acute kidney injury. Nephron Exp Nephrol. 2008;109:102–107.
- Panzer U, Steinmetz OM, Turner J-E, Resolution of renal inflammation: A new role for NF-kappa B1 (p50) in inflammatory kidney diseases. Am J Physiol Renal Physiol. 2009;297:429–439.
- Ronco C, Bellomo R, Homel P, Effect of different doses in continuous veno-venous hemofiltration on outcomes of acute renal failure: A prospective randomized trial. Lancet. 2000;356:26–30.
- Rusai K, Huang H, Sayed N. Administration of interleukin-1 receptor antagonist ameliorates renal ischemia-reperfusion injury. Transpl Int. 2008;21:572–575.
- Nechemia-Arbely Y, Barkan D, Pizov G, IL-6/IL-6R axis plays a critical role in acute kidney injury. J Am Soc Nephrol. 2008;9:1106–1115.
- Choi DE, Jeong JY, Lim, BJ, Pretreatment with the tumor nerosis factor-α blocker etanercept attenuated ischemia-reperfusion renal injury. Transplant Proc. 2009;41:3590–3596.
- Schweisguth F. Notch signaling activity. Curr Biol. 2004; 14:129–138.
- McCright B. Notch signaling in kidney development. Curr Opin Nephrol Hypertens. 2003;12:5–10.
- Fleming V. Structural conservation of Notch receptors and ligands. Cell Dev Biol. 1998;l9:599–607.
- Deftos ML, Bevan MJ. Notch signaling in T cell development. Curr Opin Immunol. 2000;12:166–172.
- Oswald F, Liptay S, Adler G. NF-kB2 is a putative target gene of activated Notch-1 via RBP-Jk. Mol Cell Biol. 1998;18:2077–2088.
- McLaughlin KA, Rones MS, Mercola M. Notch regulates cell fate in the developing pronephros. Dev Biol. 2000;227:567–580.
- Cheng H-T, Kim M, Valerius MT. Notch2, but not Notch1, is required for proximal fate acquisition in the mammalian nephron. Development. 2007;134:801–811.
- Piscione, TD, Wu, MY, Quaggin, SE. Expression of hairy/enhancer of Split gene, hes1 and hes5, during murine nephron morphogenesis. Gene Expr Patterns. 2004;4:707–711.
- Niranjan T, Bielesz B, Gruenwald A, The Notch pathway in podocytes plays a role in the development of glomerular disease. Nat Med. 2008;14:290–298.
- Morrissey J, Guo G, Moridaira K, Transforming growth factor-beta induce renal epithelial Jagged1 expression in fibrotic disease. J Am Soc Nephrol. 2002;13:1499–1508.
- Kang JH, Kim BS, Uhm TG, Gamma-secretase inhibitor reducesallergic pulmonary inflammation by modulating Th1 and Th2 responses. Am J Respir Crit Care Med. 2009;179:875–882.
- Nakazawa M, Ishii H, Nakamura H, NFkappaB2 (p52) promoter activation via Notch signaling pathway in rheumatoid synoviocytes[J]. Int J Mol Med. 2001;7:31–35.
- Nakazawa M, Ishii H, Aono H, Role of Notch-1 intracellular domain in activation of rheumatoid synoviocytes. Arthritis Rheum. 2001;44:1545–1554.
- Gupta S, Li S, Abedin MJ, Effect of Notch activation on the regenerative response to acute renal failure. Am J Physiol Renal Physiol. 2010;298:209–215.
- Kobayashi T, Terada Y, Kuwana H, Expression and function of the Delta-1/Notch-2/Hes-1 pathway during experimental acute kidney injury. Kidney Int. 2008;73:1240–1250.
- Kara M, Tellioglu G, Sehirli O, Evaluation of gadolinium pre-treatment with or without splenectomy in the setting of renal ischemia reperfusion injury in rats. Ren Fail. 2009;31:956–963.
- Sharyo S, Kumagai K, Yokota-Ikeda N, Amelioration of renal ischemia–reperfusion injury by inhibition of IL-6 production in the poloxamer 407–induced mouse model of Hyperlipidemia. J Pharmacol Sci. 2009;110:47–54.
- Niessen K, Karsan A. Notch signaling in the developing cardiovascular system. Am J Physiol Cell Physiol. 2007;293:1–11.
- Xue Y, Gao X, Lindsell CE, Embryonic lethality and vascular defects in mice lacking the Notch ligand Jagged1. Hum Mol Gen. 1999;8:723–730.
- Swiatek PJ, Lindsell CE, del Amo FF, Notch1 is essential for Post implantation development in mice. Genes. 1994;8:707–719.
- Wang P, Pereira FA, Beasley D, Presenilins are required for the formation of comma- and S-shaped bodies during nephrogenesis. Development. 2003;130:5019–5029.
- Guan, E, Wang J, Laborda J, T cell leukemia-associated human Notch/translocation-associated Notch homologue has IkB-like activity and physically interacts with nuclear factor-kB proteins in T cells. J Exp Med. 1996;183:2025–2032.
- Tun T, Hamaguchi Y, Matsunam N, Recognition sequence of a highly conserved DNA binding protein, RBP-Jk. Nucleic Acids Res. 1994;22:965–971.
- Moran ST, Cariappa A, Liu H, Synergism between NF-{kappa}B1/p50 and Notch2 during the development of marginal zone B lymphocytes. J Immunol. 2007;179:195–200.
- Yoshida T, Kurella M, Beato F, Monitoring changes in gene expression in renal ischemia-reperfusion in the rat. Kidney Int. 2002;61:1646–1654.
- Yang J, Liu X, Bhalla K, Prevention of apoptosis by Bcl-2: Release of cytochrome c from mitochondria blocked. Science. 1997;275:1129–1132.
- Ye J, Li J, Yu Y, L-carnitine attenuates oxidant injury in HK-2 cells via ROS-mitochondria pathway. Regul Pept. 2010; 161:58–66.
- Wu HH, Hsiao TY, Chien CT. Ischemic conditioning by short periods of reperfusion attenuates renal ischemia/reperfusion. J Biomed Sci. 2009;11:16–19.
- Wang M, Wu L, Wang L, Down-regulation of Notch1 by gamma-secretase inhibition contributes to cell growth inhibition and apoptosis in ovarian cancer cells A2780. Biochem Biophys Res Commun. 2010;393:144–149.
- Sheng B, Gong K, Niu Y, Inhibition of γ-secretase activity reduces Aβ production, reduces oxidative stress, increases mitochondrial activity and leads to reduced vulnerability to apoptosis: Implications for the treatment of Alzheimer's disease. Free Radic Biol Med. 2009;46:1362–1375.