Abstract
Background/aims: Atherosclerosis, coronary artery calcification, diabetes mellitus, inflammation, endothelial dysfunction, and left ventricular hypertrophy are the most commonly encountered risk factors in the pathogenesis of cardiovascular disease in end-stage renal disease (ESRD) patients. Epicardial adipose tissue (EAT) is the true visceral fat depot of the heart. The relationship between coronary artery disease (CAD) and EAT was shown in healthy subjects and patients with high risk of CAD. To date, there is not enough data about EAT in diabetic and nondiabetic ESRD patients. Therefore, we aimed to investigate the EAT and coronary artery calcification score (CACS) in diabetic and nondiabetic ESRD patients and healthy subjects. Methods: Sixty ESRD patients (17 diabetic, 43 nondiabetic ESRD patients) and 20 healthy subjects were enrolled in the study. EAT and CACS were performed by a 64-slice multidetector computed tomography scanner. Results: There were no differences in age, gender, body mass index, predialysis systolic and diastolic blood pressure levels, biochemical parameters including serum low-density lipoprotein and high-density lipoprotein cholesterol, triglycerides, and C-reactive protein between healthy subjects, diabetic, and nondiabetic ESRD patients. Total CACSs and EAT measurements were significantly higher in diabetic ESRD patients when compared with nondiabetic ESRD patients and healthy subjects. There was statistically significant relationship between EAT and CACS in ESRD patients (p < 0.0001, r = 0.48). Conclusion: In conclusion, we found a significant increase in terms of EAT and CACS in diabetic ESRD patients when compared with nondiabetic ESRD patients and healthy subjects.
INTRODUCTION
Atherosclerosis, endothelial dysfunction (ED), diabetes mellitus (DM), coronary artery calcification (CAC), and left ventricular hypertrophy (LVH) are the most commonly encountered risk factors in the pathogenesis of cardiovascular disease (CVD) in end-stage renal disease (ESRD) patients.Citation1,2 Patients with chronic kidney disease (CKD) have an unacceptable risk for premature death when compared with general population.Citation3 In a review of 85 studies, involving a total of 552,258 patients, it was found that there was a significant link between kidney dysfunction and cardiovascular risk.Citation4 Because of the deleterious effect of diabetes on endothelial cells,Citation5,6 diabetic nephropathy confers an additional and additive risk for CVD in CKD patients.Citation7,8 Epicardial adipose tissue (EAT) is the true visceral fat depot of the heart that accounts for approximately 20% of total heart weight and covers 80% of the cardiac surfaces, mostly in the grooved segments along the paths of coronary arteries.Citation9–11
Recent studies showed a close relationship between coronary artery disease (CAD) and EAT by using multidetector computed tomography (MDCT) and echocardiography in healthy subjects and patients with high risk of CAD.Citation12–15 The coronary artery calcification score (CACS) in patients with ESRD reflects the severity of the atherosclerotic vascular disease and predicts the cardiovascular events.Citation16,17 In recent studies, the authors concluded that EAT acts as an extremely active organ that produces several bioactive adipokines as well as proinflammatory and proatherogenic cytokines such as tumor necrosis factor (TNF)-α, monocyte chemotactic protein, interleukin (IL)-6, and resistin.Citation13,18–21 Levels of most of these cytokines are also increased in ESRD patients.Citation22–24 It is therefore reasonable to postulate that EAT is a source of inflammatory signals in patients with ESRD. Studies focusing on the association between CACS and EAT in ESRD patients are lacking. In the present study, we investigated the relationship between EAT and CACS in diabetic and nondiabetic ESRD patients.
MATERIAL AND METHODS
Patients
This was a cross-sectional study involving 60 ESRD patients (25 females, 35 males; mean age, 54 ± 12 years) receiving either peritoneal dialysis (PD) or hemodialysis (HD) for ≥6 months in the Dialysis Unit of Selcuk University and 20 healthy control subjects (9 females, 11 males; mean age, 51 ± 11 years) between February and June 2009.
Patients aged 18–70 years willing to participate in the assessment of CAC and EAT by MDCT were screened. A review of medical records (including information on age; sex; weight; duration of renal replacement treatment; medications; etiology of ESRD) was undertaken. Exclusion criteria included (a) congestive heart failure, (b) active infection, (c) autoimmune disease, and (d) secondary hyperparathyroidism. Of a total of 75 patients, 4 patients had congestive heart failure (New York Heart Association (NYHA) class III–IV), 3 patients had active infection, 5 patients had secondary hyperparathyroidism, and 3 patients had autoimmune disease including systemic lupus erythematosus and microscopic polyangiitis and were excluded. None of the patients included in the study had arrhythmia based on ECG. The remaining 60 ESRD patients fulfilled the above criteria and were enrolled in the study. Twenty age-matched and sex-matched healthy individuals referred from outpatient clinics of the Internal Medicine Department of Selcuk University were also enrolled as control subjects. They were subject to the same inclusion and exclusion criteria as the patients. HD patients were receiving thrice-weekly dialysis for a 4 h period with a standard bicarbonate-containing dialysate bath using a biocompatible HD membrane (Polysulfone, FX-80 series, Fresenius, Germany). Dialysate flow rates were 500 mL/min and blood flow rates were 250–300 mL/min. The systolic blood pressure (SBP) and diastolic blood pressure (DBP) of patients and healthy subjects were measured in the upright sitting position after ≥5 min of rest using an Erka sphygmomanometer (PMS Instruments Limited, Berkshire, UK) with an appropriate cuff size. Two readings were recorded for each individual. The mean value of two readings was defined as the blood pressure. Patients with SBP and DBP > 140 and 90 mmHg, respectively, or who were already on antihypertensive treatment were assumed to be hypertensive.
Thirteen patients were on treatment with antihypertensive drugs (seven of them on angiotensin-converting enzyme (ACE) inhibitors, five of them receiving angiotensin receptor blocker, and one of them receiving both calcium channel blocker and ACE inhibitor). Twenty-four patients were taking calcium-containing phosphate binders. Nineteen patients were using active vitamin D.
The study protocol was approved by the Medical Ethics Committee of Selcuk University (Meram School of Medicine, Konya, Turkey). Written informed consent was obtained from all subjects included in the study.
Biochemical Analyses
Venous blood samples for biochemical analyses were drawn after an overnight fast before first exchange in PD patients and before the midweek session in patients receiving HD. All biochemical analyses including those for glucose, creatinine, total cholesterol, low-density lipoprotein (LDL) cholesterol, high-density lipoprotein (HDL) cholesterol, and plasma triglyceride (TG) concentrations were undertaken using an oxidase-based technique by the Roche/Hitachi Modular System (Mannheim, Germany) in the Central Biochemistry Laboratory of the Meram School of Medicine.
Coronary Artery Calcium Scoring and Epicardial Adipose Tissue Measurement
Unenhanced coronary CT was quantified on retrospectively ECG-gated cardiac CT using 64-slice MDCT (Sensation 64; Siemens Medical Solutions, Erlangen, Germany). The coronary CT protocol was slice collimation, 64 × 0.6 mm; gantry rotation time, 0.33 s; pitch, 0.2; tube voltage, 120 kV; and tube current, 600 mA. If the heart rate (HR) was >65 beats per minute, HR control was achieved with a beta blocker. Multiplanar data reconstructions were obtained in standardized ventricular short-axis planes at the basal, mid-cavity, apical as well as the horizontal long-axis plane with 3 mm slice thickness and 2 mm slice interval.Citation25 To quantify CAC, all reconstructions were transferred to a personal computer (PC)-based workstation (Syngo CaScoring Wizard; Siemens Medical Solutions). CACS was defined as >2 contiguous pixels with Hounsfield units (HU) >130 as designed by Agatston et al.Citation26 All values of the left anterior descending coronary artery, circumflex coronary artery, and right coronary artery were added to calculate the CACS. To quantify EAT volume, all reconstructions were transferred to the PC-based workstation. A CT attenuation threshold between –200 and –20 HU was used to isolate epicardial fat. Measurements of EAT and CACS were evaluated by two radiologists blinded to the study protocol. The interobserver variability was <10%.
Statistical Analyses
The statistical analyses were carried out using Statistical Package for Social Sciences for Windows version 15.0 (SPSS, Inc., Chicago, IL, USA). Data are expressed as the mean ± SD, with a significance level of p < 0.05. Non-normally distributed variables were expressed as median (interquartile range). Statistical comparisons of individual groups were based on one-way ANOVA test for continuous variables whereas the correlations between groups were evaluated by post hoc adjusted Tukey–Kramer test. Kruskal–Wallis test was applied for nonparametric distributed variables whereas the correlations between groups were evaluated by Mann–Whitney U-test and Bonferroni correction was applied.
RESULTS
Patients’ Baseline Characteristics
The baseline characteristics and biochemical values of 20 healthy subjects, 17 diabetic, and 43 nondiabetic ESRD patients were shown in . The etiology of the ESRD patients were diabetic nephropathy (n = 17), hypertensive nephropathy (n = 13), chronic glomerulonephritis (n = 10), polycystic kidney disease (n = 6), nephrolithiasis (n = 4), and unknown etiology (n = 10). There were no differences in age, gender, body mass index (BMI), predialysis SBP and DBP levels, biochemical parameters including serum LDL and HDL cholesterol, TGs, and C-reactive protein between healthy subjects, diabetic, and nondiabetic ESRD patients.
Table 1. The demographic and laboratory features of the healthy subjects, diabetic, and nondiabetic ESRD patients.
Epicardial Adipose Tissue and Coronary Artery Calcification Measurements
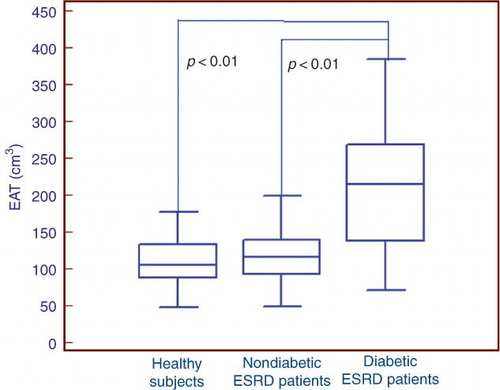
Total CACSs were significantly higher in diabetic ESRD patients when compared with nondiabetic ESRD patients and healthy subjects (, ). EAT measurements were also found to be higher in diabetic ESRD patients when compared with nondiabetic ESRD patients and healthy subjects (). There was a statistically significant correlation between EAT and CACS in ESRD patients (p < 0.0001, r = 0.48). There was also a statistically significant correlation between EAT and CACS in both diabetic and nondiabetic ESRD patients (p = 0.01, r = 0.60; p = 0.02, r = 0.38, respectively). CACS and EAT measurements were found to be higher in nondiabetic ESRD patients when compared with healthy subjects. However, these results were not statistically significant.
Figure 1. Total coronary artery calcification score (CACS) in healthy subjects and diabetic and nondiabetic end-stage renal disease (ESRD) patients.
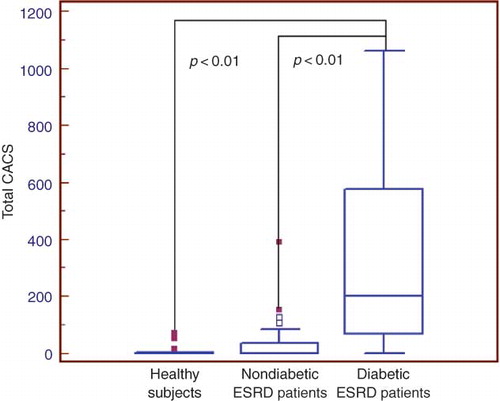
Figure 2. Epicardial adipose tissue (EAT) measurements in healthy subjects and diabetic and nondiabetic end-stage renal disease (ESRD) patients.
In the present study, patients were separated into two groups according to Ca × P product (group 1: Ca × P ≥ 55; group 2: Ca × P < 55). EAT measurements were 157 ± 71.4 cm3 in group 1 and 151 ± 71 cm3 in group 2. There was no statistically significant difference between groups 1 and 2 in terms of EAT (p = 0.71). CACS were 155 ± 274 in group 1 and 104 ± 214 in group 2. There was also no statistically significant difference between groups 1 and 2 in terms of CACS (p = 0.10).
DISCUSSION
In the present study, total CACS and EAT measured by MDCT were found to be increased both in diabetic ESRD patients when compared with healthy subjects and nondiabetic ESRD patients. To our knowledge, this is the first study to evaluate the EAT and CACS in diabetic and nondiabetic ESRD patients.
Several factors contribute to the high mortality rate in ESRD patients, but CVD remains the main cause of morbidity and mortality despite recent developments in renal replacement therapies.Citation2,3 This can be attributed to many factors including advanced age, atherosclerosis, ED, hypertension, anemia, hyperparathyroidism, chronic inflammation, diabetes and its macro-microvascular complications, LVH, malnutrition, and vascular calcification (VC). CAC is a part of extended state of VC which can be detected even in early years of patients with ESRD.Citation27 CACS is regarded as an index of the severity of atherosclerotic vascular disease, helps to anatomically assess the CAD, and may also predict future adverse CV events, especially in patients on dialysis.Citation28 Individuals with diabetic nephropathy have a significantly higher prevalence and severity of CACS when compared with diabetics with normoalbuminuria.Citation29 Mehrotra et al.Citation30 evaluated the progression of CACS in diabetic CKD patients and reported that CACS were more likely to be progressive among individuals with diabetic nephropathy when compared with normoalbuminuric diabetic controls. In the present study, total CACS were increased in both diabetic and nondiabetic ESRD patients when compared with healthy subjects and CAC measurements were found to be significantly higher in diabetic ESRD patients when compared with nondiabetic ESRD patients.
EAT and intra-abdominal visceral fat depots originate from the splanchnopleuric mesoderm.Citation31 Mazurek et al.Citation13 concluded that like abdominal visceral adipose tissue, EAT is also metabolically active by secreting proinflammatory cytokines and utilizing the free fatty acids (FFAs). Under ischemic conditions, EAT provides FFAs for the increased metabolism of myocardium.Citation32 However, in normal conditions EAT acts as a buffering system by scavenging excess FFA that is toxic to myocardium.Citation33 In ESRD patients, proinflammatory cytokines such as TNF-α, IL-1-β, and IL-6 were generally increased and these cytokines were found to be associated with both atherosclerosis and increased CACS.Citation22–24
In our study, EAT measurements were increased in both diabetic and nondiabetic ESRD patients when compared with healthy subjects and also EAT volume was significantly higher in diabetic ESRD patients when compared with nondiabetic ESRD patients. Increased EAT measured by MDCT was also correlated with CACS in ESRD patients. These findings were consistent with the previous studies. Wang et al.Citation34 demonstrated that EAT volume was significantly higher in patients with type 2 DM than in nondiabetic subjects. The close anatomical relationship between EAT and the coronary arteries, combined with other evidence indicating that EAT is a biologically active adipokine-secreting tissue, suggests that EAT participates in the pathogenesis of diabetic coronary atherosclerosis.Citation19,34
Ix and SharmaCitation35 concluded that there is a link between obesity, CKD, and non-alcoholic fatty liver disease (NAFLD). Targher et al.Citation36 showed an association between NAFLD and CKD in patients with type-2 DM. However, in the present study, there was no difference between ESRD patients and healthy subjects in terms of BMI and serum levels of aspartate aminotransferase and alanine transaminase. We therefore assumed that our patients did not have NAFLD.
Despite the simplicity of evaluating EAT with echocardiography,Citation37 EAT should be measured in three dimensions by MDCT: regional thickness, cross-sectional area, and total volume.Citation33,38 Therefore, MDCT can be used to assess both CAC and EAT in ESRD patients at a high risk of CVD. Echocardiography has been used for the measurement of EAT with a higher reproducibility and reliability in the general population, but there are no data about echocardiography for the assessment of EAT in ESRD patients.Citation37 The lower cost, simplicity, and rapidity of echocardiography could make it the preferred measurement method for EAT.
Our study had some limitations: first, this was a cross-sectional analysis of CACS and EAT in ESRD patients. Second, the sample size was relatively small. Both CACS and EAT measurements were found to be higher in ESRD patients when compared with healthy subjects; however, this difference was not statistically significant. This can be attributed to the small size of study population. Another potential limitation was that CT could not determine whether calcium was in the intima or media of the arterial wall. Since this is not a prospective controlled study, we cannot draw cause and effect relations from our findings.
In conclusion, we found a significant increase in terms of EAT and CACS in diabetic ESRD patients when compared with nondiabetic ESRD patients and healthy subjects. There are many missing pieces in the puzzle. Further clinical and experimental studies are needed to determine the relationship between EAT and CACS in ESRD patients.
Declaration of interest: The authors report no conflicts of interest. The authors alone are responsible for the content and writing of the paper.
Related Research Data
REFERENCES
- Parfrey PS, Foley RN, Harnett JD, Kent GM, Murray D, Barre PE. Outcome and risk factors of ischemic heart disease in chronic uremia. Kidney Int. 1996;49(5):1428–1434.
- Collins AJ. Cardiovascular mortality in end-stage renal disease. Am J Med Sci. 2003;325(4):163–167.
- Foley RN, Parfrey PS, Sarnak MJ. Clinical epidemiology of cardiovascular disease in chronic renal disease. Am J Kidney Dis. 1998;32(5 Suppl. 3):S112–S119.
- Vanholder R, Massy Z, Argiles A, Spasovski G, Verbeke F, Lameire N. Chronic kidney disease as cause of cardiovascular morbidity and mortality. Nephrol Dial Transplant. 2005;20(6):1048–1056.
- Koenig W, Khuseyinova N, Baumert J, Meisinger C, Lowel H. Serum concentrations of adiponectin and risk of type 2 diabetes mellitus and coronary heart disease in apparently healthy middle-aged men: Results from the 18-year follow-up of a large cohort from southern Germany. J Am Coll Cardiol. 2006;48(7):1369–1377.
- Takebayashi K, Suetsugu M, Wakabayashi S, Aso Y, Inukai T. Association between plasma visfatin and vascular endothelial function in patients with type 2 diabetes mellitus. Metabolism. 2007;56(4):451–458.
- Go AS, Chertow GM, Fan D, McCulloch CE, Hsu CY. Chronic kidney disease and the risks of death, cardiovascular events, and hospitalization. N Engl J Med. 2004;351(13):1296–1305.
- Anavekar NS, Gans DJ, Berl T, . Predictors of cardiovascular events in patients with type 2 diabetic nephropathy and hypertension: A case for albuminuria. Kidney Int Suppl. 2004;92:S50–S55.
- Iacobellis G, Corradi D, Sharma AM. Epicardial adipose tissue: Anatomic, biomolecular and clinical relationships with the heart. Nat Clin Pract Cardiovasc Med. 2005;2(10):536–543.
- Corradi D, Maestri R, Callegari S, . The ventricular epicardial fat is related to the myocardial mass in normal, ischemic and hypertrophic hearts. Cardiovasc Pathol. 2004;13(6):313–316.
- Shirani J, Berezowski K, Roberts WC. Quantitative measurement of normal and excessive (cor adiposum) subepicardial adipose tissue, its clinical significance, and its effect on electrocardiographic QRS voltage. Am J Cardiol. 1995;76(5):414–418.
- Djaberi R, Schuijf JD, van Werkhoven JM, Nucifora G, Jukema JW, Bax JJ. Relation of epicardial adipose tissue to coronary atherosclerosis. Am J Cardiol. 2008;102(12):1602–1607.
- Mazurek T, Zhang L, Zalewski A, . Human epicardial adipose tissue is a source of inflammatory mediators. Circulation. 2003;108(20):2460–2466.
- Park MJ, Jung JI, Oh YS, Youn HJ. Assessment of epicardial fat volume with threshold-based 3-dimensional segmentation in CT: Comparison with the 2-dimensional short axis-based method. Korean Circ J. 2010;40(7):328–333.
- Eroglu S, Sade LE, Yildirir A, . Epicardial adipose tissue thickness by echocardiography is a marker for the presence and severity of coronary artery disease. Nutr Metab Cardiovasc Dis. 2009;19(3):211–217.
- Haydar AA, Hujairi NM, Covic AA, Pereira D, Rubens M, Goldsmith DJ. Coronary artery calcification is related to coronary atherosclerosis in chronic renal disease patients: A study comparing EBCT-generated coronary artery calcium scores and coronary angiography. Nephrol Dial Transplant. 2004;19(9):2307–2312.
- Raggi P, Boulay A, Chasan-Taber S, . Cardiac calcification in adult hemodialysis patients. A link between end-stage renal disease and cardiovascular disease? J Am Coll Cardiol. 2002;39(4):695–701.
- Baker AR, Silva NF, Quinn DW, . Human epicardial adipose tissue expresses a pathogenic profile of adipocytokines in patients with cardiovascular disease. Cardiovasc Diabetol. 2006;5:1.
- Kremen J, Dolinkova M, Krajickova J, . Increased subcutaneous and epicardial adipose tissue production of proinflammatory cytokines in cardiac surgery patients: Possible role in postoperative insulin resistance. J Clin Endocrinol Metab. 2006;91(11):4620–4627.
- Cheng KH, Chu CS, Lee KT, . Adipocytokines and proinflammatory mediators from abdominal and epicardial adipose tissue in patients with coronary artery disease. Int J Obes (Lond). 2008;32(2):268–274.
- Fain JN, Sacks HS, Buehrer B, . Identification of omentin mRNA in human epicardial adipose tissue: Comparison to omentin in subcutaneous, internal mammary artery periadventitial and visceral abdominal depots. Int J Obes (Lond). 2008;32(5):810–815.
- Yildiz A, Tepe S, Oflaz H, . Carotid atherosclerosis is a predictor of coronary calcification in chronic hemodialysis patients. Nephrol Dial Transplant. 2004;19(4):885–891.
- Stenvinkel P, Heimburger O, Paultre F, . Strong association between malnutrition, inflammation, and atherosclerosis in chronic renal failure. Kidney Int. 1999;55(5):1899–1911.
- Tintut Y, Patel J, Parhami F, Demer LL. Tumor necrosis factor-alpha promotes in vitro calcification of vascular cells via the cAMP pathway. Circulation. 2000;102(21):2636–2642.
- Abbara S, Desai JC, Cury RC, Butler J, Nieman K, Reddy V. Mapping epicardial fat with multi-detector computed tomography to facilitate percutaneous transepicardial arrhythmia ablation. Eur J Radiol. 2006;57(3):417–422.
- Agatston AS, Janowitz WR, Hildner FJ, Zusmer NR, Viamonte Jr. M, Detrano R. Quantification of coronary artery calcium using ultrafast computed tomography. J Am Coll Cardiol. 1990;15(4):827–832.
- London GM, Guerin AP, Marchais SJ, Metivier F, Pannier B, Adda H. Arterial media calcification in end-stage renal disease: Impact on all-cause and cardiovascular mortality. Nephrol Dial Transplant. 2003;18(9):1731–1740.
- Schwarz U, Buzello M, Ritz E, . Morphology of coronary atherosclerotic lesions in patients with end-stage renal failure. Nephrol Dial Transplant. 2000;15(2):218–223.
- Mehrotra R, Budoff M, Christenson P, . Determinants of coronary artery calcification in diabetics with and without nephropathy. Kidney Int. 2004;66(5):2022–2031.
- Mehrotra R, Budoff M, Hokanson JE, Ipp E, Takasu J, Adler S. Progression of coronary artery calcification in diabetics with and without chronic kidney disease. Kidney Int. 2005;68(3):1258–1266.
- Ho E, Shimada Y. Formation of the epicardium studied with the scanning electron microscope. Dev Biol. 1978;66(2):579–585.
- Marchington JM, Pond CM. Site-specific properties of pericardial and epicardial adipose tissue: The effects of insulin and high-fat feeding on lipogenesis and the incorporation of fatty acids in vitro. Int J Obes. 1990;14(12):1013–1022.
- Wang TD, Lee WJ, Shih FY, . Association of epicardial adipose tissue with coronary atherosclerosis is region-specific and independent of conventional risk factors and intra-abdominal adiposity. Atherosclerosis. 2010;213(1):279–287.
- Wang CP, Hsu HL, Hung WC, . Increased epicardial adipose tissue (EAT) volume in type 2 diabetes mellitus and association with metabolic syndrome and severity of coronary atherosclerosis. Clin Endocrinol (Oxf). 2009;70(6):876–882.
- Ix JH, Sharma K. Mechanisms linking obesity, chronic kidney disease, and fatty liver disease: The roles of fetuin-A, adiponectin, and AMPK. J Am Soc Nephrol. 2010;21(3):406–412.
- Targher G, Chonchol M, Bertolini L, . Increased risk of CKD among type 2 diabetics with nonalcoholic fatty liver disease. J Am Soc Nephrol. 2008;19(8):1564–1570.
- Iacobellis G, Willens HJ. Echocardiographic epicardial fat: A review of research and clinical applications. J Am Soc Echocardiogr. 2009;22(12):1311–1319, quiz 1417–1418.
- Wang TDLW, Chen MF. Epicardial adipose tissue measured by multidetector computed tomography: Practical tips and clinical implications. Acta Cardiol. 2010;26:55–68.