Abstract
Background: Acute kidney injury (AKI) has a profound impact on the morbidity and mortality of patients. Tubular obstruction is an important mechanism of AKI development because many molecules will cause tubular obstruction, leading to AKI; however, few AKI animal models by tubular obstruction have been established. The aim of this study was to establish AKI model mice due to tubular obstruction. Method: C57BL/6 male mice, aged 10 weeks, 20–30 g body weight, were ingested 0.75% adenine compound food. The mice were sacrificed from day 1 to 5 for blood, urine, and histological analysis. Results: All mice (50/50 mice) developed AKI and had died by day 6 of uremia after ingesting 0.75% adenine. Histological examination of the kidneys of AKI mice showed that dilatation of the tubular lumen in the medullary papilla resulted from the occupation by adenine casts followed by atrophy, scattering, and flattening of the epithelial cells of tubules. The urine neutrophil gelatinase-associated lipocalin (NGAL) level significantly increased in AKI mice on day 1 after ingesting 0.75% adenine. Conclusion: We established a very simple and reproducible AKI mouse model due to tubular obstruction by ingesting 0.75% adenine.
INTRODUCTION
Acute kidney injury (AKI) is characterized by a rapid decline of renal function and retention of nitrogenous waste products. Depending on the degree of severity, AKI can lead to many complications, such as metabolic acidosis, uremia, volume overload, hyperpotassemia, and effects on other organs.Citation1–3 AKI has a profound impact on the morbidity and mortality of patients because the mortality of patients who develop AKI ranges from 20% to 30%.Citation4–6 In addition, there is no specific therapy for AKI except for supportive care.Citation3 Since the pathogenesis of AKI is complex and only partially understood, several animal models have been established to study it. Previous AKI animal models could be categorized into three types: toxic,Citation7,8 hypoxic,Citation9–12 and septic.Citation7,13 Tubular obstruction is also an important mechanism of AKI development because many molecules, for example, organic compounds such as uric acid and oxalic acid, drugs such as methotrexate, and tumors such as multiple myeloma, cause tubular obstruction leading to AKI; however, few AKI animal models have been established with tubular obstruction.Citation14 In the present study, we established AKI model mice with tubular obstruction by adenine cast using a simple method: ingestion of 0.75% adenine.
MATERIALS AND METHODS
Mice
C57BL/6 male mice, aged 10 weeks, 20–30 g body weight, were purchased from CLEA Japan, Inc. (Tokyo, Japan). All mice were housed under antiviral- and antibody-free microisolator conditions.
AKI by Obstruction of Tubules in a Mouse Model
The 0.75% adenine rodent diet was prepared by CLEA (Tokyo, Japan). Briefly, adenine powder (Wako, Tokyo, Japan) was mixed with the powder of the CLEA rodent diet CE-2 (CLEA) at a rate of 0.75% (w/w), and then small solid blocks of diet were made that contained 0.75% adenine homogenously. To establish an AKI mouse model by tubular obstruction, 0.75% adenine-added CLEA rodent diet CE-2 was orally ingested by C57BL/6 male mice, aged 10 weeks, with free intake of water. These mice were kept on the 0.75% adenine diet from day 0 until death to investigate the body weight change and survival rate (n = 50). In some experience, mice were sacrificed at different time points (days 0–5) after 0.75% adenine ingestion to analyze the rates of kidney weight, blood, and urine and histological changes of the kidney (six mice at each time point). The same type of aged C57BL/6 male mice that ingested CLEA rodent diet CE-2 (CLEA) without 0.75% adenine served as controls.
Laboratory Methods
Blood analysis was performed by a clinical chemistry laboratory (SRL, Tokyo, Japan).
Histology
After perfusion with phosphate-buffered saline (PBS), the kidneys were removed and fixed in 4% paraformaldehyde overnight at 4°C. They were then embedded in paraffin, sectioned, and stained with hematoxylin and eosin (HE) and periodic acid-methenamine.
Morphometric Study
To evaluate dilated tubules, photographs with a final magnification of ×100 were used. Longitudinal kidney sections stained with HE were divided into 10 equally wide zones from the renal surface to the medullary papilla. The number of dilated tubules located in each zone was counted separately and expressed as a ratio of the total number.
Neutrophil Gelatinase-Associated Lipocalin (NGAL) ELISA
A mouse NGAL ELISA kit specific for mouse NGAL (Bioporto Diagnostics, Gentofte, Denmark) was used according to the manufacturer’s protocol. Briefly, 100 μL samples were added to a rat monoclonal antibody against mouse NGAL precoated plate and incubated for 1 h at room temperature with shaking. After washing, 100 μL biotinylated monoclonal antibody against mouse NGAL was added and incubated for 1 h at room temperature with shaking. After washing, horseradish peroxidase (HRP)-conjugated streptavidin was added and incubated for 1 h at room temperature with shaking. After washing, the color was developed with 100 μL peroxidase substrate containing tetramethylbenzidine.
Statistical Analysis
Data are given as the means ± standard error (SE). Statistical significance was determined by Mann–Whitney’s U-test. p < 0.05 was considered significant. The survival rate was estimated using Kaplan–Meier methods.
RESULTS
0.75% Adenine-Ingesting Mice Developed AKI
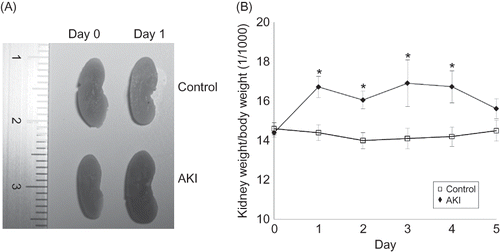
The mice developed AKI after 0.75% adenine ingestion. The plasma creatinine (Cr) and blood urea nitrogen (BUN) significantly increased in the mice on day 1 (Cr/BUN 1.1 ± 0.47/142.2 ± 16.0 mg/dL, n = 6) to day 5 (Cr/BUN 1.6 ± 0.35/277.1 ± 44.8 mg/dL, n = 6) after 0.75% adenine ingestion compared with the control (day 1: Cr/BUN 0.1 ± 0.02/24.2 ± 8.4 mg/dL, day 5: Cr/BUN 0.1 ± 0.04/25.1.1 ± 6.3 mg/dL, n = 6 at each time point) (A and B). Hematocrit also significantly increased in the mice at day 1 (55.3 ± 4.7%, n = 6) and day 2 (57.6 ± 5.9%, n = 6) after 0.75% adenine ingestion compared with the control (day 1: 47.8 ± 4.1%, day 2: 48.2 ± 4.7%, n = 6 at each time point) (C). The body weight of mice decreased and 42% (21/50) had died by day 5 and 100% (50/50) by day 6 after 0.75% adenine ingestion (n = 50) (A and B). The ratio of kidney weight to body weight of the mice significantly increased from day 1 to day 4 after 0.75% adenine ingestion compared with the control (n = 6 at each time point) (A and B).
Figure 1. (A) Survival rate of AKI mice. The mice began to die on day 3 and 100% mice (50/50) had died by day 6 after 0.75% adenine ingestion (n = 50). (B) Change of body weight in AKI mice. The body weight of AKI mice decreased after 0.75% adenine ingestion (n = 10 at each time point). Notes: Values are expressed as the mean ± SE. *p < 0.05.
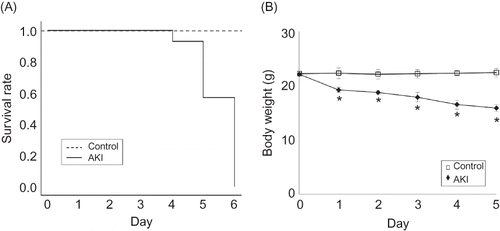
Figure 2. Changes of plasma creatinine (A), blood urea nitrogen (BUN) (B) and hematocrit (C) in AKI mice and control mice. The plasma creatinine and BUN significantly increased in AKI mice on day 1 after ingesting 0.75% adenine (n = 6 at each time point). Hematocrit also significantly increased in the mice on day 1 and day 2 after 0.75% adenine ingestion (n = 6 at each time point). Notes: Values are expressed as the mean ± SE. *p < 0.05.
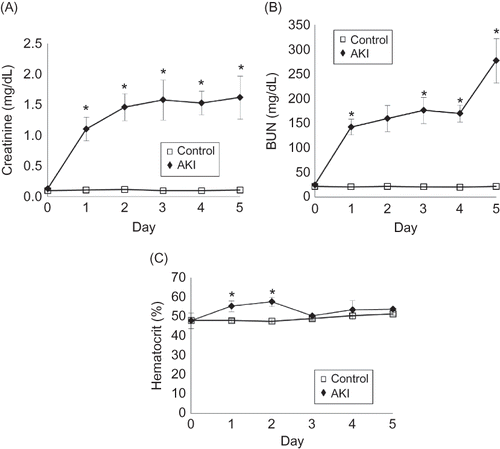
Figure 3. (A) Macroscopic findings of the AKI mouse kidney. Photograph showing the swollen kidneys of AKI mice on day 1 after 0.75% adenine ingestion. (B) Change of the ratio of kidney weight to body weight in AKI mice. The ratio of kidney weight to body weight in AKI mice increased after 0.75% adenine ingestion (n = 6 at each time point). Notes: Values are expressed as the mean ± SE. *p < 0.05.
Urine Analysis in 0.75% Adenine-Ingesting Mice
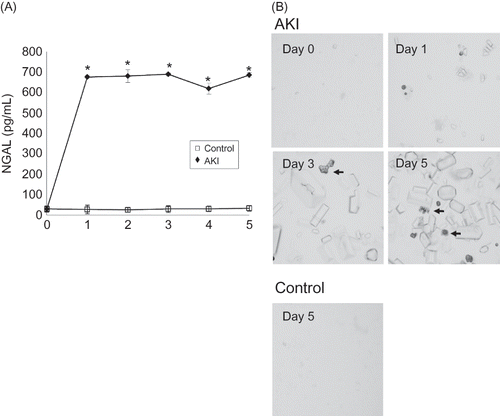
Urine NGAL increased in the mice from day 1 (675.8 ± 8.54 pg/mL, n = 6) to day 5 (685.2 ± 11.9 pg/mL, n = 6) after 0.75% adenine ingestion compared with the control (day 1: 30.2 ± 12.1 pg/mL, day 5: 31.5 ± 11.3 pg/mL, n = 6 each time point) (A). The urine sediment showed many adenine crystals with some granular casts (arrows; B) in mice after 0.75% adenine ingestion (B).
Figure 4. Change of urine neutrophil gelatinase-associated lipocalin (NGAL) in AKI mice (A). Urine NGAL increased in the mice from day 1 to day 5 after 0.75% adenine ingestion (n = 6 at each time point). Urine sediment analysis of AKI mice (B). Many adenine crystals with some granular casts (arrows) were detected in mice after 0.75% adenine ingestion. Note: *p < 0.05.
Histological and Morphometric Analysis of 0.75% Adenine-Ingesting Mice
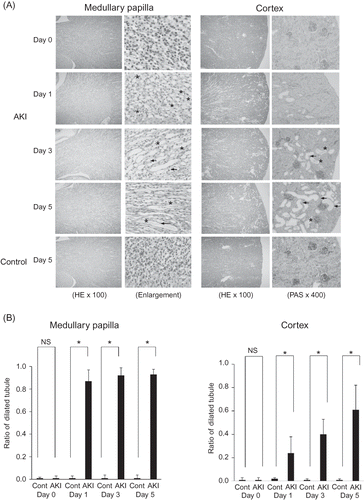
The most relevant changes in the kidneys of 0.75% adenine-ingesting mice were in the tubules in the medullary papilla. Almost all tubular lumen of the medullary papilla were dilated on day 1 after 0.75% adenine ingestion and dilatation continued to day 5 (A and B). Some tubular lumina of the cortex (<10%) were also dilated on day 1 and the rate of dilated tubular lumina increased on day 3 (>30%) and day 5 (>60%) (A and B). Histological analysis showed casts occupying medullary papilla and cortex tubular lumina (*; A). Atrophy, scattering, and flattening of the epithelial cells of those tubules were detected on day 3 and day 5 (arrow; A).
Figure 5. Histological examination of the kidney of 0.75% adenine-ingesting mice by light microscopy with hematoxylin and eosin (HE) staining and periodic acid-methenamine staining (PAS) (A). Almost all tubular lumina of the medullary papilla were dilated on day 1 after 0.75% adenine ingestion and dilatation continued to day 5. The adenine casts occupied some of the medullary papilla and cortex tubular lumina (*). Atrophy, scattering, and flattening of the epithelial cells of these tubules were detected on day 3 and day 5 (arrow). Semiquantitative analysis of morphologic changes of AKI mouse kidney (B). Almost all tubular lumina of the medullary papilla dilated on day 1 after 0.75% adenine ingestion and dilatation continued until day 5. Some of the tubular lumina of the cortex (<10%) were also dilated on day 1 and the rate of dilated tubular lumina increased on day 3 (>30%) and day 5 (>60%) (n = 6 at each time point). Notes: Values are expressed as the mean ± SE. *p < 0.05.
DISCUSSION
In this study, we established a new AKI mouse model of tubular obstruction by adenine cast. This mouse model developed AKI simply by 0.75% adenine ingestion without any special manipulation, such as surgery or injection of substances into the vein, muscle, or peritoneum. The plasma creatinine and BUN of the mice significantly increased and 42% (21/50) mice had died by day 5 and 100% (50/50) mice by day 6 after 0.75% adenine ingestion. Histological analysis of the kidneys showed that almost all tubular lumina in the medullar papilla were dilated on day 1 after 0.75% adenine ingestion and continued to dilate at day 5. Some tubular lumina of the cortex (<10%) also dilated on day 1 and the rate of dilated tubular lumina increased at day 3 (>30%) and day 5 (>60%). Histological analysis also showed adenine casts in some lumina in both the medullar papilla and cortex. These results suggested that the tubular lumen in the medullary papilla was dilated initially as a result of obstruction by the occupation by adenine casts. The dilatation of the lumen then progressed to cortex tubules. In addition to this mechanism, atrophy, scattering, and flattening of the epithelial cells of tubules on days 3 and 5 suggested the involvement of tubular injury in this AKI mouse model. The increment of a tubular injury marker, urine NGAL, in AKI mice by 0.75% adenine ingestion also suggested tubular injury. Adenine crystals may be directly toxic to renal tubules during the process of accumulation and excretion into urine because adenine crystals were detected with some granular casts in urinary sediment in mice after 0.75% adenine ingestion. Although the ratio of kidney weight to body weight in the AKI mouse model significantly increased compared to control mice, decreased body weight and kidney weight was found and the hematocrit level increased in AKI mice after 0.75% adenine ingestion. These results suggested dehydration by volume depression in AKI mice. Although the most relevant histological change in AKI mice was tubular obstruction, volume depression by 0.75% adenine ingestion may contribute to AKI development by reducing renal blood flow. The direct effects of adenine or intake loss of food or water due to AKI may contribute to dehydration. Further studies will be needed to elucidate the factors involved in the development of AKI in the 0.75% adenine-induced AKI mouse model. A limitation of this study was that the circulating blood volume, food and water intake in each mouse, and intraluminal or renal parenchymal pressure were not measured.
Yokozawa et al.Citation15 reported that diets high in adenine increased serum creatinine and BUN by decreasing the urinary excretion of creatinine and urea. They also reported that 0.75% adenine ingestion for 30 days induced chronic renal failure (CRF) in rats.Citation15 Their rat model developed renal insufficiency on day 40 after 0.75% adenine ingestion and showed slow progressive renal failure.Citation15 The histology of the CRF rats showed many needle crystals of adenine in the tubular lumina and interstitium. In addition to these deposits, formation of foreign body granuloma, scattered dilatation and obstruction of proximal and distal tubular lumina, subsequent degeneration and necrosis of tubular epithelia were found.Citation15 The rat renal injury model by adenine was established as above; however, mice may provide a more useful experimental model for studies examining renal injury because of the availability of histopathological and cytological antibodies or therapeutic agents. In addition, we hypothesized that adenine cast may rapidly obstruct the tubular lumen and showed a different phenotype in mice because the tubular lumina of mice are much smaller than those of rats. As expected, although the adenine-ingesting rat model was reported to show CRF, this mouse model showed AKI. The most relevant histological change in this AKI mouse model was the rapid dilation of tubules on the medullary papilla by adenine crystal occupation. Scattered dilatation and obstruction of proximal and distal tubular lumina were detected in this AKI mouse model as in the CRF rat model. The needle crystals and foreign body granuloma shown in the CRF rat model and inflammation of immune cells were not detected in this AKI mouse model. The difference in tubular lumen size between mice and rats may explain this phenotype difference; however, further study will be needed to clarify this phenotype difference between rats and mice.
To study the pathogenesis of AKI, many AKI animal models have been established, for example, a hypoxia model by a renal or whole body ischemia model,Citation9–12 a toxic model by injection of gentamycin via a veinCitation8 or cisplatin intraperitoneally,Citation7 and a sepsis model by injection of lipopolysaccharide via a vein or cis-diamminedichloroplatinum via the peritoneum.Citation7,13 Although tubular obstruction is also an important mechanism in the pathogenesis of AKI, few animal models have been established as an AKI model by the obstruction of tubules.Citation14 Smolens et al.Citation14 reported that human multiple myeloma-transplanted rats developed AKI due to the obstruction of the tubular lumen by the cast of Bence Jones protein. In the present study, we established AKI model mice with tubular obstruction by adenine cast by simply ingesting 0.75% adenine. These AKI model mice were produced simply and reproducibly because no special manipulation was required and almost all mice developed AKI. These data confirm that our AKI model could be a good model for studies to better understand the pathophysiology of AKI.
ACKNOWLEDGMENT
This work was in part supported by a grant from the High-Tech Research Center Project, the Ministry of Education, Culture, Sports, Science and Technology (MEXT), Japan (S0801043).
Declaration of interest: The authors report no conflicts of interest. The authors alone are responsible for the content and writing of the paper.
Related Research Data
REFERENCES
- Bihari D, Mitchell I, Chang R. Acute renal failure. Lancet. 1996;347(8999):478–479; author reply 479.
- Friedman EA. Acute renal failure. N Engl J Med. 1996;335(17):1321; author reply 1321–1322.
- Thadhani R, Pascual M, Bonventre JV. Acute renal failure. N Engl J Med. 1996;334(22):1448–1460.
- Hsu CY, McCulloch CE, Fan D, Ordonez JD, Chertow GM, Go AS. Community-based incidence of acute renal failure. Kidney Int. 2007;72(2):208–212.
- Waikar SS, Curhan GC, Wald R, McCarthy EP, Chertow GM. Declining mortality in patients with acute renal failure, 1988 to 2002. J Am Soc Nephrol. 2006;17(4):1143–1150.
- Xue JL, Daniels F, Star RA, . Incidence and mortality of acute renal failure in Medicare beneficiaries, 1992 to 2001. J Am Soc Nephrol. 2006;17(4):1135–1142.
- Jones TW, Chorpa S, Kaufman JS, Flamenbaum W, Trump BF. Cis-diamminedichloroplatinum (II)-induced acute renal failure in the rat: Enzyme histochemical studies. Toxicol Pathol. 1985;13(4):296–305.
- Kosek JC, Mazze RI, Cousins MJ. Nephrotoxicity of gentamicin. Lab Invest. 1974;30(1):48–57.
- Glaumann B, Trump BF. Studies on the pathogenesis of ischemic cell injury. III. Morphological changes of the proximal pars recta tubules (P3) of the rat kidney made ischemic in vivo. Virchows Arch B Cell Pathol. 1975;19(4):303–323.
- Finn WF, Chevalier RL. Recovery from postischemic acute renal failure in the rat. Kidney Int. 1979;16(2):113–123.
- Harvig B, Kallskog O, Norlen BJ. Effects of cold ischemia on the preserved rat kidney: Intrarenal distribution of perfusate. Cryobiology. 1980;17(5):478–485.
- Burne-Taney MJ, Kofler J, Yokota N, Weisfeldt M, Traystman RJ, Rabb H. Acute renal failure after whole body ischemia is characterized by inflammation and T cell-mediated injury. Am J Physiol Renal Physiol. 2003;285(1):F87–F94.
- McDonald MC, Dhadly P, Cockerill GW, . Reconstituted high-density lipoprotein attenuates organ injury and adhesion molecule expression in a rodent model of endotoxic shock. Shock. 2003;20(6):551–557.
- Smolens P, Venkatachalam M, Stein JH. Myeloma kidney cast nephropathy in a rat model of multiple myeloma. Kidney Int. 1983;24(2):192–204.
- Yokozawa T, Zheng PD, Oura H, Koizumi F. Animal model of adenine-induced chronic renal failure in rats. Nephron. 1986;44(3):230–234.