Abstract
Renal disease is caused by tubular interstitial injury and renal interstitial fibrosis. Previous studies have shown that transplantation of endothelial progenitor cells (EPCs) may provide an appropriate treatment for repair and reversing renal pathology. However, EPCs are typically low in abundance and have poor replication ability. Therefore, the this study investigated the use of EPCs transfected with the telomerase reverse transcriptase (TERT) in rats that had undergone five out of six subtotal nephrectomy. This study determined the effects of EPC transplantation on renal function, renal interstitial fibrosis, and peritubular capillary angiogenesis. Five groups of rats were investigated: sham group, model group (five out of six subtotal nephrectomy), EPCs-N group (transplantation with EPCs), pZ-TERT-EPCs-N group (transplantation with EPCs transfected with TERT), and pZ-EPCs-N group (transplantation with EPCs transfected with empty plasmid). At weeks 4, 8, and 12 after transplantation, renal function, renal interstitial fibrosis, and peritubular microvessel density (MVD) were investigated. EPCs transfected with TERT gene showed decreased in vitro senescence, apoptosis, and proliferative ability was significantly enhanced (p < 0.05). Furthermore, rat transplanted with EPCs transfected with TERT showed significantly reduced renal interstitial fibrosis and increased endogenous creatinine clearance rate and peritubular MVD (p < 0.05). The transplantation of EPCs expressing TERT into five out of six subtotal nephrectomy rats was shown to improve renal function, reduce loss of peritubular microvessel, and inhibit progression of renal interstitial fibrosis. These studies provide the basis for a potential treatment of renal disease using genetically modified EPCs.
INTRODUCTION
Tubular interstitial injury is the main determining factor in the progression of renal disease, and continuous damage of the renal tubule can cause renal interstitial fibrosis. Although the mechanism for tubular interstitial injury is unclear, it is known that inflammation, a variety of injuries, drugs, diabetes, and genetic factors are important causes of renal interstitial fibrosis. However, the role of peritubular vascular injury is often neglected in the occurrence and development of renal interstitial fibrosis.Citation1 In recent years, human and animal experimental studies showed that reduction of the peritubular vessel was correlated with renal interstitial fibrosis. It is believed that microvascular disease was one of the early events in renal disease that leads to renal fibrosis rather than an epiphenomenon of fibrosis.Citation2–4 Further studies found that the decline of proliferation ability of endothelial cells and an increase in apoptosis were the direct causes of the decline of peritubular microvessel density (MVD).Citation2 Thus, if vascular endothelial cells could be replenished in a timely manner, vascular injury is likely to be effectively reduced.
Endothelial progenitor cells (EPCs) are the precursor cells of the endothelial cells, and in the studies of ischemic disease transplantation of EPCs could cause angiogenesis in the injured tissues to improve the ischemic symptoms. Moreover, in studies of patients with chronic renal failure the proliferation of EPCs was positively correlated with renal capillary angiogenesis.Citation5,6 However, the lack of a reliable source of EPCs, due to poor replication ability in vitro and other defects, inhibits large-scale application.
Murasawa et al.Citation7 successfully cultured EPCs for 21 days using human telomerase reverse transcriptase (hTERT) gene transfer, thereby creating a source of EPCs. This study transfected EPCs with the TERT gene and transplanted the cells into the five out of six subtotal nephrectomy rats to observe its effects on renal interstitial microvascular angiogenesis. These studies provide an approach that could be applied for the prevention and treatment of renal interstitial fibrosis.
MATERIALS AND METHODS
Materials
Plasmid pZsGreen1-C1 (KanR); polymerase chain reaction (PCR) product purification kit (Roche, Shanghai, China); Pyrobest high-fidelity DNA polymerase, restriction endonucleases, BglII, EcoRI, T4 DNA ligase, HinDIII digested λ, and DL2000 marker (TaKaRa, Shiga, Japan); Escherichia coli JM109 (provided by State Key Laboratory of Medical Genetics of China); Spin and Tip100 plasmid extraction kit (Qiagen, Valencia, CA, USA); M199 culture medium (Invitrogen, Carlsbad, CA, USA); endothelial cell growth medium (EGM)-2 culture medium (Lonza, Basel, Switzerland); rabbit anti-rat TERT monoclonal antibody (Santa Cruz, Santa Cruz, CA, USA); mouse anti-rat CD34 monoclonal antibody (BA3414), rabbit anti-mouse SP immunization chemical staining kit (Zhongshan Jinqiao, Beijing, China); and anti-mouse secondary antibody conjugated with horseradish peroxidase (Sigma, St. Louis, MO, USA).
Plasmid Construction
According to the principles introduced by Reynolds et al.Citation8 the cDNA nucleotide sequence of rat liver tissue (GenBank accession no.: NM_198253) was used to design PCR primers: F, 5′-GCCGTCTCAGATCTATGCCGCGCGCTCCCCGCTG-3′, R, 5′-GCCGTCTCGAATTCTCAGTCCAGGATGGTCTTGAAG-3′. Primers contained restriction enzyme sites for BglII and EcoRI. The target fragment was amplified by PCR in 50 μL reactions containing 5 μL 10× reaction buffer solution, 5 μL 10× dNTP, 2U Taq DNA polymerase, 20 mmol each primer, and 2 μL cDNA template. Amplification conditions were 95°C for 2 min followed by 30 cycles of 94°C for 30 s, 65°C for 30 s, and 72°C for 3 min, and 72°C for 6 min. PCR products were purified using a PCR product purification kit (Roche), according to the manufacturer’s instructions. Plasmid and the purified PCR products were digested with BglII and EcoRI and run and recovered from low melting point agarose gel after electrophoresis. PCR products were mixed with plasmid at a molar ratio of 3:1 for ligation reactions using T4 DNA ligase. The resulting recombinant plasmid was named pZsGreen1-C1-TERT.
Enlargement, verification, and re-enlargement of recombinant plasmid
The recombinant plasmid pZsGreen1-C1-TERT was used to transform competent E. coli JM109. Bacteria were grown on selective media containing neomycin and kanamycin and one colony was selected for further culture. The plasmid was extracted by alkaline lysis and verified by BglII and EcoRI double-enzyme digestion. After verification, the plasmid was then extracted using a spin column extraction kit and verified by DNA sequencing.
Extraction and verification of recombinant plasmid
Recombinant plasmid pZsGreen1-C1-TERT was digested with BglII and EcoRI and the products were analyzed by agarose gel electrophoresis. The TERT gene band with the predicted size of 3399 bp and the 4.7 kb pZsGreen1-C1 fragment were obtained and sequences were confirmed by DNA sequencing and comparison with the TERT gene published in GenBank. The homologous recombination was successful and the adenovirus recombinant plasmid (pZsGreen1-C1-TERT) was obtained.
EPCs Transfected with Recombinant Plasmid pZsGreen1-C1-TERT
Isolated culture and verification of EPCs
As previously described,Citation9 blood was collected from the tail vein of healthy female Sprague–Dawley (SD) rats (180–220 g) while under anesthesia with intraperitoneal injection of 10% chloral hydrate (0.3 mL/100 g). Additionally, the rats were soaked in 75% ethanol for 20–30 min, the femur and tibia were removed, and the bone marrow was extracted by washing with M199 basic culture medium. The homogenized bone marrow tissue was added to a sterile test tube containing equal volume of Histopaque-1083 and centrifuged for 20 min at 500×g at room temperature. Cells at the density interface were collected, resuspended in M199 basic culture medium, and washed twice. After the last wash, EGM-2 was used to resuspend cells and the cell density was adjusted to 2–3 × 10⁶ cells/mL. Some of this suspension was used for culture on coverslips prepared in culture dishes. After cells were grown to 80% confluence, coverslips were removed and washed twice with phosphate-buffered saline (PBS), fixed for 15 min with 4% paraformaldehyde, and again washed twice with PBS. Rabbit anti-rat CD133 antibody (1:200), rabbit anti-rat von Willebrand factor (vWF) antibody (1:200), and rabbit anti-rat VEGFR-2 antibody (1:200) were added to individual coverslips and incubated at 4°C in a humid chamber overnight. Coverslips were washed twice with PBS and goat anti-rabbit IgG conjugated to fluorescein isothiocyanate (FITC) was added and incubated for 1 h in 37°C in a humid chamber. Labeled cells on coverslips were observed by fluorescence microscopy.
Plasmid transfection
EPCs were transfected with either the pZsGreen1-C1 plasmid (pZ-EPCs group) or the pZsGreen1-C1-TERT plasmid (pZ-TERT-EPCs group) using Lipofectamine 2000 (Invitrogen), as directed by the manufacturer.
Real-time PCR
After 2 weeks of culture, TERT mRNA levels were quantitatively detected by real-time PCR in cells from the transfected EPCs, pZ-EPCs, and pZ-TERT-EPCs groups. Approximately 1 × 10⁶ cells from each group were collected from six-well plates for real-time PCR detection. The TERT gene sequence (GenBank accession no.: NM_198253) was used to design primers and synthesized by Invitrogen (upstream primer, 5′-GCCGTCTCAGATCTATGCCGCGCGCTCCCCGCTG-3′; downstream primer, 5′-GCCGTCTCGAATTCTCAGTCCAGGATGGTCTTGAAG-3′). Double-distilled water was used instead of template as a negative control. The number of GAPDH transcripts was used as a reference of endogenous RNA, and the quantification of test genes for each sample was standardized relative to the number of GAPDH transcripts. The 2−ΔΔCt cycle threshold formula was used to calculate the relative abundance of transcripts, as previously described.Citation10
Western blot detection of TERT protein expression
At 2 weeks post-transfection, 1 × 10⁶ cells from each group were collected and total protein was extracted. For each sample group, 20 μL total protein was subjected to 15% sodium dodecyl sulphate–polyacrylamide gel electrophoresis (SDS-PAGE) and then transferred to a nitrocellulose membrane. Membranes were treated with a TERT-specific primary antibody (rabbit anti-rat TERT monoclonal antibody; 1:400), incubated for 2 h at 37°C, and then overnight at 4°C. Secondary antibody (goat-anti-rabbit IgG labeled with horseradish peroxidase; 1:30,000) was added to membranes after washing and incubated for 1 h at room temperature. After washing, a color substrate was added and allowed to develop for 2 min in a darkroom, and X-ray film was then exposed to the membranes. The GAPDH signal was set as the internal reference. The image captured by a gel imaging system was analyzed to calculate the ratio of TERT and GAPDH, and a semi-quantitative analysis was conducted using the image analysis system.
EPC proliferative activity
EPCs from each group were obtained 2 weeks after transfection and inoculated in 96-well culture plates with serum-free EGM-2 medium to synchronize culture for 12 h. After 1 day of culture, 3-(4,5-dimethylthiazol-2-yl)-2,5-diphenyltetrazolium bromide (MTT, Amresco, Cleveland, OH, USA) was added to the culture and incubated for 4 h. The liquid was removed, dimethyl sulfoxide (DMSO, Amresco) was added, and the optical density was determined using spectrophotometer.
Senescence-associated β-galactosidase activity for cell senescence
Cell senescence was determined in accordance with the classic method described by Dimri et al.Citation11 and provided by the β-galactosidase (β-gal) detection kit (GENMED, Shanghai, China). Briefly, the culture medium from cells grown under selective conditions 2 weeks post-transfection was removed and a series of washing, fixing, and staining solutions were applied to the cells. Cultures were then incubated at 37°C for 3–16 h or until cells appeared blue. Cells were observed by light microscopy and the blue cells counted were considered as positive, senescent cells. Senescence was calculated as the percentage of blue cells in a total of 200 cells observed by microscopy. This procedure was repeated five times independently.
Annexin-V–FITC/propidium iodide flow cytometry to detect apoptosis
Apoptosis was determined for cells treated with various recombinant vectors using the annexin-V–FITC/propidium iodide (PI) apoptosis kit. Briefly, cells were washed and stained with 5 μL FITC–annexin-V and 5 μL PI and incubated for 15–20 min on ice in the dark. Samples were analyzed by flow cytometry using wavelengths of 488, 515, and 560 nm.
Animal Experiments
A five out of six subtotal nephrectomy modelCitation12 was prepared using 120 female SD rats (180–200 g), which were provided by the Animal Laboratory of Xiangya Second Hospital of Central South University [License Number: SYXK (Xiang), 2004-0013]. Rats were randomly divided into the model group (consisting of double nephrectomy after 1 week interval: two out of three subtotal nephrectomy of the left kidney and complete nephrectomy of the right kidney; n = 24), the sham group (separation of kidneys without excision; n = 24), the EPC group (five out of six subtotal nephrectomy with injection of nontransfected EPCs; n = 24), the pZ-EPC-N group (five out of six subtotal nephrectomy with injection of EPCs transfected with empty plasmid pZsGreen1-C1; n = 24), and the pZ-TERT-EPC group (five out of six subtotal nephrectomy with injection of EPCs transfected with the TERT gene; n = 24). After the models were prepared for 1 week, each animal in their respective groups was injected with 1 mL cell suspension (105 cells/mL) via the tail vein for EPCs-N, pZ-EPCs-N, and pZ-TERT-EPCs-N groups or 1 mL saline via tail vein for the sham group and model group. For the duration of the experiment, all rats were fed an ad lib diet with a 12-h daylight cycle at a room temperature of 23–28°C and relative humidity of 50–70%. The food was the full price pellet feed produced by the Animal Experiment Center of Xiangya Second Hospital of Central South University. Eight mice were sacrificed at 4, 8, and 12 weeks after the treatment and blood, urine, and kidney tissue were obtained for analyses.
Measurement of 24-h urinary volume and urinary protein
Rats were independently housed in metabolic cages to collect 24-h urine output. The Biuret method was used to measure the content of protein in the collected urine.
Blood biochemical analysis
The automatic biochemical analyzer of the Inspection Department at Xiangya Second Hospital was used to complete the determination of creatinine and urea nitrogen content in sera.
Renal pathological examination
After rats from each group were sacrificed, the residual kidney of the left side was removed and placed in 10% neutral formalin to fix for 24 h and then paraffin embedded. Slices of 2–3 μm were obtained and stained with hematoxylin and eosin (HE) and the periodic acid-Schiff staining (PAS). The semi-quantitative method of Radford et al.Citation13 was used to assess the tubule interstitial score (TIS) based on the renal interstitial fibrosis of the cortical area, the infiltration of inflammatory cells, and the classification of tubular dilatation or contraction. The TIS was assessed based on the following criteria: 0, normal; 1, range of lesions <10%; 2, range of lesions 10–24%; 3, the range of lesions 25–50%; 4, range of lesions 51–75%; 5, range of lesions >75%.
Determination of peritubular microvessel density
The peritubular microvessels were detected by the method of immunohistochemistry staining. The primary antibody used was mouse anti-rat CD34 monoclonal antibody and PBS was used instead of the primary antibody as a negative control. The observer used a single-blind method to randomly observe 20 interstitial visual fields for each specimen, and the number of capillaries containing CD34+ cells was counted to obtain the peritubular capillary densityCitation14 (No./HP; the number of microvessels per high-power filed).
Statistical Analysis
The SPSS software package (version 17.0; IBM, Armonk, NY, USA) was used for statistical analyses. Values were expressed as mean ± SD. Differences between groups were evaluated by one-way analysis of variance(ANOVA) (LSD) by correction for multiple comparison. Significance was defined as p < 0.05.
RESULTS
Culture of EPCs and Verification of the Surface Antigen
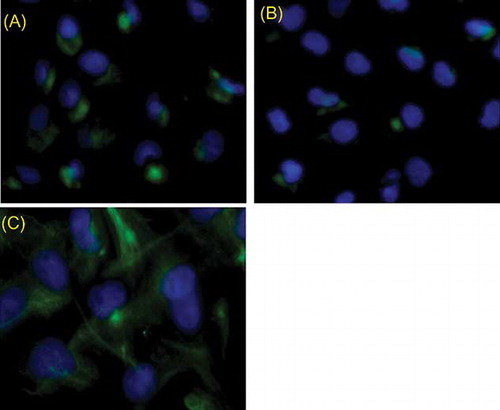
Freshly isolated mononuclear cells from the bone marrow were observed by inverted phase-contrast microscopy, which displayed typical round morphology, and trypan blue staining showed 95% viable cells. At 48 h after culture, cells were observed to become adherent to the culture vessel, and on days 4–8, cells were expanded significantly. Nuclear disintegration was obvious and the cell colony began to appear with much larger rounded cells at the center, and the cells around the edge grew as a monolayer (A). Additionally, cells were arranged in a linear arrangement (B). From days 9 to 12, cells grew rapidly to cover the bottom of the bottle and arranged in an interlocking fashion (C). When the cell cultures reached 90% confluence, a 1:2 split and passage was performed and the cells appeared as a short spindle shape or polygonal shape (D). After 14 days of culture, the cells gradually formed a complete monolayer with connected cells and showed a mesh-like vessel (E and F). After the cells were cultured for 2 weeks on coverslips, immunofluorescence was performed and stained. The cells showed reactivity to CD133, vWF, and VEGFR-2 (A–C), indicating that they are typical markers of EPCs.
Figure 1. Morphology character of EPCs at different times (A–E) ×200, (F) ×400. (A) On the fourth day, small colonies were visible, with some larger cells in the central, surrounded with a few single cells. (B) On the seventh day, there were a large number of short spindle cells around the colonies, and some were end-to-end adherent. (C) On the 10th day, cells covered bottom, and were round or short spindle, “cobblestone” appearance. (D) Secondary cultured cells were smaller and showed short spindle or polygonal cells. (E, F) Cells connected to each other, showing cord-like or vessel-like growth trends.
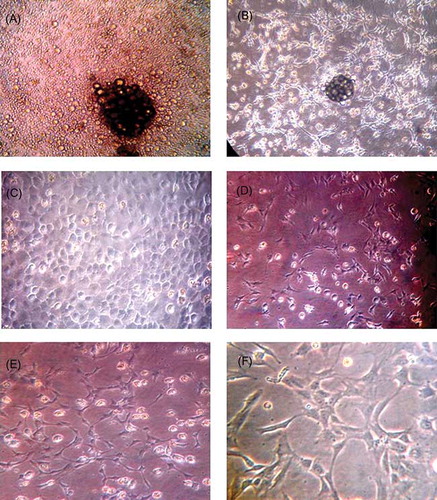
Figure 2. Detection of 2-week EPC surface molecular markers by immunofluorescence. (A) Cells stained positive with CD133, (B) cells stained positive with vWF, (C) cells stained positive with VEGFR-2; the cells showed reactivity to CD133, vWF, and VEGFR-2 that indicated typical markers of EPC.
TERT Expression in EPCs Transfected with Recombinant Plasmid pZsGreen1-C1-TERT
At 72-h post-transfection, cells extracted from the pZ-EPCs and pZ-TERT-EPCs groups were observed under the fluorescence inverted, phase-contrast microscopy. Cells showed green fluorescent protein expression in EPCs, indicating that the eukaryotic expression of empty plasmid pZsGreen1-C1 and the recombinant plasmid pZsGreen1-C1-TERT were successfully transferred and expressed in EPCs. In the real-time PCR analyses, it was found that the TERT mRNA expression level of pZ-TERT-EPCs group (0.49 ± 0.082) was significantly higher than that of the pZ-EPCs (0.44 ± 0.11) and EPCs groups (0.49 ± 0.082) (p < 0.01; A). Western blot was used to detect the TERT protein, and the relative expression level of cells from the pZ-TERT-EPCs group (0.682 ± 0.117) was significantly higher than that of the pZ-EPCs (0.348 ± 0.071) and EPCs groups (0.327 ± 0.057) (p < 0.01), as shown in B.
Figure 3. TERT expression in each EPCs group. (A) Real-time PCR detection of relative TERT mRNA levels. (B) Western blot detection of TERT protein expression. The TERT mRNA and protein of pZ-TERT-EPCs group were significantly higher than that of the pZ-EPCs and EPCs groups.
Notes: # Indicates compared with EPCs group, p < 0.05.
* Indicates compared with pZ-TERT-EPCs group, p < 0.05.
Proliferation and Apoptosis of EPCs After Transfection
The MTT method was used to measure the proliferative activity of cells. The proliferative activity of cell from the pZ-TERT-EPCs group was significantly higher than that of the pZ-EPCs and EPCs groups (p < 0.01; A). Annexin-V was used to assess apoptosis in the EPCs to measure the effects of TERT overexpression. The apoptosis rates of the cells of the three groups after transfection with TERT are listed as follows: EPCs, 5.96 ± 0.78%; pZ-EPCs, 6.32 ± 0.98%; and pZ-TERT-EPCs 4.02 ± 0.89% (B). Taken together, the apoptosis of EPCs obviously decreased after transfection with TERT.
Figure 4. (A) Proliferation of three EPCs groups determined by MTT assay. The absorbance of pZ-TERT-EPCs group was significantly higher than that of the other two groups (p < 0.01). (B) Apoptosis of three EPCs groups determined by flow cytometry. The apoptosis rate of pZ-TERT-EPCs group was significantly lower than that of the other two groups (p < 0.01).
Notes: # Indicates compared with EPCs group, p < 0.05.
* Indicates compared with pZ-EPCs group, p < 0.05.
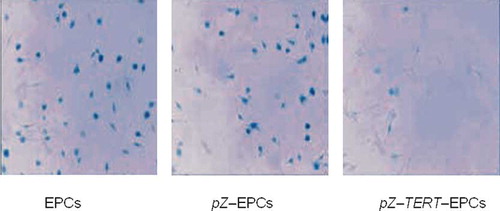
Senescence-associated β-galactosidase Activity in EPCs after Transfection
Expression of senescence-associated (SA)β-galactosidase was used to evaluate senescence of EPCs after transfection with TERT. After cultured for 2 weeks, the proportion of positive cells producing SA–β-galactosidase in the pZ-TERT-EPCs group (6.35 ± 0.21%) was significantly lower than that of the pZ-EPCs (27.19 ± 1.06%) and EPCs groups (26.47 ± 1.65%) ().
Figure 5. SA–β-galactosidase (β-gal) activity for cell senescence. After cultured for 2 weeks, the proportion of positive cells producing SA–β-galactosidase in the pZ-TERT-E PCs group was significantly lower than that of the pZ-EPCs and EPCs groups.
Effect of Transplantation of Bone Marrow-Derived EPCs Transfected with TERT on Renal Function and Renal Interstitial Fibrosis
Twenty-four-hour urinary protein content
Measurement of the 24-h urinary protein content was determined by the Biuret assay and showed that the urinary protein content was different between individuals. No statistical difference was observed among the model, EPCs-N, pZ-EPCs-N, and pZ-TERT-EPCs-N groups at three time points (p < 0.05), but higher than that of the sham group (p < 0.05). The urinary protein content was shown to gradually increase in the model group from weeks 4 to 12 ().
Figure 6. The comparison of the 24-h urine protein level in five groups at different times. No statistical difference was observed among the models, EPCs-N, pZ-EPCs-N, and pZ-TERT-EPCs-N groups, at three time points (p < 0.05), but higher than that of the sham group (p < 0.05). The urinary protein content was shown to gradually increase in the model group from weeks 4 to 12.
Note: * Indicates compared with sham group, p < 0.05.
Creatinine clearance rate
The endogenous creatinine clearance rate (Ccr) was calculated in accordance with the serum creatinine, urine creatinine, and urine volume, Ccr = UCr (μmol/mL) × V (mL/min)/SCr (μmol/mL). As shown in and , the Ccr of animals in the sham group was maintained relatively at a high level (, ). The Ccr of the model group was significantly lower than that of the sham group, with a progressive decline. Collectively, the Ccr of the three treatment groups were lower than that of the sham group at three time points (p < 0.05), but higher than that of the model group at weeks 8 and 12 (, ). Treatment was most obvious in animals treated with pZ-TERT-EPCs-N at week 12 (, ).
Figure 7. Comparison of endogenous creatinine clearance rate (Ccr) in five groups at different times. The Ccr of animals in the sham group was maintained at a relative high level. The Ccr of the model group was significantly lower than that of the sham group, with a progressive decline. Collectively, the Ccr of the three treatment groups were lower than that of the sham group at three time points (p < 0.05), higher than that of the model group at weeks 8 and 12.
Notes: * Indicates compared with sham group, p < 0.05.
# Indicates compared with model group, p < 0.05.
Δ Indicates compared with EPCs group, p < 0.05.
Figure 8. Comparison of tubule interstitial score of five groups at different times. The tubule interstitial injury index was significantly increased in the model group; the three groups that included cell transplantation (EPCs-N, pZ-EPCs-N, and pZ-TERT-EPCs-N) showed less pathological changes than that of the model group, and the interstitial injury index was decreased, especially toward the end of week 12, where the tubule interstitial injury index of the pZ-TERT-EPCs-N group was significantly lower than the model (16.12 ± 1.31) and EPCs-N groups (p < 0.05).
Notes: * Indicates compared with model group, p < 0.05.
# Indicates compared with EPCs-N group, p < 0.05.
Δ Indicates compared with pZ-EPCs-N group, p < 0.05.
Table 1. The comparison of the level of Ccr in different groups () (×10−2 mL/min).
Renal interstitial fibrosis
HE and PAS staining of renal tissue showed that the number of glomerular cells in the sham group was normal, where the capillary loops were open, without expansion, the mesenteric tissue and mesenteric substrate were within the normal range, the structure of epithelial cells of the tubule was complete, and there was no obvious inflammatory cell infiltration and fibrotic changes in the renal interstitial region. In the model group, it was obvious that most of the tubules were atrophied, the wall was fractured, the renal interstitial area was expanded, there was multifocal fibrosis, and the tubule interstitial injury index was significantly increased. The three groups that included cell transplantation (EPCs-N, pZ-EPCs-N, and pZ-TERT-EPCs-N) showed less pathological changes than that of the model group, and the interstitial injury index was decreased, especially toward the end of week 12, where the tubule interstitial injury index of the pZ-TERT-EPCs-N group (7.58 ± 1.82) was significantly lower than the model (16.12 ± 1.31) and EPCs-N groups (10.77 ± 2.26) (p < 0.05) ().
Figure 9. Renal interstitial microvessel at different times in each group (immunohistochemical staining, CD34, ×100). (A–C) Renal interstitial microvessel of sham group at 4, 8, and 12 weeks; peritubular microvascular density was not reduced. (D–F) Renal interstitial microvessel of model group at 4, 8, and 12 weeks; peritubular microvascular density was reduced progressively. (G–I) Renal interstitial microvessel of EPCs-N, pZ-EPCs-N, and pZ-TERT-EPCs-N groups at 12 weeks; all the peritubular microvascular density were reduced, but significantly higher than that of the model group.
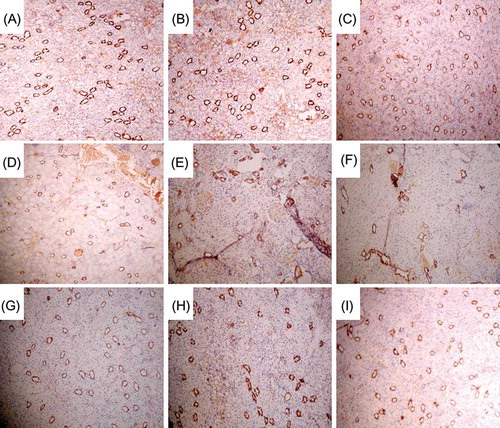
Renal interstitial microvessel density
CD34 is known to be involved in the adhesion and migration of endothelial cell during angiogenesis that could not only represent the distribution of endothelial cells but also could be used to mark the microvessel.Citation15 In this study, immunohistochemical examination of tissues showed that few CD34+ cells were located in the area of tubular atrophy and renal interstitial fibrosis in tissues that showed tubular atrophy and multifocal renal interstitial fibrosis in the model group. Furthermore, CD34+ cells were severely reduced in renal interstitial area and the microvascular density was progressively decreased. Compared with the sham group, the peritubular microvascular density was significantly reduced at weeks 4, 8, and 12 in the EPCs-N and pZ-EPCs-N groups, but significantly higher than that of the model group at weeks 8 and 12 (p < 0.05). The rat renal interstitial MVD of tissues from the pZ-TERT-EPCs group was lower than that of the sham group at week 4 (p < 0.05). Generally, as time progressed, the density of renal interstitial microvessels continued to decline but was not statistically significant when compared with week 4 (p < 0.05). However, at week 12, the density was significantly higher than that of the model, EPCs-N and pZ-EPCs-N groups, but still lower than that of the sham group (p < 0.05) ( and ).
Figure 10. Comparison of peritubular capillaries density of five groups at different times
Notes: * Indicates compared with model group, p < 0.05.
# Indicates compared with EPCs-N group, p < 0.05.
Δ Indicates compared with pZ-EPCs-N group, p < 0.05.
DISCUSSION
Endothelial progenitor cells can directly differentiate to the precursor cells of the vascular endothelial cells, and it has been recently found that they are not only involved in embryonic angiogenesis, but also exist in adult bone marrow, peripheral blood, and umbilical cord blood where they participate in postnatal angiogenesis and re-endothelialization. EPCs can be recruited to the destination site in physiological and pathological states and differentiate to vascular endothelial cells through vascular formation and generation to maintain and repair senescent or damaged endothelial cells.Citation16–19 EPCs have great significance in the treatment of ischemic disease, but the number of EPCs in the peripheral blood or umbilical cord blood of healthy human is low. Although EPCs can be recruited by some factors in the short term, the number of EPCs is only increased in a localized area, which is still far from the desired level of treatment for ischemic disease. For example, the number of EPCs returning to the heart after myocardial infarction has been shown to be significantly increased by nearly two times than before the myocardial infarctionCitation20; however, its absolute value remained lower. In addition, the functional activity of EPCs is also affected by age, diabetes, high cholesterol, and other diseases. Therefore, a major obstacle to the clinical application of EPC is their limited quantity. To conclude, improved EPC proliferation, mobilization, and homing are likely to benefit the use of these cells for treatment and was the focus of this study.
Iwaguro et al.Citation21 recently described the transfer of the VEGF gene into in vitro cultured EPCs and transplanted the cells into a nude mice limb ischemia model. The data suggested that the formation of new blood vessels was increased compared with the control group, and limb necrosis or vascular blanking was reduced by 63.7%. Choi et al.Citation22 inactivated the glycogen synthase kinase gene in EPCs, where the inactivation of such gene could cause the increase of VEGF and IL-8, thereby promoting the survival, growth, and proliferation of EPCs. Taken together, these two studies proved that an increase in the number of EPCs could improve the supply of VEGF, which could in turn promote the growth of EPCs.
Other genes, however, can have an equal or greater effect on EPC proliferation. Murasawa et al.Citation7 modified the TERT of EPCs that resulted in the increase of the number of mitotic divisions of EPCs and extending the survival time of EPCs, providing a novel method for EPCs proliferation. Therefore, in this study, the TERT gene was modified in EPCs and the protein expression was significantly increased. Furthermore, the activity of SA–β-galactosidase was significantly reduced, indicating that sustained high expression of TERT could delay the senescence of EPCs. The MTT cell proliferation test showed that after the TERT gene was introduced into EPCs, the proliferative capacity of EPCs was enhanced, indicating that sustained high expression of TERT could enhance the proliferative capacity of EPCs while delaying senescence. It was further proved that the introduction of the TERT gene significantly reduced EPC apoptosis. Thus, transfection of the TERT gene into EPCs in vitro could effectively alleviate the problem of limited numbers and proliferative capacity of EPCs.
Bohle et al.Citation23 found that the loss of proximal tubular cells (PTCs) is associated with a variety of progressive renal diseases and was suggested to be an important cause of tubule interstitial hypoxia injury and renal interstitial fibrosis. Likewise, Choi et al.Citation24 found that in a variety of kidney diseases with chronic tubule interstitial injury, regardless of the cause, renal interstitial microvascular disease, such as the disordered distribution of PTC, the deformation or contraction of lumen, capillary endothelial cell swelling, the breaking or thickening of the basement membrane, was also present. These microvascular diseases in focal distribution not only had the same location with the tubule interstitial injury, but also the decrease of PTC was positively correlated with renal interstitial fibrosis. Several studies support these conclusions in models of older kidney, residual kidney, and a chronic cyclosporine A kidney, and consistently show decreased PTC and interstitial fibrosis over time.Citation3,25,26 In this study, it was found that five out of six subtotal nephrectomy rats developed gradual tubular atrophy, wall fracture, and multifocal renal interstitial fibrosis after the operation, and as time progressed, the condition worsened. Furthermore, the microvessel was significantly reduced in the renal interstitial fibrosis area, suggesting a relationship between the renal interstitial fibrosis and microvascular injury or loss, which is consistent with the previous studies. However, the causative mechanism of renal interstitial injury and loss of the microvessel is still unknown but it is undeniable that microvascular injury is not an epiphenomenon of renal interstitial fibrosis, but an important cause of renal interstitial fibrosis progression.
In this study, isolated bone marrow EPCs (EPCs-N group), transfected EPCs (pZ-EPCs-N group), and EPCs carrying the TERT gene (pZ-TERT-EPCs-N group) were, respectively, injected into the model rats. No significantly different renal pathological changes, degree of renal interstitial fibrosis, and the peritubular microvascular density were observed between the GFP and model groups. Compared with the rats of model group, rats of the EPCs and pZ-EPCs-N groups had significantly increased Ccr, significantly reduced renal interstitial fibrosis, and significantly increased peritubular MVD. These data indicate that EPC transplantation therapy could reduce peritubular vascular injury and renal interstitial fibrosis in five out of six subtotal nephrectomy rats. It is likely that EPCs transplantation could provide a timely replenishment of damaged endothelial cells, promote capillary angiogenesis, and reduce the tubular interstitial injury that could delay or inhibit progression of renal interstitial fibrosis. Therefore, peritubular vascular injury and loss should be an important reason for the occurrence and development of renal interstitial fibrosis in five out of six subtotal nephrectomy rats, but the specific mechanism requires further study. Our data suggest that to reduce peritubular microvascular injury and maintain the number of peritubular microvessels can effectively reduce the occurrence of renal interstitial fibrosis in five out of six subtotal nephrectomy rats, and indirectly proves that the peritubular microvascular injury may contribute to the progression of renal interstitial fibrosis.
In the further studies, compared with EPCs group, animals in the pZ-TERT-EPCs-N group showed increased renal Ccr, significantly increased peritubular microvascular density, and significantly reduced renal interstitial fibrosis, suggesting that the EPCs transfected with the TERT gene could effectively reduce the loss of peritubular microvessels and the occurrence and development of renal interstitial fibrosis in five out of six subtotal nephrectomy rats. These effects might be related to TERT gene transfection that could increase the proliferative activity of EPCs, delay senescence, and reduce apoptosis.
Overexpression of the TERT gene in any cell, even EPCs, can lead to the transformation to tumor cells, which may be a concern of many studies engaging in the study of stem cell transplantation, such as chromosomal abnormalities, nonadherent growth during culture, or having tumorigenicity in immunodeficient mice. However, this study did not observe any change in cell growth, cell phenotype, and other characteristics after transfection. Moreover, after cells were transplanted into rats, there no malignant change or differentiation in vivo observed throughout the 12-week study.
In summary, EPCs transfected with the TERT gene could enhance cell proliferation, and postpone senescence and apoptosis. The transplantation of TERT gene modified EPCs into five out of six subtotal nephrectomy rats could provide a timely replenishment of injured endothelial cells, reduce the loss of peritubular microvessel, inhibit the progression of renal interstitial fibrosis, and ultimately improve renal function, such as the endogenous Ccr in our results. This study provides findings that warrant further investigation for the prevention and treatment of chronic kidney disease.
Declaration of interest: The authors report no conflicts of interest. The authors alone are responsible for the content and writing of the article.
REFERENCES
- Nangaku M. Mechanisms of tubulointerstitial injury in the kidney: Final common pathways to end-stage renal failure. Intern Med. 2004;43(1):9–17.
- Ohashi R, Shimizu A, Masuda Y, . Capillary regression during the progression of experimental obstructive nephropathy. J Am Soc Nephrol. 2002;13(7):1795–1805.
- Kang DH, Anderson S, Kim YG, . Impaired angiogenesis in the aging kidney: Vascular endothelial growth factor and thrombospondin-1 in renal disease. Am J Kidney Dis. 2001;37(3):601–611.
- Kang DH, Kanellis J, Hugo C, . Role of the microvascular endothelium in progressive renal disease. J Am Soc Nephrol. 2002;13(3):806–816.
- Asahra T, Masuda H, Takahashi T, . Bone marrow origin of endothelial progenitor cells responsible for postnatal vasculogenesis in physiological and pathological neovascularization. Circ Res. 1999;85(3):221–228.
- Bahlmann FH, DeGroot K, Duckert T, . Endothelial progenitor cells proliferation and differentiation is regulated by erythropoietin. Kidney Int. 2003;64(5):1648–1652.
- Murasawa S, Llevadot J, Silver M, . Constitutive human telomerase reverse transcriptase expression enhances regenerative properties of endothelial progenitor cells. Circulation. 2002;106(9):1133–1139.
- Reynolds A, Leake D, Boese Q, . Rational siRNA design for RNA interference. Nat Biotechnol. 2004;22(3):326–330.
- He X, Xu Z, Zheng H, . The separation, culture of bone marrow-derived endothelial progenitor cells from rats. World SCI-Tech R&D. 2008;30:2.
- Livak KJ, Schmittgen TD. Analysis of relative gene expression data using real-time quantitative PCR and the 2(-Delta Delta C(T)) method. Methods. 2001;25(4):402–408.
- Dimri GP, Lee X, Basile G, . A biomarker that identifies senescence human cells in culture and in aging skin in vivo. Proc Natl Acad Sci USA. 1995;92(20):9363–9367.
- Kawamoto A, Gwon HC, Iwaguro H, . Therapeutic potential of ex vivo expanded endothelial progenitor cells for myocardial ischemia. Circulation. 2001;103(5):634–637.
- Radford MG Jr, Donadio JV Jr, Bergstralh EJ, . Predicting renal outcome in IgA nephrothy. J Am Nephrol. 1997;8(2): 199–207.
- Shimizu A, Kitamura H, Masuda Y, . Rare glomerular capillary regeneration and subsequent capillary regressive glomerulosclerosis. Am J Pathol. 1997;151(5):1231–1239.
- Schoell WM, Pieber D, Reich O, . Tumor angiogenesis as a prognostic factor in ovarian carcinoma quantification of endothelial immunoreactivity by in age analysis. Cancer. 1997; 80(12):2257–2262.
- Kawamoto A, Tkebuchava T, Yamaguchi JI, . Intramyocardial transplantation of autologous endothelial progenitor cells for therapeutic neovascularization of myocardial ischemia. Circulation. 2003;107(3):461–468.
- Kawamoto A, Iwasaki H, Kusano K, . CD34-positive cells exhibit increased potency and safety for therapeutic neovascularization after myocardial infarction compared with total mononuclear cells. Circulation. 2006;114(20):2163–2169.
- Murasawa S, Kawamoto A, Horii M, . Niche-dependent translineage commitment of endothelial progenitor cells, not cell fusion in general, into myocardial lineage cells. Arterioscler Thromb Vasc Biol. 2005;25(7):1388–1394.
- Kalka C, Masuda H, Takahashi T, . Transplantation of ex vivo expanded endothelial progenitor cells for therapeutic neovascularization. Proc Natl Acad Sci USA. 2000;97(7): 3422–3427.
- Aicher A, Brenner W, Zuhayra M, . Assessment of the tissue distribution of transplanted human endothelial progenitor cells by radioactive labeling. Circulation. 2003;107(16):2134–2139.
- Iwaguro H, Yamaguchi J, Kalka C, . Endothelial progenitor cell vascular endothelial growth factor gene transfer for vascular regeneration. Circulation. 2002;105(6):732–738.
- Choi JH, Hur J, Yoon CH, . Augmentation of therapeutic angiogenesis using genetically modified human endothelial progenitor cells with altered glycogen synthase kinase-beta activity. J Biol Chem. 2004;279(47):49430–49438.
- Bohle A, Mackensen-Haen S, Welmnann M. Significance of post-glomerular capillaries in the pathogenesis of chronic renal failure. Kidney Blood Press Res. 1996;19(3–4):191–195.
- Choi YJ, Chakraborty S, Nguyen V, . Peritubular capillary loss is associated with chronic tubulointerstitial injury in human kidney: Altered expression of vascular endothelial growth factor. Hum Pathol. 2000;31(12):1491–1496.
- Miya M, Maeshima A, Mishima K, . Enhancement of in vitro human tubulogenesis by endothelial cell-derived factors: Implications for in vivo tubular regeneration after injury. Am J Physiol Renal Physiol. 2011;301(2):F387–F395.
- Ohashi R, Kitamura H, Yamanaka N. Peritubular capillary injury during the progression of experimental glomerulonephritis in rats. J Am Soc Nephrol. 2000;11(1):47–56.