Abstract
Chronic renal failure is a devastating disease that leads to a multitude of complications. Cell therapy has emerged as a potential treatment modality for renal failure. However, efficacy testing on systemic renal function has been challenging due to the limited availability of reliable models that are fully characterized. In this study, we investigated the possibility of using renal ischemia/reperfusion (I/R) injury as a viable model for testing cell therapies. We examined functional and pathological changes in rat kidneys that were exposed to different ischemia times. Male Lewis rats were divided into five groups. Renal failure was induced by clamping both renal pedicles for combinations of 60, 75, and 90 min, followed by reperfusion. Age-matched healthy rats served as controls. Blood was collected at regular intervals for serum chemistry, and kidneys were harvested at the same intervals for histomorphological assessment. Serum creatinine levels of the animals with I/R injury increased significantly after 3 days and returned to normal levels at 4 weeks. Histologically, kidney tissue showed progressive glomerular and tubular deterioration with varying degrees of fibrosis. Animals exposed to 75- and 90-min ischemia combination times consistently generated more severe injury than the 60-min ischemia period. However, these groups resulted in a high mortality rate. A model in which one kidney is exposed to a shorter ischemia time (60 or 90 min) resulted in sustained renal damage with a lower mortality rate. This study shows that kidneys exposed to I/R result in renal tissue damage as well as decreased renal function. This model can be used to study both the short-term and longer-term effects of kidney disease by varying the length of the ischemic time. In particular, the use of longer ischemic times (75 and 90 min) could be used to study new therapies for acute renal disease, whereas shorter ischemic times (60 min) could be used to study therapies for chronic renal insufficiency.
INTRODUCTION
Chronic kidney disease is a common condition that leads to uremia and cardiovascular complications. The incidence of renal failure has gradually increased over the past decade.Citation1 Currently, the standard treatments for renal failure are dialysis and renal transplantation. However, dialysis is a costly and tedious procedure that decreases the patient’s quality of life. In addition, dialysis only replaces the filtration function of the kidneys, and other functions, such as hormone and vitamin secretion, must be replaced through other means.Citation1–3 Transplantation, on the other hand, can fully replace renal function, but immune response and graft rejection remain problematic, and the procedure is limited by the availability of donor organs.Citation4 As such, other treatment modalities for this devastating disease have been pursued.Citation5,6
Cell-based therapy using regenerative medicine technology has emerged as a potential alternative for patients with pathologic renal conditions. Kidney cell expansion for cell transplantation has been proposed as a method to augment either isolated or total renal function.Citation7–11 Although the possibility of using cells to augment renal tissue structures has been demonstrated previously through morphological and functional analyses, validation of efficacy related to systemic renal function has been challenging due to the limited availability of reliable and reproducible renal failure models suitable for cell therapies.Citation12–15 Moreover, comprehensive analyses on the progression of renal tissue damage in relation to time have not been fully established.
Several laboratory models of renal failure have been described in the literature. These include renal mass reduction or 5/6 nephrectomy, renal ischemia/reperfusion (I/R), and the administration of nephrotoxic drugs such as Gentamicin.Citation14,16,17 The 5/6-nephrectomy model is commonly used to create impaired renal function and produce proteinuria. However, this model does not fully mimic the histo-morphologic presentation of renal disease.Citation18 Furthermore, the procedure leaves a small residual amount of renal tissue, which may not be compatible with testing of some cell-based therapies. Renal warm I/R model creates significant tubular injury, accumulation of inflammatory cells, and renal scarring.Citation19 The I/R model of renal failure presents with many physiologic similarities to the pathophysiology of progressive renal disease. Even though, full recovery of renal functions is expected in the short term, this model ultimately progresses toward renal impairment in a similar fashion to the human pathologic conditions while maintaining the physiologic renal mass. For this reason, I/R injury provides a good model to test therapeutic interventions in the pathophysiologic pathways that lead to acute renal failure. Although I/R is widely used to model the mechanisms of renal failure, the ischemia times reported in most previous studies are between 30 and 60 minCitation20–22 and impaired renal function is seen only during the first week after surgery.Citation14,22 Thus, the model could not be used to test the longer-term effects of novel therapies. Longer ischemia times have not been evaluated to date. In this study, we investigated survival, renal function, renal substructure injury, extracellular matrix accumulation, and cell turnover after longer renal ischemia times. This technique would allow a better understanding of renal injury and results in a model that could be used for further testing of cell-based therapies.
MATERIALS AND METHODS
Ethics Statement and Experimental Design
This study was approved by the Wake Forest University Health Sciences Institutional Animal Care and Use Committee (IACUC) and was performed according to the criteria provided by the Institute for Laboratory Animal Research Guide for the Care and Use of Laboratory Animals. A total of 300 male Lewis rats between 8 and 12 weeks of age (300–350 g; Charles River Laboratories, IL) were used in this study. All rats were pair-housed, allowed free access to standard diet and water, and subjected to a 12-h light–dark cycle. The animals were divided into six groups based on the ischemia time: bilateral 60 min, 60/75 min, 60/90 min, bilateral 75 min, 75/90 min, and control. Fifty-five rats were assigned to each experimental group (total of 275 animals), and 25 rats were assigned to the control group. Five animals were taken out at the seven time points planned for this study (1, 2, 3, 4, 6, 8, and 12 weeks post-operation, for a total of 35 animals per group). The extra 20 animals assigned to each experimental group were used to offset any mortality or morbidity associated with the model generation.
Surgical Procedure
Animals were anesthetized by an intra-peritoneal injection of sodium pentobarbital (Nembutal, Ovation Pharmaceuticals, Inc., Deerfield, IL) at an initial dose of 50 mg/kg, and anesthesia was maintained using 25 mg/kg/h. The kidneys were accessed through a 3-cm midline abdominal incision. Renal pedicles were identified, and non-traumatic vascular clamps (Micro-serrefine curved 6 mm, Fine Science Tools Inc., Foster, CA) were applied to both the renal artery and vein on each side to achieve complete ischemia of the corresponding kidneys. Each group was subjected to their predetermined ischemia time. Where applicable, the left kidneys received the longer ischemia times. During ischemia, rats were maintained under anesthesia and placed on heating pads. After the corresponding ischemia time for each animal had elapsed, the clamps were removed and the incisions were closed in two layers using 3–0 polyglycolic acid interrupted sutures (Ethicon, Somerville, NJ). Prior to the animal’s full recovery, a subcutaneous injection of buprenorphine (Buprenex Injectable, Reckitt Benckiser Pharmaceuticals, Richmond, VA) at a dose of 0.03 mg/kg was administered for pain relief. The analgesic regimen was repeated every 8–12 h thereafter when needed for a maximum duration of 48 h post-surgery. Throughout the experiment, rats were evaluated for quality of life and were sacrificed if suffering could not be alleviated. Special criteria were predetermined by the IACUC for animal sacrifice, which included but were not limited to the following:
| 1. | Severe lethargy and failure to thrive | ||||
| 2. | Hunched-up posture and vocalization to touch | ||||
| 3. | Severe dehydration uncontrolled by subcutaneous injections of fluids. | ||||
If these criteria were seen in the animals, they were euthanized and reported as mortality from the procedure. Death was not an acceptable endpoint for this study.
Functional Data Analysis and Follow-Up
Serum creatinine levels were used to assess renal functions. Blood samples were collected from the animals 1 week prior to surgery to determine baseline creatinine levels. Blood samples were collected at 3 days and 1, 2, 3, 4, 6, 8, and 12 weeks after ischemic insult. Samples were analyzed using a SYNCHRON CX5 Delta (Beckman Coulter Inc., Brea, CA) blood chemistry machine. Forty rats (after removing 15 animals for the first three time points) from each group were followed throughout the first 4 weeks after surgery to assess the survival rate of each group.
Histological Data Analysis
Five rats from each group were sacrificed at all post-operative time points, and three of those were used for blood collection except for the 3 days time point. Euthanasia was carried out according to the guidelines set by the IACUC, using CO2 as the primary method and cervical dislocation as the secondary method. The kidneys were harvested, frozen, and serially sectioned at a thickness of 6 μm. Slides were then stained using hematoxylin and eosin (H&E), terminal deoxynucleotidyl transferase (TdT), and proliferating cell nuclear antigen (PCNA). Statistics were run on both TdT and PCNA images (ImageJ software package, NIH, USA, Graph pad prism version 4 statistics program). After collecting the data, it was apparent to us that kidneys exposed to similar ischemia time showed similar results regardless of the experimental group. Therefore, all kidneys undergoing the same ischemia time were pooled together; thus, three groups were then identified (60-, 75-, and 90-min ischemia time). All histological analyses were done using these three groups.
Histology
Three serially sectioned slides from each animal in each group at each time point were stained with H&E (n = 15/group/time point). Representative images were taken at 200× magnification to assess the structural integrity of the glomeruli and tubules, presence of fibrosis, and overall architectural change.
TUNEL Staining
Three slides from each animal in every group at each time point (n = 15/group/time point) were stained for apoptotic markers using a terminal deoxynucleotidyl transferase dUTP nick end labeling (TUNEL) assay according to the manufacturer’s recommended procedures (TACS In Situ Apoptosis Detection Kit, R&D Systems, Minneapolis, MN). Ten random high-power fields (200×) of the cortex were taken from each slide. Images were evaluated using Image-pro AMS 6.0 (Media Cybernetics Inc., Rockville, MD), and the number of dead nuclei was counted. The ratio of dead/live cells was evaluated and compared between groups.
Collagen Assay
Samples from six kidneys from each group at the corresponding time points were processed using a collagen assay (Soluble Collagen Assay, Bicolor Ltd., UK). Approximately 500 mg samples containing both the cortex and medulla were selected, minced, and subjected to 20 mL of 0.5 M acetic acid (Fisher Scientific, Fair Lawn, NJ) for 3 days. A total of 100 μL samples of the collagen/acetic acid solution were used for the standard collagen assay protocol. Absorbencies were read at 540 nm wavelength using a spectrophotometer (Biomate 3, Thermo Spectronic, Waltham, MA). The absorbencies were then used to calculate the percent weight of collagen in the sample, and this was used to compare percentage of fibrous tissue deposition within the kidney tissue at different time points and between groups.
Immunohistochemistry for PCNA
Three slides from each group at each time point were stained for proliferating cells using immunohistochemistry to PCNA. All slides were blocked in 10% serum (from the animal the secondary antibody was made in) for 45 min and incubated with monoclonal mouse anti-PCNA (1:50; Dako, CA) for 1 h. Thereafter, the sections were washed and incubated with the biotinylated secondary antibody (1:200; Vector, UK) for 30 min, followed by incubation with peroxidase-conjugated streptavidin for 30 min at room temperature. Detection of PCNA was performed using a solution of Nova-RED® (Vector, CA). Finally, the sections were counterstained with hematoxylin for 1 min. Negative controls were incubated with 3% serum without primary antibody. Five random pictures of the cortex were taken at 200× magnification from each slide. Positive (red) nuclei were then counted using Image-Pro AMS 6.0 and were compared to the total number of nuclei. A percentage of proliferating nuclei was extrapolated, and this number was compared between groups.
Glomerular Number and Tubule Injury Index
Three sections from each animal in every group were stained in H&E (n = 15/group/time point) for evaluation at each time point. Sections were chosen a minimum of 50 μm apart to ensure total kidney representation. The glomeruli in the renal cortex were counted under low power magnification (100×). Random microscope fields were chosen from the cortex by unfocusing the microscope and randomly moving the sample to a different site. A total of 15 representative images were used for evaluation purposes. In the same images, tubular injury was scored using a previously described semi-quantitative scale designed to evaluate the degree of tubular necrosis.Citation23 Higher scores indicated more severe damage as follows: 0 = normal kidneys; 1 = minimal injury (<5% involvement); 2 = mild injury (5–25% involvement); 3 = moderate injury (25–75% involvement); 4 = severe injury (>75% involvement).
Statistics
Data were presented as mean values ± SEM. Differences between groups were analyzed using either a one-way analysis of variance or an unpaired Students’ t-test in Prism 5 (Graph Pad Software Inc., La Jolla, CA), and p < 0.05 was considered to be significant.
RESULTS
Survival Rate and Progression of Renal Function After I/R Injury
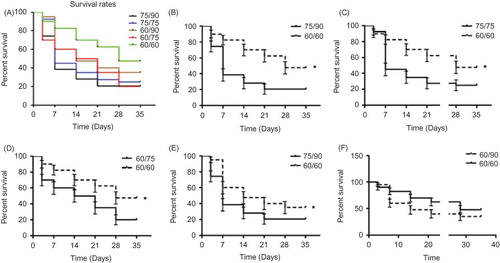
The survival rates after injury in the five groups differed as expected, with the highest mortality occurring in the 75/90-min group (38.46% and 20.51% survival at 1 week and 4 weeks, respectively) and the lowest occurring in the bilateral 60-min group (82.5% and 47.5% survival at 1 week and 4 weeks, respectively). The survival rates in the other three groups ranged between these values (A). The bilateral 60-min group had a significantly higher survival rate compared to the 75/90-, 75/75-, and 60/75-min groups (p < 0.05; B–D). There was also a significant difference between the 60/90- and 75/90-min groups (p < 0.05; E). Within the first week after surgery, a high mortality rate was noted in all groups except for the bilateral 60-min group. Mortality leveled off in all groups around the third and fourth post-operative weeks. Most notably, the 60/90-min group sustained high initial mortality, but this rate was reduced after the first week.
Figure 1. Survival rates after ischemic renal injury. (A) Rats exposed to 75/90-min ischemia sustained the most losses (38.46% vs. 20.51% survival, at 1 week and 4 weeks, respectively), whereas rats exposed to the 60/60-min ischemia protocol sustained the least (82.5% vs. 47.5% survival, at 1 week and 4 weeks, respectively). The survival rates in the other three groups fell in between these values. The bilateral 60-min group demonstrated a significantly better survival rate compared to the 75/90-, 75/75-, and 60/75-min groups (*p < 0.05). There was also a difference between the 60/90- and 75/90-min groups (*p < 0.05).
The creatinine values also showed a significant deterioration of renal function after the first 3 days, but all groups quickly recovered by the second week (A). There was a significant difference between the 75/90-, 75/75-, and 60/90-min groups and the 60/75-min and bilateral 60-min groups after the first 3 days (p < 0.001; B). After first week, higher creatinine levels were only observed in the 75/75-min (second and fourth week) and 75/90-min (third week) groups compared with the control group (p < 0.01 and p < 0.05, respectively; C). There was no significant difference between any groups at any time point after the sixth week for the remaining duration of the study.
Figure 2. Effect of ischemia/reperfusion (I/R) injury on renal function. Renal function pre- (0 h) and post-ischemia and reperfusion were evaluated through measurement of serum creatinine (SCr) concentration. (A) Average SCr level rose during the first week after injury and then recovered after 2 weeks. (B) SCr in all groups on the third day after I/R was higher than the normal control (*p < 0.001,), and there were some differences between the groups (#p < 0.01). (C) After a peak in the first week, a few groups still had impaired renal function at 2, 3, and 4 weeks (*p < 0.01 vs. control at 2, 3 week and p < 0.05 at 4 week). (D) Percentage of the animals with renal insufficiency (Scr > 1.1).
Percentage of Animals with Renal Impairment
Although the percentage of animals sustaining renal impairment was low in all five groups, significant differences were present. The three groups with the highest overall ischemia times initially had the highest percentage of animals with renal insufficiency, but after the fourth week they showed a marked decrease. The bilateral 60-min group did not reach a high initial level of impairment, but remained at a relatively constant level throughout the study (D).
Architectural Degradation within Renal Substructures
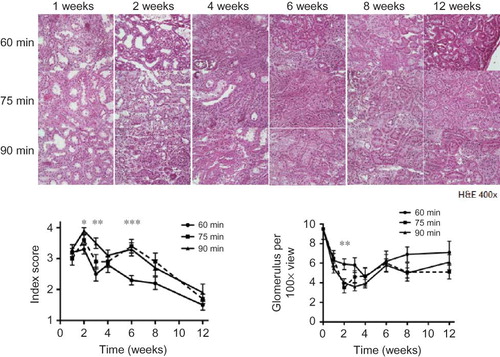
Based on findings from the H&E staining, significant renal tubular deterioration occurred during the first 2 weeks after renal I/R (A). The renal tubules showed a significant increase in lumen diameter, sloughing off of cells into the lumen, and overall architectural disjointedness during the first 2 weeks. Inflammatory cells were present throughout the injured kidneys starting in the fourth week, and these were present throughout the sixth week of injury. At 12 weeks post-injury, the tubular structures appeared normal, but significant glomerular sclerosis was present throughout the tissue.
Figure 3. (A) Representative example of renal histology at different time points after ischemic injury. The renal tubules showed an increase in lumen diameter, sloughing off of cells into the lumen, and overall architectural disjointedness at 2 weeks. Starting in the fourth week and continuing through the 6th week, inflammatory cells occupied the whole kidney. At 12 weeks post-injury, the structure of the tubules returned to normal but some glomerular sclerosis was still present throughout the tissue. Sections were stained with hematoxylin and eosin (400×). (B) Tubular injury increased significantly after the first week in all three ischemia groups. The 75- and 90-min ischemic kidneys had significantly more evidence of injury at 1, 2, and 6 weeks compared to the 60-min ischemic kidneys. (C) The 75- and 90-min ischemic kidneys had fewer glomeruli than 60-min ischemic kidneys at the 2 week time point (p < 0.01). There was no difference in each ischemia group or between the time points after 1 week.
Tubule Injury Index
Tubular injury increased significantly after the first week in all groups, and the injury index peaked at 2 weeks after ischemia. After the third week, the tubular injury index steadily decreased. The 75- and 90-min kidneys of all groups had significantly higher injury indexes compared to the 60-min kidneys at 1, 2, and 6 weeks time point. The control was assumed to have a score of 0 (B).
Glomerular Number
The number of glomeruli in the injured kidneys decreased starting at 1 week after ischemia (9.5 ± 1.07, 6.3 ± 0.7, 6.5 ± 0.79, and 5.5 ± 0.5 glomeruli/100× visual field for normal, 60, 75, and 90 min, respectively) (C). The 75- and 90-min ischemic kidneys had significantly lower glomerular numbers compared with 60-min ischemic kidney at the 2-week time point (5.9 ± 0.54, 3.5 ± 0.54, and 4.0 ± 0.42 glomeruli/100× visual field for 60, 75, and 90 min at 2 weeks, respectively). The number of glomeruli never returned to a normal level at any time point studied. There were no differences between the time points after 1 week in any of the groups.
PCNA and Renal Regeneration
Within the first week after the ischemic insult, all groups showed a distinct increase in the number of PCNA-positive nuclei present in the renal tissue sections. However, a smaller increase in PCNA staining was observed in kidneys exposed to 90 min of ischemia (p < 0.05; A). After the second week, all groups slowly returned to normal during the course of the experiment. By 12 weeks post-surgery, all groups had returned to a normal level of dividing cells. There were no differences between each of the three groups.
Figure 4. (A) At 1 week, the 90-min group had fewer PCNA positive cells than the other groups (p < 0.05). (B–D) Cell death increased throughout the entire experiment in all three ischemic groups compared to the age-matched control (p < 0.001, data not shown). In all three groups, the number of apoptotic cells increased steadily during the 6 weeks post-surgery, and then leveled off beginning at 8 weeks. While there was a significant difference between time points within each group (p < 0.001), there was no difference between 60-, 75-, and 90-min ischemic kidneys at each time point.
Progression of Renal Cell Death
Cell death increased throughout the entire experiment in all groups when compared to the age-matched controls (p < 0.001; B–D). All groups showed a steady and significant increase through 6 weeks post-surgery, but starting at 8 weeks the number of dying cells began to level off. There was also a significant difference between the various time-points and each ischemia duration (p < 0.001). However, there were no differences between 60-, 75-, and 90-min ischemic kidneys at any time point. Apoptosis occurred on both the tubular and endothelial cells initially. However, the progression of apoptosis was increasingly prominent on the tubular cells, and less on the endothelial cells. Infiltrating leukocytes did not show noticeable apoptosis.
Development of Fibrosis within the Renal Tissue
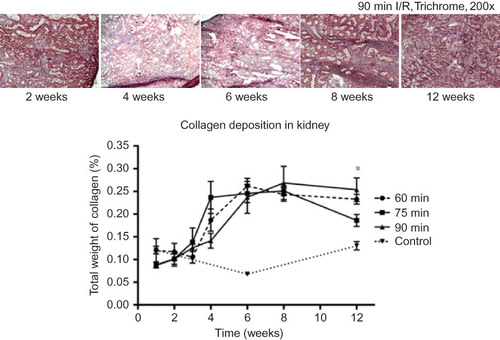
All groups showed a generalized and steady increase in collagen deposition up to 6 weeks. This deposition had leveled off or even decreased slightly at 12 weeks post-surgery. When compared to the control kidneys, an increase in collagen deposition could be seen beginning at 3 weeks post-ischemia in all groups and rose sharply up to 6 weeks. However, there was no significant difference between 60-, 75-, and 90-min kidneys of all groups except at the 12 week time point. At this time point, the 90-min kidneys appeared to contain more deposited collagen than the 75-min kidneys (p < 0.05; ).
Figure 5. Compared to the control kidneys, all three ischemic groups demonstrated increases in collagen deposition during the 4th week, and continued to rise sharply until 6 weeks. There was, no significant difference between the groups, except at the 12 week time point, in which the 90-min ischemic kidneys appeared to have more collagen deposition than the 75-min kidneys (*p < 0.05).
DISCUSSION
Cell therapy has emerged as a treatment modality for patients with renal failure. Many cell types from various sources have been used experimentally to augment cellular and tissue function.Citation7–10 While these cells have shown varying evidence of effects on kidney tissues, it is uncertain whether transplanted cells are able to improve systemic renal function. To test the effectiveness of any regenerative technology including cell-based therapy as a treatment modality for renal failure, it is essential that a validated model be developed. An appropriate renal failure model should mimic the pathophysiological characteristics similar to that of clinical conditions, which retain physical renal mass and structure.Citation1,19,24 More importantly, a reliable and reproducible model of renal failure is required to test the systemic effects of cell-based therapies. Although several renal failure models have been established for various investigative purposes, none of these models is fully characterized and validated for determining the effects of cell-based therapies. In this study, we investigated the possibility of using renal I/R injury as a possible model for cell therapy. We examined the functional and pathological changes in the rat kidneys that were exposed to different combinations of ischemia times. We show that the renal I/R model is reliable for studying both the short-term and longer-term effects of kidney disease by varying the length of ischemic time.
Several renal failure models have been developed in rodents, which include the renal remnant (5/6th nephrectomy), I/R, nephrotoxic drug, immune induction, and ureteral obstruction.Citation14–17,25,26 The renal remnant model is created by unilateral nephrectomy with either surgical resection of the two poles of the contralateral kidney or ligation of 2/3rd of the renal artery branches. This model is characterized by systemic hypertension, proteinuria, renal dysfunction, and progressive fibrosis.Citation27 However, this model results in a large reduction in the kidney mass as well as heterogeneous renal injury, which does not represent clinical conditions. On the contrary, I/R renal injury is a common clinical event, which is associated with high mortality and morbidity.Citation28 Post-ischemic acute tubular necrosis is observed in patients after cardiac and aortic surgery, trauma, shock, and burns, as well as in transplanted organs.Citation24 The ischemic kidney model demonstrates marked changes in the tubular architecture including accumulation of inflammatory cells and renal scarring. This model has been widely used to study the mechanisms involved in acute renal failure. The ischemia times commonly used in previous studies were usually between 30 and 60 min.Citation13,20–22 Grigoryev et al. reported significant increases in serum creatinine level in bilateral 60-min renal ischemia compared with 30-min ischemia or sham-operated rats.Citation29 These data indicated that longer ischemia times lead to poorer outcomes. In order to create an animal model that demonstrates severe and widespread renal injury for in vivo studies of new therapeutic manipulations such as cell therapy, we hypothesized that using ischemia times exceeding 60 min would result in increased renal damage and subsequently deteriorate renal functions. In our pilot studies, bilateral 90-min ischemia had a 100% mortality rate within 3 days of surgery and was therefore excluded from our experimental groups. Thus, our study design included different ischemia times between 60 and 90 min with different combinations. Deterioration of renal function increased and peaked by the third day after the procedure. The bilateral 60-min ischemia rats had comparable creatinine levels to previous studies in the literature (2.59 ± 0.35 mg/dL in this study vs. 2.86 ± 0.12 mg/dL). However, the longer ischemia groups showed a significant decrease in renal functions. In the 75/90-, 75/75-, and 60/90-min groups, creatinine levels were around 5 mg/dL (5.04 ± 0.5 mg/dL, 5.13 ± 0.35 mg/dL, and 4.67 ± 0.3 mg/dL, respectively) within the first 3 days. Compared to previously reported elevation of 2.5–4 mg/dL on the third day after ischemia using 30–60 min,Citation20–22 our results indicate that longer ischemia time considerably increased renal dysfunction within the first week. In addition, renal dysfunction persisted in the groups experiencing longer ischemic times (75/90 and 75/75 min) through the fourth week. We believe that during this 4-week time frame, functional evaluation of treatment modalities for acute renal failure could be performed.
In this study, the 75/90-min group did not have the highest creatinine level at all time points. One possible explanation for this outcome may be that the most affected animals did not survive (highest mortality rate) beyond the first 2 weeks. Only a few previous studies have addressed the survival rate in the ischemia model.Citation21,30 They reported 60–100% mortality within 72 h after bilateral 45-min or 60-min ischemia. In this study, the 75/90- and 75/75-min groups had the highest mortality rate. In these two groups, more than 60% of animals died within the first 2 weeks. In spite of this high mortality rate, we believe that longer ischemia could serve as a good model of severe acute renal failure and could be used to test treatments designed to be delivered immediately or very soon after the initial trauma. A significant improvement in the mortality rate would be indicative of a successful treatment. However, shorter ischemia times may also be very useful in studies of chronic renal damage since these animals would be expected to survive over a longer term.
Immediately following injury, we were able to identify high numbers of damaged tubular cells in the ischemic kidneys. Forbes et al. quantified TUNEL positive cells in rat kidneys that had sustained 45 min of bilateral ischemia. They reported that apoptosis was most common during the first week after ischemia, with less than 3% of cells appearing TUNEL-positive.Citation14 In this study, however, apoptosis increased with time in each group and stabilized 6 weeks after the initial injury. The apoptotic cells represented up to 14.5% of the total population after 6 weeks. These findings indicate that exposure to longer ischemia times leads to prolonged and diffuse renal injury. Renal repair represents a delicate balance between cell loss, cell proliferation, and extracellular matrix remodeling. Renal tubules are highly susceptible to hypoxic injury, but they are also capable of rapid regeneration and functional recovery.Citation31 To create a sustainable model of renal impairment, it was necessary to induce a severe insult to the kidneys to overwhelm the regeneration process. In this study, the percentage of apoptotic cells (TUNEL-positive) in all groups was higher than the percentage of proliferating (PCNA-positive) cells, which indicates that exposure to longer ischemia times overwhelm the intrinsic renal repair mechanisms. We show that initiation of renal regeneration occurs immediately after injury, but this process gradually decreases over time. However, cell death continues up to 6 weeks post-injury. This may be the reason why tubular injury indexes improved after 6 weeks of the initial injury in this study. Another possible reason of tissue damage after ischemic injury in the kidneys is the recruitment of inflammatory cells into the damaged area, which causes fibrotic injury and collagen deposition.Citation12 Previous studies also suggest that apoptotic cell death, either directly or indirectly, contributes to I/R-induced inflammation, as well as to the consequent tissue damage.Citation32 This is consistent with our results in that apoptosis persisted during the first 6 weeks after I/R injury as well as accumulation of inflammatory cells, which gradually decreased thereafter. Consequently, fibrosis and collagen deposition were evident in the kidney tissue. A series of collagen assay performed on the ischemic kidneys at different time points after the initial injury confirmed these findings. We show that collagen deposition increased over the 6-week period following ischemic injury.
The renal impairment model created with varying degrees of injury may serve as an excellent tool to assess levels of kidney damage and progression for future interventions such as cellular therapies. Both the short- and long-term effects of various procedures can be evaluated using this model. However, further development and validation will be necessary to generate a more chronic form of renal impairment for testing therapies that target chronic renal failure.
ACKNOWLEDGMENTS
The authors thank Dr. Jennifer Olson for editorial assistance, and Kenneth Gyabaah and Adam Wilson for technical support.
Declaration of interest: Drs. Atala and Yoo served as consultants for Tengion, Inc. during the study period.
This work was supported by Tengion, Inc. through a sponsored research agreement.
Notes
Hung-Jen Wang and Adam Varner have contributed equally to this work.
REFERENCES
- Coresh J, Selvin E, Stevens LA, . Prevalence of chronic kidney disease in the United States. J Am Med Assoc. 2007; 298:2038–2047.
- Liu J, Huang Z, Gilbertson DT, Foley RN, Collins AJ. An improved comorbidity index for outcome analyses among dialysis patients. Kidney Int. 2010;77:141–151.
- Collins AJ, Foley RN, Gilbertson DT, Chen SC. The state of chronic kidney disease, ESRD, and morbidity and mortality in the first year of dialysis. Clin J Am Soc Nephrol. 2009;4(Suppl. 1):S5–S11.
- Meyer TW, Hostetter TH. Uremia. N Engl J Med. 2007; 357:1316–1325.
- Choi S, Park M, Kim J, . The role of mesenchymal stem cells in the functional improvement of the chronic renal failure. Stem Cells Dev. 2008;18:521–529.
- Joraku A, Stern KA, Atala A, Yoo JJ. In vitro generation of three-dimensional renal structures. Methods. 2009;47:129–133.
- Aboushwareb T, Egydio F, Straker L, . Erythropoietin producing cells for potential cell therapy. World J Urol. 2008;26: 295–300.
- Aboushwareb T, Atala A. Stem cells in urology. Nat Clin Pract Urol. 2008;5:621–631.
- Krieter DH, Fischer R, Merget K, . Endothelial progenitor cells in patients on extracorporeal maintenance dialysis therapy. Nephrol Dial Transplant. 2010;25:4023–4031.
- Petrovic V, Jovanovic I, Pesic I, Stefanovic V. Role of stem cells in kidney repair. Ren Fail. 2010;32:1237–1244.
- Kelley R, Werdin ES, Bruce AT, . A tubular cell-enriched subpopulation of primary renal cells improves survival and augments kidney function in a rodent model of chronic kidney disease. Am J Physiol Renal Physiol. 2010;299:F1026–F1039.
- Day YJ, Huang L, Ye H, Linden J, Okusa MD. Renal ischemia-reperfusion injury and adenosine 2A receptor-mediated tissue protection: role of macrophages. Am J Physiol Renal Physiol. 2005;288:F722–F731.
- Delbridge MS, Shrestha BM, Raftery AT, El Nahas AM, Haylor JL. Reduction of ischemia-reperfusion injury in the rat kidney by FTY720, a synthetic derivative of sphingosine. Transplantation. 2007;84:187–195.
- Forbes JM, Hewitson TD, Becker GJ, Jones CL. Ischemic acute renal failure: long-term histology of cell and matrix changes in the rat. Kidney Int. 2000;57:2375–2385.
- Nakano Y, Hirano T, Uehara K, . New rat model induced by anti-glomerular basement membrane antibody shows severe glomerular adhesion in early stage and quickly progresses to end-stage renal failure. Pathol Int. 2008;58:361–370.
- Thomas GL, Yang B, Wagner BE, Savill J, El Nahas AM. Cellular apoptosis and proliferation in experimental renal fibrosis. Nephrol Dial Transplant. 1998;13:2216–2226.
- Yang L, Li X, Wang H. Possible mechanisms explaining the tendency towards interstitial fibrosis in aristolochic acid-induced acute tubular necrosis. Nephrol Dial Transplant. 2007;22:445–456.
- Perez-Ruiz L, Ros-Lopez S, Cardus A, Fernandez E, Valdivielso JM. A forgotten method to induce experimental chronic renal failure in the rat by ligation of the renal parenchyma. Nephron Exp Nephrol. 2006;103:e126–e130.
- Basile DP, Donohoe D, Roethe K, Osborn JL. Renal ischemic injury results in permanent damage to peritubular capillaries and influences long-term function. Am J Physiol Renal Physiol. 2001;281:F887–F899.
- Jo SK, Yun SY, Chang KH, . Alpha-MSH decreases apoptosis in ischemic acute renal failure in rats: possible mechanism of this beneficial effect. Nephrol Dial Transplant. 2001;16:1583–1591.
- Nemoto T, Burne MJ, Daniels F, . Small molecule selectin ligand inhibition improves outcome in ischemic acute renal failure. Kidney Int. 2001;60:2205–2214.
- Ysebaert DK, De Greef KE, Vercauteren SR, . Identification and kinetics of leukocytes after severe ischemia/reperfusion renal injury. Nephrol Dial Transplant. 2000;15:1562–1574.
- Rabb H, Mendiola CC, Dietz J, . Role of CD11a and CD11b in ischemic acute renal failure in rats. Am J Physiol. 1994;267:F1052–F1058.
- Lameire N. The pathophysiology of acute renal failure. Crit Care Clin. 2005;21:197–210.
- Moon JA, Kim HT, Cho IS, Sheen YY, Kim DK. IN-1130, a novel transforming growth factor-beta type I receptor kinase (ALK5) inhibitor, suppresses renal fibrosis in obstructive nephropathy. Kidney Int. 2006;70:1234–1243.
- Tomita M, Sogabe H, Nakazato S, . Monoclonal antibody 1-22-3-induced glomerulonephritis in uninephrectomized rats as a model of progressive renal failure. Nephrol Dial Transplant. 2005;20:2358–2367.
- Yang N, Wu LL, Nikolic-Paterson DJ, . Local macrophage and myofibroblast proliferation in progressive renal injury in the rat remnant kidney. Nephrol Dial Transplant. 1998;13: 1967–1974.
- Rabb H, O’Meara YM, Maderna P, Coleman P, Brady HR. Leukocytes, cell adhesion molecules and ischemic acute renal failure. Kidney Int. 1997;51:1463–1468.
- Grigoryev DN, Liu M, Hassoun HT, . The local and systemic inflammatory transcriptome after acute kidney injury. J Am Soc Nephrol. 2008;19:547–558.
- Shimoda N, Fukazawa N, Nonomura K, Fairchild RL. Cathepsin g is required for sustained inflammation and tissue injury after reperfusion of ischemic kidneys. Am J Pathol. 2007;170:930–940.
- Schrier RW, Wang W, Poole B, Mitra A. Acute renal failure: definitions, diagnosis, pathogenesis, and therapy. J Clin Invest. 2004;114:5–14.
- Daemen MA, van ‘t Veer C, Denecker G, . Inhibition of apoptosis induced by ischemia-reperfusion prevents inflammation. J Clin Invest. 1999;104(5):541–549.