Abstract
Injectable vitamin D agents are commonly used to manage secondary hyperparathyroidism in dialysis patients. Yet, there are few data documenting the trends and geographic variations in the use of these agents in large, representative samples. We sought to describe patterns and variations in the use of vitamin D formulations (calcitriol, paricalcitol, and doxercalciferol) in hemodialysis patients. We studied patients in the United States Renal Data System between January1999 and December 2008 with Medicare as a primary payer. Annual percentages of patients treated with each type of formulation were tabulated by race, sex, and age at dialysis initiation. The geographical distribution of vitamin D dose per patient was mapped at the state level. Intravenous vitamin D use has increased sharply from 1999 to 2008 with 83.9% of patients treated with any vitamin D formulation in 2008. The use of calcitriol has declined since 1999, going from being administered in 58.6% of patients in 1999 to 1.8% in 2008. Paricalcitol was found to be the overwhelmingly preferred formulation during the study years. In 2008, the average dose among black patients was 84% greater than among white patients (136 mcg vs. 73.6 mcg). Higher doses of vitamin D were administered to patients in the southern region of the country. Vitamin D use has increased and parallels the rise in use of paricalcitol and doxercalciferol. Given the variations in use and known pharmacologic differences in vitamin D formulations, future research should focus on whether the formulations differentially affect patient outcomes.
INTRODUCTION
Secondary hyperparathyroidism (SHPT), characterized by elevated parathyroid hormone (PTH) levels, is a common complication found in hemodialysis patients.Citation1 SHPT-induced changes in bone histology coupled with increased serum phosphorous and calcium levels have all been implicated as factors partially responsible for the increased morbidity and mortality observed in hemodialysis patients in comparison with individuals in the general population.Citation2 The suppression of PTH levels through activated vitamin D therapy has been central to the treatment of SHPT in the dialysis population.Citation1 Vitamin D therapy helps to maintain appropriate mineral metabolism, prevents bone disease, and minimizes loss of bone strength and fractures.Citation3 Additionally, treatments for SHPT aim to prevent the numerous extra skeletal complications that may be associated with the high cardiovascular morbidity observed in end-stage renal disease (ESRD).
Currently, there are three commonly prescribed intravenous (IV) vitamin D therapies: calcitriol (1α,25-dihydroxyvitamin D3; Calcijex, Abbott Laboratories, North Chicago, IL, USA), paricalcitol (19-nor-1α,25-dihydroxyvitamin D2; Zemplar, Abbott Laboratories), and doxercalciferol (1α-hydroxyvitamin D2; Hectorol, Genzyme, Cambridge, MA, USA). There have been several studies describing patient-level predictors of vitamin D use in the dialysis population.Citation4,5 These studies have found that dialysis patients who administered vitamin D were generally younger, were more likely to be black, and were more likely to have a fistula or graft.Citation6 However, to date, studies reporting temporal trends in the use of IV vitamin D formulations have been conducted using small sample sizes, and none has graphically depicted geographic patterns of vitamin D use.Citation7
In this study, we address this gap in the literature. Using data on US hemodialysis patients in Medicare’s ESRD program between 1 January 1999 and 31 December 2008, we report patterns in IV vitamin D dosing and formulation choice over time and across geographic regions.
MATERIALS AND METHODS
Data Source
Data were extracted from the United States Renal Data System (USRDS). The USRDS contains detailed demographic and treatment information including the date of dialysis initiation for all patients beginning renal replacement therapy. All Medicare Part A and B claims were also included within the USRDS data set, including diagnosis and procedure codes for inpatient and outpatient visits.
Study Design and Patient Population
The study cohort consisted of prevalent hemodialysis patients of all ages between 1 January 1999 and 31 December 2008. Patients were required to have Medicare as a primary payer for the duration of the follow-up period. Patients were eligible if hemodialysis was their initial mode of renal replacement therapy, and no adjustments were made to account for any later switches in treatment modality.
Patterns of Vitamin D Use Assessment
Medicare Part A outpatient revenue files were used to identify IV vitamin D administered to hemodialysis patients. Healthcare Common Procedure Coding System (HCPCS) J-codes were used to identify vitamin D claims. Calcitriol use was identified using HCPCS codes J0635 (1 mcg) and J0636 (0.1 mcg). The codes J2500 (5 mcg) and J2501 (1 mcg) were used to identify paricalcitol use, and the code J1270 (1 mcg) was used to identify doxercalciferol use.
The mean annual vitamin D dose of each formulation per patient was computed for all study years for all patients and by race. A patient was defined as a vitamin D user during each study year if they were administered any dose of any of the three formulations. Variations in IV vitamin D use were assessed according to the annual percentage of patients treated with any vitamin D formulation by race, sex, and age at dialysis initiation (<18, 18–34, 35–44, 45–54, 55–64, and ≥65 years). Race was classified as “white” or “black.”
To obtain the total and mean annual doses of vitamin D administered to each patient, annual doses of paricalcitol and doxercalciferol administered to each patient were converted to calcitriol-equivalent doses according to conversion ratios derived by St. Peter and colleagues (4.6:1 for paricalcitol:calcitriol and 3.1:1 for doxercalciferol:calcitriol).Citation8 Since the administration of vitamin D to hemodialysis patients may not be accurately captured during hospital stays, annual vitamin D doses during the total number of outpatient days during the year were tabulated. The number of hospitalization days per year per patient remained constant from 1999 to 2008; therefore, restricting our exposure period to only outpatient days should not impact our results.
All statistical analyses were performed using SAS version 9.2 (SAS Institute, Inc., Cary, NC, USA). Descriptive statistics were used to tabulate mean annual doses of vitamin D and the percentage of vitamin D users per year overall and by subgroup. Geographical trends in vitamin D were described using the SAS PROC GMAP option to depict the mean vitamin D dose administered per patient at the state level. The PROC GMAP feature allows SAS users to graph two- or three-dimensional color maps by combining map and response data.Citation9 Geographical trends were presented among the whole eligible patient population of blacks and whites and also among only black patients to elucidate any racial influences on geographical variations in annual vitamin D dose per patient. Ordinary least squares (OLS) regression was used to assess the predictors of annual vitamin D dose per patient in 2008. Logistic regression analysis was used to assess the predictors of vitamin D use in 2008. Age, sex, race, and cause of ESRD were adjusted for as potential confounders in both models. The following comorbidities were included in the models as dichotomous variables: coronary artery disease, congestive heart failure, cerebrovascular accident/transient ischemic attack, peripheral vascular disease, other cardiac disease, liver disease, chronic obstructive pulmonary disease, gastrointestinal tract bleeding, dysrhythmia, cancer, and diabetes mellitus.
This study was exempt from review by the University of North Carolina at Chapel Hill Institutional Review Board.
RESULTS
describes the baseline characteristics of the prevalent hemodialysis cohort in years 1999–2008. The study population consisted of 225,022 patients in 1999 and 315,608 patients in 2008. The mean patient age was consistently 59 years old (SD = 17) throughout the 10-year study period. There were 52.0% of males in 1999, increasing to 54.3% in 2008. The percentage of white and black patients remained consistent during the 10-year study period at approximately 57% and 37%, respectively. Diabetes as the primary cause of renal failure increased from 41.1% of the study population in 1999 to 44.7% in 2008, whereas glomerulonephritis as the primary cause of renal failure decreased from 14.1% of patients to 11.4%. Approximately 29% of all patients reported hypertension as the primary cause of renal failure in all study years.
Table 1. Baseline characteristics of patients between 1999 and 2008.
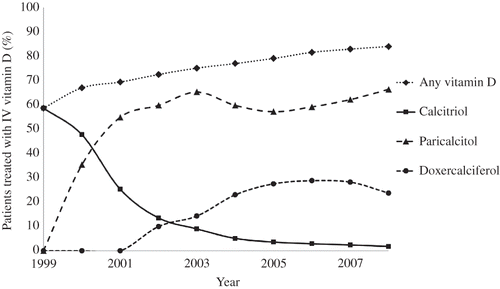
depicts the annual percentage of patients treated with each vitamin D formulation from January 1999 to December 2008. IV vitamin D use has increased sharply from 1999 to 2008 with 58.6% of patients treated with any vitamin D formulation in 1999 to approximately 84% treated with any vitamin D formulation in 2008. The use of calcitriol has declined since 1999, going from being administered to 58.6% of patients in 1999 to 1.8% in 2008. Paricalcitol was the overwhelmingly preferred formulation. Between 2000 and 2008, the annual percentage of patients administered paricalcitol increased from 35.6% to 66.3%. Paricalcitol use peaked at 65.2% of patients in 2003, declined slightly to 59.7% of patients, then again increased to 66.3% in 2008. Doxercalciferol use in the hemodialysis cohort began in 2002 with 10% of patients administered the drug, steadily increased to a peak of 28.8% of patients treated with doxercalciferol in 2006, and has begun to slightly decline to 23.7% of patients treated in 2008.
Figure 1. Annual percentage of patients treated with IV vitamin D by formulation.
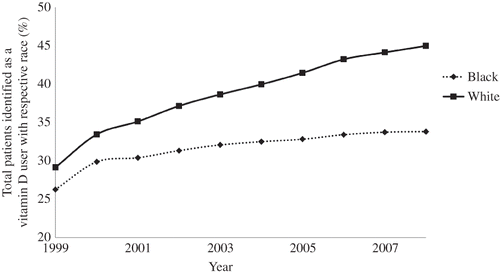
The annual percentage of patients treated with vitamin D by race is presented in . In 1999, approximately 26% of the total patient population was black vitamin D users, whereas 29% was white vitamin D users. Both the percentage of white and black vitamin D users increased steadily from 1999 to 2008. Approximately 34% of the prevalent patient population was black vitamin D users in 2008 and the percentage of white vitamin D users increased to 45%.
Figure 2. Annual percentage of vitamin D users by race.
Racial variations in vitamin D dose are shown in . In 1999, when calcitriol was the only IV formulation administered, white patients received an average dose of 47.7 mcg, whereas black patients received approximately 46% more vitamin D at an average dose of 70 mcg. Black patients were administered nearly twice as much vitamin D than white patients annually between 2000 and 2006. In 2007, black patients received 88% more vitamin D than white patients (average dose, 129.7 mcg for blacks vs. 69.l mcg for whites), and in 2008, black patients received 84% more vitamin D than white patients (average dose, 136 mcg for blacks vs. 73.6 mcg for whites).
Table 2. Mean annual IV vitamin D dose (mcg) administered per patient by race.
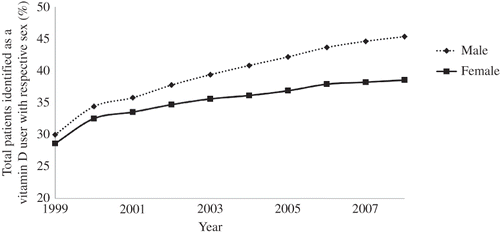
depicts the annual percentage of patients administered vitamin D by sex. In 1999, approximately 30% of all patients were male vitamin D users, and in 2008, about 45% of all patients were male vitamin D users.
Figure 3. Annual percentage of vitamin D users by sex.
Approximately 1% of all patients were vitamin D users under 18 years old and this remained constant between 1999 and 2008. Approximately 5% and 7% of all patients were between 18 and 34 years old in 1999 and 2008, respectively. Approximately 12% of patients were vitamin D users between 55 and 64 years old in 1999 and increased to 18% in 2008, whereas approximately 25% of patients were vitamin D users at least 65 years old in 1999, increasing to 33% in 2008.
Annual trends in the mean dose administered of each vitamin D formulation among the users of that respective formulation are listed in . The average annual calcitriol dose per calcitriol user has declined over the past decade, reflecting the decreased administration of the formulation. In 1999, on average, 94.9 mcg (SD = 3458) of calcitriol was administered per calcitriol user. In 2008, the average calcitriol dose per calcitriol user was 69.8 mcg (SD = 87.6). With regards to paricalcitol, the average annual dose per paricalcitol user increased from 7.97mcg (SD = 4.49) in 1999 to 105 mcg (SD = 118) in 2008. The average annual dose of doxercalciferol per doxercalciferol user also increased steadily from 1999 to 2008.
Table 3. Mean annual IV vitamin D dose (mcg) administered per patient by formulation.
Table 4. Logistic regression model predicting vitamin D use (yes/no) and multiple regression model predicting annual vitamin D dose (mcg) per patient in 2008.
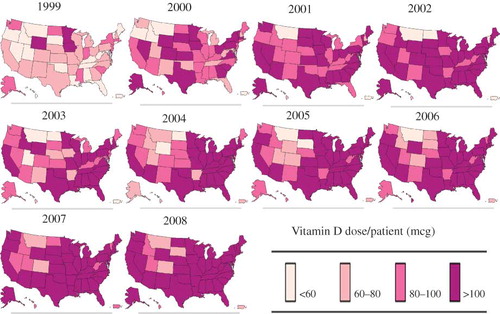
Geographical trends in the average annual dose of vitamin D administered per patient among all eligible patients are depicted in . In 1999, only seven states had a mean annual dose of vitamin D per patient greater than 60 mcg (South Dakota, Minnesota, Iowa, Kentucky, Delaware, Mississippi, and South Carolina) with patients administered the highest vitamin D doses in South Dakota and Kentucky. In contrast, 18 states had an average annual vitamin D dose per patient greater than 60 mcg in 2000 with four of the six states with average doses between 80 mcg and 100 mcg clustered in the south (Louisiana, Mississippi, Alabama, and South Carolina). The highest doses of vitamin D per patient were administered in California, northeast, and southern region of the country in 2002. In 2002, Delaware, South Carolina, Mississippi, and Kansas had an average annual vitamin D dose per patient greater than 100 mcg. In 2008, 14 states had a mean yearly vitamin D dose per patient greater than 100 mcg (Connecticut, New Jersey, Delaware, Maryland, Virginia, North Carolina, South Carolina, Tennessee, Georgia, Alabama, Mississippi, Louisiana, Texas, and Illinois). depicts geographical trends in the average annual vitamin D dose per patient among only black patients. When the population was restricted to only black patients, in 2008, only five states (Idaho, Montana, Utah, Colorado, and South Dakota) had an average annual vitamin D dose per patient less than 100 mcg.
Figure 4. Annual vitamin D dose per patient by state among both white and black patients (1999–2008).
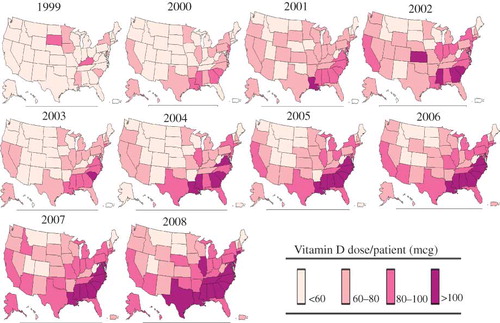
Figure 5. Annual vitamin D dose per patient by state among only black patients (1999–2008).
Results from a multivariable logistic regression model predicting vitamin D use (yes/no) and a multiple regression model predicting annual vitamin D dose (mcg) per patient in 2008 are shown in . For black patients, the odds of being administered vitamin D are 2.38 times greater than the odds for white patients being administered vitamin D. Male sex, black race, and increasing vintage were associated with a significant increase in annual vitamin D dose per patient.
DISCUSSION
This study investigated secular trends and variations in the administration of specific vitamin D analogs in hemodialysis patients. The data suggest that there have been a substantial increase in the use of vitamin D among hemodialysis patients in the United States between 1999 and 2008. As of 2008, approximately 84% of the USRDS population used IV vitamin D. With regards to formulation-specific patterns of utilization, calcitriol use has declined sharply since 1999. In contrast, paricalcitol was the most frequently administered formulation in the United States with 66.3% of patients treated with the analog in 2008. Doxercalciferol use declined steadily since its peak usage of 28.8% of patients in 2006.
The study presented herein is unique in its use of a relatively large population of over 300,000 patients in the most recent years of available data until 2008. It should be noted that the Dialysis Outcomes and Practice Patterns Study (DOPPS), a prospective cohort study of hemodialysis patients in 19 countries, released recent data regarding trends in IV vitamin D formulation use and dose in the United States.Citation7 Unlike this study, however, DOPPS investigators based their observations on a relatively small sample of less than 4000 US dialysis patients. Consistent with the results of this study, the DOPPS study reported that in August 2010, 85.3% of the sample used only paricalcitol, 13.6% used only doxercalciferol, and 1.0% used only calcitriol. However, in December 2011, the percentage of patients using only paricalcitol decreased to 55.5%, doxercalciferol users increased to 44.2%, and calcitriol users was 0.1%.
Clinical differences between the three formulations may explain the changes over time in IV vitamin D formulation choice. The first available vitamin D analog, calcitriol, can effectively lower serum PTH levels.Citation10 However, calcitriol administered in dialysis patients has been associated with elevated serum calcium and phosphorous concentrations.Citation11 The risk of hypercalcemia may increase when calcitriol is used simultaneously with calcium-based phosphorous binders or dialysate with high calcium concentrations.Citation10 The vitamin D2 analogs, paricalcitol and doxercalciferol, are also considered as mainstream therapy among dialysis patients.Citation10 Both vitamin D2 analogs, like calcitriol, can effectively lower PTH levels but with a smaller effect on serum calcium and phosphorous concentrations compared to calcitriol.Citation10 Several studies have demonstrated equivalent or even superior PTH level suppression with the use of either paricalcitol or doxercalciferol compared to calcitriol.Citation12
The preponderance of paricalcitol use within the hemodialysis population as demonstrated by the data, however, does not decrease the need to explore the comparative effectiveness of IV vitamin D agents. A meta-analysis of randomized controlled trials of chronic kidney disease patients demonstrated both potentially beneficial and detrimental effects of vitamin D compounds such as paricalcitol and doxercalciferol introduced into the market after calcitriol. Paricalcitol and doxercalciferol vitamin D compounds were shown to significantly reduce PTH levels by about 11 pmol/L but they also simultaneously increase phosphorous levels.Citation12 Reduced PTH levels may correspond to a decrease in patient mortality risk by approximately 5% to 10% over a 3-year span but the increase in phosphorous concentrations may increase mortality by an equivalent amount.Citation12
The most striking differences in vitamin D use were found in comparisons of annual vitamin D dose per patient between black and white patients. Although the percentage of black patients receiving vitamin D was less than the percentage of white patients over the past decade, black patients have continued to receive nearly twice as much of the drug in comparison with whites. This greater use is possibly a result of pervasive vitamin D deficiency associated with individuals with darker pigmented skin. In the general population, 90% of Mexican-Americans and nearly all non-Hispanic blacks (97%) currently suffer from vitamin D deficiency.Citation13 Additionally, black hemodialysis patients generally have higher intact PTH levels in comparison with other races.Citation14 Gupta and colleagues reported an average PTH level of 641.7 in black and 346.0 in white dialysis patients.Citation15 Therefore, the greater severity of SHPT among black patients may be associated with the greater vitamin D dose administered to these individuals in comparison with white patients.
Our findings are consistent with the finding by Kalantar-Zadeh and colleagues demonstrating that African-Americans had twice the odds of receiving a higher dose of paricalcitol (>10 mcg/week) than other races in a study of ESRD patients in a large dialysis organization.Citation16 In addition, the greater administration of IV vitamin D to black dialysis patients is reflected in cost figures from the 2011 USRDS Annual Data Report. In 2008, IV vitamin D costs were 78% greater for black patients compared to white patients within the prevalent dialysis population with vitamin D costs reaching $1,824 per patient per year for blacks.Citation17
Moreover, since 1999, higher doses of vitamin D per patient were found in the southern region of the United States in states such as Mississippi, Louisiana, and Alabama. St. Peter and colleagues have also reported geographic variations in injectable drug use among the dialysis population.Citation18 For instance, the authors found the greatest use of IV iron in Alaska and eastern Texas, whereas the lowest percentages of IV iron were found in the central region of the country.Citation18 Patient-, facility-, and policy-level factors contributing to the geographic differences in injectable drug administration to hemodialysis patients merit further investigation. More research is needed to investigate how the greater administration of vitamin D doses to black patients or individuals with higher body mass indexes impacts the observed regional differences in vitamin D administration.
The study has important limitations. Since Medicare Part A data within the USRDS are collected primarily for administrative purposes, we cannot know whether the amount of vitamin D dose billed actually reflects the amount of vitamin D received for each patient. The dosage reflected in vials billed for a particular formulation may not accurately capture partial doses administered. In addition, administration of vitamin D is guided primarily by patient serum PTH levels, a variable not available in the USRDS. Our multivariable analyses assessing predictors of vitamin D use and annual vitamin D dose per patient were likely highly confounded, given that we did not have access to PTH levels.
Our data suggest that the frequency and doses of vitamin D are increasing. Patterns of prevalent vitamin D use at different times over a decade show that while use of vitamin D in general has increased, both calcitriol use and doxercalciferol use have decreased while paricalcitol emerged, at least temporarily, as the dominant formulation. Recent controversy regarding the therapeutic effects of vitamin D in ESRD has sparked interest in the comparative effectiveness and safety of vitamin D formulations. Given the increase in dose and variation in use of these formulations, more research is needed to investigate the comparative differences in patient health outcomes resulting from the use of paricalcitol versus doxercalciferol versus calcitriol.
ACKNOWLEDGMENTS
The data reported here have been supplied by the United States Renal Data System (USRDS). The interpretation and reporting of these data are the responsibility of the authors and in no way should be seen as an official policy or interpretation of the US government.
Declaration of interest: Dr. Brookhart has received grant support from Amgen and has served on advisory boards for Pfizer, Amgen, and Rockwell Medical (honoraria declined, given to institution, or donated). He has received consulting fees from DaVita, Foundation for the National Institutes of Health, and World Health Information Consultants. Ms. Beaubrun serves as a research coordinator for Advance Health Solutions, LLC.
This research was partially supported by a National Research Service Award Pre-Doctoral Traineeship from the Agency for HealthCare Research and Quality sponsored by the Cecil G. Sheps Center for Health Services Research, University of North Carolina at Chapel Hill, Grant No. T32-HS000032.
Related Research Data
REFERENCES
- Khan S. Vitamin D deficiency and secondary hyperparathyroidism among patients with chronic kidney disease. Am J Med Sci. 2007;333(4):201–207.
- Dennis VC, Albertson GL. Doxercalciferol treatment of secondary hyperparathyroidism. Ann Pharmacother. 2006;40(11):1955–1965.
- Martin KJ, González EA. Vitamin D analogues for the management of secondary hyperparathyroidism. Am J Kidney Dis. 2001;38(5):S34–S40.
- Dobrez DG, Mathes A, Amdahl M, Marx SE, Melnick JZ, Sprague SM. Paricalcitol-treated patients experience improved hospitalization outcomes compared with calcitriol-treated patients in real-world clinical settings. Nephrol Dial Transplant. 2004;19(5):1174–1181.
- Teng M, Wolf M, Lowrie E, Ofsthun N, Lazarus JM, Thadhani R. Survival of patients undergoing hemodialysis with paricalcitol or calcitriol therapy. N Engl J Med. 2003;349(5):446–456.
- Tentori F, Albert JM, Young EW, . The survival advantage for hemodialysis patients taking vitamin D is questioned: findings from the Dialysis Outcomes and Practice Patterns Study. Nephrol Dial Transplant. 2009;24(3):963–972.
- DOPPS. DOPPS practice monitor. Available at: http://www.dopps.org/DPM/. Accessed May 10, 2012.
- St. Peter W, Li S, Liu J, Gilbertson D, Arneson T, Collins A. Effects of monthly dose and regular dosing of intravenous active vitamin D use on mortality among patients undergoing hemodialysis. Pharmacotherapy. 2009;29(2):154–164.
- Massengill D. Tips and tricks III: more unique SAS/GRAPH® maps. SAS Institute. Available at: http://support.sas.com/rnd/papers/sugi30/sasmapping3.pdf. Accessed October 5, 2011.
- Tentori F, Hunt WC, Stidley CA, . Mortality risk among hemodialysis patients receiving different vitamin D analogs. Kidney Int. 2006;70(10):1858–1865.
- Kalantar-Zadeh K, Kovesdy CP. Clinical outcomes with active versus nutritional vitamin D compounds in chronic kidney disease. Clin J Am Soc Nephrol. 2009;4(9):1529–1539.
- Palmer SC, McGregor DO, Macaskill P, Craig JC, Elder GJ, Strippoli GF. Meta-analysis: vitamin D compounds in chronic kidney disease. Ann Intern Med. 2007;147(12):840–853.
- Ginde AA, Liu MC, Camargo CA. Demographic differences and trends of vitamin D insufficiency in the US population, 1988–2004. Arch Intern Med. 2009;169(6):626–632.
- Owda A, Elhwairis H, Narra S, Towery H, Osama S. Secondary hyperparathyroidism in chronic hemodialysis patients: prevalence and race. Ren Fail. 2003;25(4):595–602.
- Gupta A, Kallenbach LR, Zasuwa G, Divine GW. Race is a major determinant of secondary hyperparathyroidism in uremic patients. J Am Soc Nephrol. 2000;11(2):330–334.
- Kalantar-Zadeh K, Miller JE, Kovesdy CP, . Impact of race on hyperparathyroidism, mineral disarrays, administered vitamin D and survival in hemodialysis patients. J Bone Miner Res. 2010;25(12):2724–2734.
- U.S. Renal Data System. USRDS 2011 Annual Data Report: Atlas of Chronic Kidney Disease and End-Stage Renal Disease in the United States. Bethesda, MD: National Institutes of Health, National Institute of Diabetes and Digestive and Kidney Diseases; 2011.
- St. Peter WL, Obrador GT, Roberts TL, Collins AJ. Trends in intravenous iron use among dialysis patients in the United States (1994–2002). Am J Kidney Dis. 2005;46(4):650–660.