Abstract
The assessment of glomerular filtration rate (GFR) in patients with liver disease is necessary to make decisions about organ allocation. Creatinine is widely used as a marker of GFR; however, it is not reliable in patients with liver disease. The aims of this study were to (1) determine if iodine 125-labeled iothalamate (125I-iothalamate) clearance calculated using the plasma decay method is equal to renal clearance of 125I-iothalamate and (2) estimate kidney function using the creatinine-based Cockcroft–Gault and the Modification of Diet in Renal Disease equations, a cystatin C-based equation, the urine collection method for creatinine clearance, and plasma clearance of vancomycin (V) and compare these estimates to renal clearance of 125I-iothalamate in adult patients with liver disease. Adults with liver disease received 125I-iothalamate and V and had a catheter placed for urine collection. Blood and urine samples were collected over 8 h for analysis of 125I-iothalamate, creatinine, and V to determine kidney function. Estimates were compared to renal 125I-iothalamate clearance. Eight patients classified as Child–Pugh class B were enrolled: age was 52 ± 6 years; body mass index was 36.5 ± 19 kg/m2; and Model for End-Stage Liver Disease score was 13 ± 3. Mean estimates of kidney function did not differ significantly from mean renal 125I-iothalamate clearance (74 ± 38 mL/min/1.73 m2). Other methods overestimated kidney function at lower levels of GFR (<60 mL/min/1.73 m2) and underestimated kidney function at higher GFR levels. Given the variability in performance of methods to assess kidney function in this population, direct measurement of GFR may be preferable to indirect estimates based on marker compounds such as creatinine and cystatin C until more accurate methods are developed.
INTRODUCTION
Concomitant kidney dysfunction is common in patients with liver disease and is associated with poor outcomes following liver transplantation.Citation1,2 Adequate assessment of kidney function is necessary to prevent progression of kidney disease, address secondary complications, appropriate dose medications, and is beneficial in the process of organ allocation and decisions regarding combined liver and kidney transplantation (CLKT). The Model for End-Stage Liver Disease (MELD) incorporates serum creatinine (SCr) and gives higher priority for transplantation to individuals with more severe kidney dysfunction, an effect that has led to an increased number of CLKTs since implementation of the MELD.Citation3 With limited organ availability, the use of the MELD alone to prioritize CLKT has been questioned and prompted some transplant centers to evaluate other methods, including the measurement of glomerular filtration rate (GFR).Citation4
GFR can be quantified by a direct measurement or estimated using assessment equations. The gold-standard method is to measure clearance of a substance exclusively filtered, such as inulin or the radiolabeled markers iodine 125-labeled iothalamate (125I-iothalamate) and chromium 51-labeled ethylenediaminetetraacetic acid (EDTA) (51Cr-EDTA); however, this method requires labor-intensive procedures not often feasible in clinical practice. In addition, 125I-iothalamate and 51Cr-EDTA clearance values measured using the plasma decay method have been shown to overestimate GFR in patients with liver disease and concomitant ascites or edema due to extrarenal clearance of the exogenous markers.Citation5,6 For this reason, renal clearance of these markers may be more reliable as an index of kidney function.
Noninvasive methods to assess kidney function include a 24-h urine collection to measure creatinine clearance (CLCr), a surrogate for GFR, and estimating equations; the Cockcroft–Gault (CG) and the Modification of Diet in Renal Disease (MDRD) equations.Citation7,8 Both the CG and MDRD equations require measurement of SCr, a metabolic by-product of muscle metabolism that is derived from creatine and phosphocreatine. Creatinine is widely used as a marker of GFR, since it is primarily filtered by the kidneys; however, it is affected by age, weight, muscle mass, race, and certain medications, that make it unreliable as the sole means to estimate kidney function.Citation9 Creatinine is also a product of creatine which is produced by the liver. Patients with liver disease often have normal or even low SCr concentrations, even though they may have substantial reductions in GFR.Citation10 Estimating equations that incorporate SCr overestimate GFR in patients with liver disease by as much as 200%.Citation6,11–16 In the case of overestimation of GFR, a patient with compromised kidney function who would meet criteria for a CLKT may not be considered based on the false assessment of kidney function.
The importance of assessing kidney function in patients with liver disease highlights the need to identify accurate and clinically feasible methods for GFR estimation in this population. An alternative marker proposed to assess GFR is cystatin C, a low molecular weight protein produced at a stable rate by most nucleated cells that is exclusively filtered by the kidney, but not secreted or reabsorbed (reference range in adults is 0.51–1.02 mg/L).Citation17 The sum of information available to date on cystatin C-based assessment equations in patients with liver disease provides reasonable evidence in support of its use as a marker of GFR, but additional studies are needed to support regular use in clinical practice.Citation18–23 The characteristics of vancomycin (V) also make it a reasonable candidate to consider as a marker of kidney function. V is a tricyclic glycopeptide antibiotic commonly used in hospitalized patients with liver disease and often requires measurement of serum concentrations to evaluate therapy. Renal clearance approximates up to 80% of simultaneously determined 125I-iothalamate clearance, indicating that glomerular filtration is the primary route of renal elimination.Citation24,25
The aims of this study were to (1) determine if 125I-iothalamate clearance calculated using the plasma decay method is equal to renal clearance of 125I-iothalamate and (2) estimate kidney function using the creatinine-based CG and MDRD equations, the cystatin C-based Hoek equation,Citation22 the urine collection method for CLCr, and the plasma clearance of V and compare these estimates to GFR determined using renal clearance of 125I-iothalamate in adult patients with liver disease.
SUBJECTS AND METHODS
Patient Recruitment and Pre-study Procedures
This study was designed in accordance with the Declaration of Helsinki and approved by the Methodist University Hospital and the University of Tennessee Institutional Review Boards. Adult patients (age 21–65 years) from an outpatient hepatology clinic with a diagnosis of chronic liver disease were evaluated. Eligible patients were classified as Child–Pugh class B (score of 7–9) or C (score of 10–15), receiving a stable diuretic dose (defined as receiving a consistent medication and dose for the 2 weeks preceding enrollment), able to make at least 1 L of urine per day, and had no acute illness (e.g., fever, infection, hypotension, and acute kidney injury). Patients were excluded if they were taking agents known to interfere with tubular secretion of creatinine (e.g., cimetidine); had known hypersensitivity to V, radiolabeled iothalamate, or iodine; had a serum sodium of less than 130 mEq/L; a diagnosis of thyroid disorders; Class III or IV congestive heart failure; or if they were pregnant. After giving informed consent, patients were scheduled for study procedures at the University of Tennessee General Clinical Research Center (GCRC). Demographic and medical information collected included age, race, gender, Child–Pugh score, the cause of liver disease, concomitant medications, and comorbid conditions. MELD scores were determined for each patient with a minimum SCr and bilirubin of 1.0 mg/dL used in this calculation.Citation26 Patients were also instructed not to ingest protein-containing foods within 12 h of the scheduled study procedures to avoid any effect of protein load on measured GFR.
Study Procedures
Upon admission to the GCRC, weight, height, and vitals were recorded and the extent of ascites and edema was assessed by a hepatologist and characterized according to the Child–Pugh score. Two intravenous (IV) catheters were inserted, one in each arm, for the purpose of blood collection and intravenous administration of marker compounds. All patients had a Foley catheter inserted for urine collection. Blood was collected at baseline for measurement of SCr, blood urea nitrogen (BUN), serum sodium, glucose, albumin (Alb), cystatin C, liver function tests (LFTs), international normalized ratio (INR), and bilirubin. Study procedures were conducted over an 8-h period.
At the start of the timed procedures, 100 μCi of sodium iothalamate I-125 (Glofil®-125; QOL Medical, Kirkland, WA, USA) and 1 g of V were infused intravenously.Citation27 The 1 g dose of V was infused over the first 1 h. The 100 μCi dose of iothalamate was diluted in 90 mL of isotonic sodium chloride and administered as a continuous infusion at a rate of 0.5 mL/min over 3 h. This prolonged infusion time allowed for equilibration of iothalamate between the plasma and any ascitic fluid. Immediately following the infusion, a 1-h equilibration period was initiated to further allow for equilibration of the administered agents between the plasma and ascitic fluid. Patients were required to move at regular intervals during this time. At 2 h from the start of the timed procedures, dextrose 5% in water (D5W) was infused at 750 mL/h for 1 h, then at 250 mL/h for the next 4 h to provide a “water load” for urine collection procedures.
Blood and Urine Sampling
Blood samples were drawn at time 0 (defined as the time of the iothalamate infusion), 5, 15, 30, 45, and 60 min and every half an hour thereafter for the remainder of the 8-h study period for measurement of radiolabeled iothalamate and V. Urine was collected during 4–8 h of the study for measurement of creatinine and radiolabeled iothalamate during each of the four 1-h collection periods. SCr and radiolabeled iothalamate were measured at the midpoint of each urine collection period. Serum sodium was measured 1 h following all study procedures to assess volume status.
Assay Procedures
Radiolabeled iothalamate in blood samples was counted using an automated multichannel analyzer with a window setting of 15–75 keV. Laboratory analysis of SCr, BUN, serum sodium, glucose, Alb, INR, bilirubin, LFTs, and V was done at a local laboratory. V concentrations were measured by a particle-enhanced turbidimetric inhibition immunoassay. The lower limits of quantification for this assay are 3.5 mg/L. SCr was measured by the Jaffe reaction using the alkaline picrate colorimetric assay. At the time of this study, the SCr assay was not standardized to the isotope dilution mass spectrometer method. Blood samples were sent to the Mayo Clinic for measurement of cystatin C concentrations, since an assay was not available locally at the time of this study. Serum cystatin C was analyzed by latex particle-enhanced immunonephelometry (Dade Behring N Latex Cystatin C assay, Deerfield, IL, USA).Citation28
Calculations
Radiolabeled iothalamate clearance was determined using both the urine collection method (125I-Urine) and the plasma decay method (125I-CL) (). Vancomycin clearance (V-CL), measured creatinine clearance (CLCr Urine), estimates from the four-variable MDRD and the CG equations, and GFR estimated by the cystatin C-based Hoek formulaCitation22 (Cystatin C GFR) were calculated using equations defined in . 125I-Urine and CLCr Urine were reported as the average of four 1-h collection periods. All estimates were expressed as mL/min/1.73 m2.
Table 1. Methods used to assess kidney function.
Statistical Analysis
125I-Urine was compared with other estimates of kidney function using the Wilcoxon signed-rank test for paired comparisons. The agreement between 125I-Urine and other methods was evaluated using Bland–Altman plots with the calculation of agreement limits as bias ± 1SD. Estimates falling within 30% of 125I-Urine were also determined as an indicator of accuracy.Citation29 For all tests, a p < 0.05 was considered as statistically significant. All analyses were performed using Statistical Analysis Software (SAS Institute, Cary, NC, USA).
RESULTS
Enrollment and Study Population
Patient characteristics of the eight patients enrolled in this study are shown in . The study population was predominantly female (5/8; 63%) and white (6/8; 75%) with a mean age of 52 ± 6 years. The mean MELD score and SCr were 13 ± 3 and 1.2 ± 0.4 mg/dL, respectively. All patients were classified as Child–Pugh class B. The mean total body weight (TBW) for the study population was 90 ± 38 kg. Most patients in this study (6/8, 75%) were classified as overweight or obese based on the body mass index (BMI) (mean BMI = 37 ± 19 kg/m2): three were overweight (BMI = 25–30 kg/m2); two were obese (BMI = 30–39 kg/m2); and one was extremely obese (BMI > 40 kg/m2).
Table 2. Patient characteristics.
All patients were on a stable dose of spironolactone with four patients also receiving a stable dose of furosemide. The mean serum sodium levels before and after study procedures were 139 ± 3 mEq/L and 137 ± 5 mEq/L, respectively. The mean cystatin C for the study population was 1.4 ± 0.5 mg/L. No patients in this study had concomitant thyroid disorders or were prescribed glucocorticosteroids, factors that are known to influence cystatin C concentrations.Citation30,31
Estimates of Kidney Function
The measured GFR by 125I-iothalamate clearance and estimates from other surrogate methods are shown for each patient in . The mean estimates did not differ significantly from 125I-Urine. The mean 125I-Urine was 74 ± 38 mL/min/1.73 m2, suggesting these were individuals without concomitant kidney disease based solely on GFR. The notable exceptions are patients #7 and #8 who had measured GFRs by 125I-Urine of 35 mL/min/1.73 m2 and 23 mL/min/1.73 m2, respectively, indicating more significant kidney dysfunction. The mean values for all other estimates of kidney function were similar to 125I-Urine (within the range of 1–6 mL/min/1.73 m2) with the exception of cystatin C-based GFR which underestimated 125I-Urine by 13 mL/min/1.73 m2. In the two patients with more significant kidney dysfunction (patients #7 and #8) and in patient #1, cystatin C GFR overestimated 125I-Urine.
Table 3. Measured GFR and surrogate estimates of kidney function by patient (expressed in mL/min/1.73 m2).
Estimates of kidney function that are not within 30% of 125I-Urine were also identified to provide information on the accuracy of other estimates (). Overestimation of true GFR by more than 30% was more common than underestimation and occurred with the CLCr Urine (2/8 patients), V-CL (2/8 patients), MDRD (2/8 patients), CG (3/8 patients), and cystatin C GFR (1/8 patients). Underestimation of GFR by more than 30% was also observed with V-CL, MDRD, and cystatin C methods (1/8 patients for each method).
The mean V-CL was 70 ± 30 mL/min/1.73 m2; however, it should be noted that there was one outlier. Patient #4 had a V-CL 53% below 125I-Urine. Of note, this individual was severely obese [BMI = 60 kg/m2; body surface area (BSA) = 2.86 m2] and normalizing V-CL for BSA (i.e., multiplying V-CL by 1.73/BSA) lowered the V-CL of 40 mL/min to 25 mL/min/1.73 m2. The mean V-CL excluding this patient’s data is 76 ± 25 mL/min/1.73 m2.
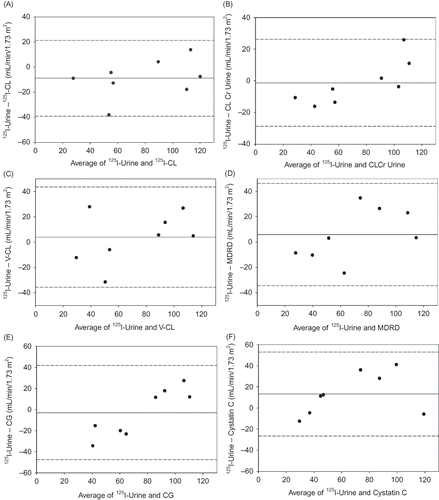
The box plot in shows the variability in the differences between 125I-Urine and other methods. 125I-CL and CLCr Urine provided more accurate estimates of 125I-Urine as noted by the narrow interquartile range for these methods. Bland–Altman plots are shown in A–F, where the difference in 125I-Urine and other methods is plotted against their mean value to illustrate the systematic difference (bias) and the scatter of the individual values. These plots show the variability in individual values from the mean bias. A general trend observed for all methods, with the exception of cystatin C and 125I-CL, is that at average levels of kidney function below 60 mL/min/1.73 m2 these methods overestimate GFR.
Figure 1. Box plot of the difference in the mean 125I-Urine and other assessment methods. The line within the box marks the median. Error bars above and below the box indicate the 90th and 10th percentiles.
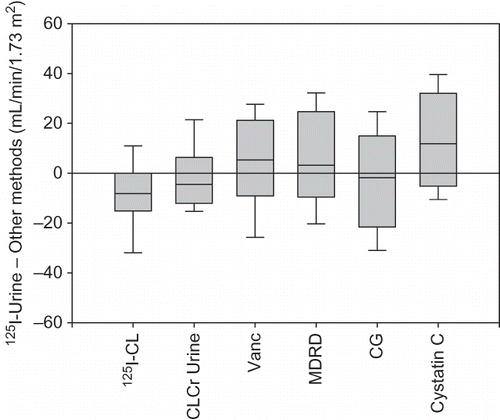
Figure 2. Bland–Altman plots of the relationship between 125I-Urine and (A) 125I-CL; (B) CLCr Urine; (C) V-CL; (D) MDRD; (E) CG-TBW; and (F) Cystatin C. Solid bar indicates the mean difference or bias. Dashed lines indicate the upper and lower limits of the interval of agreement (±1SD).
DISCUSSION
While some studies have reported that 125I-iothalamate clearance calculated using the plasma decay method may overestimate GFR in patients with liver disease, we found no significant difference in 125I-CL and 125I-Urine. Patients in this study did not have significant ascites, however, which may be a reason our findings differ, since there is likely less potential for extrarenal clearance in patients without substantial edema.
Our results do indicate that methods to assess kidney function in the population with liver disease provide estimates similar to measured GFR overall; however, the MDRD and CG methods overestimate GFR at lower levels of kidney function (below 60 mL/min/1.73 m2) consistent with previous studies.Citation6,32 Skluzacek et al.Citation6 reported that both the MDRD and CG methods overestimated true GFR as determined by 125I-Urine in patients with Child–Pugh class C and a mean 125I-Urine of 58 ± 5 mL/min/1.73 m2. Gonwa et al.Citation32 found that the performance of the MDRD and CG equations compared to radiolabeled iothalamate clearance also differed depending on the level of kidney function. The MDRD and CG equations overestimated GFR in patients with poor kidney function (GFR < 40 mL/min), but underestimated GFR in individuals with GFRs above 40 mL/min, similar to our findings and those from the original MDRD study (MDRD underestimated GFR at levels above 60 mL/min/1.73 m2).Citation8 Furthermore, only 66% of estimates using the MDRD equation were within 30% of measured GFR.
In this study, the CG equation overestimated 125I-CL by more than 30% in 3/8 patients (patients #4, #7, and #8). Of note, these patients were above the ideal body weight (IBW) by 112 kg (patient #4), 15 kg (patient #7), and 31 kg (patient #8). TBW was used to calculate CLCr using the CG equation and the estimate was then normalized for BSA in order to allow for a direct comparison with other methods expressed in mL/min/1.73 m2. The use of TBW for these individuals as opposed to an IBW or adjusted body weight may have contributed to this more substantial overestimation of GFR. While we chose to normalize CG for the purpose of this study, it is important to note that this is not often done in clinical practice. If we remove the normalization step, the mean CG estimate for this population is 93 ± 23 mL/min, an estimate above 125I-Urine. It is clear that such discrepancies compared to measured GFR have notable clinical implications. For example, the overestimation of GFR could lead to differences in clinical decisions regarding management and evaluation for transplantation. Most patients in this study were classified as overweight or obese based on BMI. It is difficult to accurately determine patient weights for the purposes of evaluating kidney function in patients with ascites as a complication of liver disease, since increases in body weight are also due to excess volume. Clearly, the weight chosen (IBW vs. TBW or an adjusted body weight) and the process of normalization for BSA make a difference in the CG estimates of kidney function. The CLCr Urine method provided accurate estimates of GFR with the majority of values within 30% of 125I-Urine. The controlled study environment and the fact that our patients were catheterized likely made this method more reliable than in typical clinical conditions where difficulties with the urine collection process often result in inaccuracies.
Vancomycin was chosen as a potential marker of kidney function, since this antibiotic is commonly used in patients with liver disease, and the measurement of serum concentrations is routine. Similar to findings from the creatinine-based methods, V-CL did tend to underestimate GFR at higher levels of kidney function and overestimate kidney function in individuals with decreased GFR (below 60 mL/min/1.73 m2). For this reason, it appears that V-CL was not more accurate in evaluating kidney function than current estimating equations.
The utility of cystatin C for estimation of GFR has been evaluated in patients with cirrhosis and found to be more precise than SCr in detecting decreased kidney function in cirrhotic patients.Citation18,19,33 While the mean cystatin C GFR in this study was 13 mL/min/1.73 m2 below 125I-Urine, the majority of estimates were within 30% of the reference GFR.
The notable limitation of this study was the small sample size. The study population was also predominantly overweight or obese (6/8 patients), limiting the potential application of these findings in a nonobese population. Challenges with assessment of kidney function in the obese population, particularly using assessment equations, and lack of consensus on the most appropriate method to adopt in clinical practice have been previously described.Citation34–39 The study population also included patients with relatively normal GFR based on 125I-Urine; i.e., this was not a population with kidney dysfunction in which the MDRD equation has been validated. The CKD Epidemiology Collaboration (CKD-EPI) equation has been validated in a population with GFRs above 60 mL/min/1.73 m2; however, we did not use this equation since at the time of this study a standardized SCr assay had not been implemented at our institution, which is required for use in the CKD-EPI equation.Citation40 All of our patients were also classified as having moderate liver disease (Child–Pugh class B), limiting extrapolation of these results to individuals with more severe liver disease when assessment methods using SCr are more likely affected by the degree of liver dysfunction.Citation12
The use of GFR to assess kidney function has been proposed as a more reliable means of evaluating mortality risk and the need for CLKT in patients with liver disease as opposed to the use of SCr alone in calculating the MELD score.Citation4,41,42 While this approach may be reasonable, the variable performance of the MDRD, CG, and cystatin C-based methods calls into question the adoption of estimating equations for the purpose of determining GFR to make such important decisions regarding transplantation. There is also a concern that inaccurate assessment of GFR will lead to inappropriate dosing of medications that are renally eliminated and increase the potential for adverse drug events. Whether changes in the evaluation process are needed for the liver transplant population as a whole remains a question, but it is clear that problems exist with current methods to assess kidney function in this population. In the population with liver disease, direct measurement of GFR, although cumbersome, is preferable to indirect estimates based on marker compounds such as creatinine and cystatin-C until more accurate methods are developed. This may be especially true for overweight or obese individuals. While this requires bringing patients into a more controlled environment to allow for such measurements to be performed, the potential advantages of more accurate assessment of kidney function may warrant this approach.
ACKNOWLEDGMENT
We acknowledge the staff at the University of Tennessee Health Science Center, GCRC, and Methodist University Hospital for their contributions.
Declaration of interest: The authors report no conflicts of interest. The authors alone are responsible for the content and writing of the paper.
This study was funded by the GCRC at the University of TN Health Science Center.
REFERENCES
- Gonwa TA, McBride MA, Anderson K, Mai ML, Wadei H, Ahsan N. Continued influence of preoperative renal function on outcome of orthotopic liver transplant (OLTX) in the US: where will MELD lead us? Am J Transplant. 2006;6(11):2651–2659.
- Nair S, Verma S, Thuluvath PJ. Pretransplant renal function predicts survival in patients undergoing orthotopic liver transplantation. Hepatology. 2002;35(5):1179–1185.
- Mehrabi A, Fonouni H, Ayoub E, . A single center experience of combined liver kidney transplantation. Clin Transplant. 2009;23(Suppl. 21):102–114.
- Tanriover B, Mejia A, Weinstein J, . Analysis of kidney function and biopsy results in liver failure patients with renal dysfunction: a new look to combined liver kidney allocation in the post-MELD era. Transplantation. 2008;86(11):1548–1553.
- Henriksen JH, Brochner-Mortensen J, Malchow-Moller A, Schlichting P. Over-estimation of glomerular filtration rate by single injection [51Cr]EDTA plasma clearance determination in patients with ascites. Scand J Clin Lab Invest. 1980;40(3):279–284.
- Skluzacek PA, Szewc RG, Nolan CR, 3rd, Riley DJ, Lee S, Pergola PE. Prediction of GFR in liver transplant candidates. Am J Kidney Dis. 2003;42(6):1169–1176.
- Cockcroft DW, Gault MH. Prediction of creatinine clearance from serum creatinine. Nephron. 1976;16(1):31–41.
- Levey AS, Bosch JP, Lewis JB, Greene T, Rogers N, Roth D. A more accurate method to estimate glomerular filtration rate from serum creatinine: a new prediction equation. Modification of Diet in Renal Disease Study Group. Ann Intern Med. 1999; 130(6):461–470.
- Weber JA, van Zanten AP. Interferences in current methods for measurements of creatinine. Clin Chem. 1991;37(5):695–700.
- Cocchetto DM, Tschanz C, Bjornsson TD. Decreased rate of creatinine production in patients with hepatic disease: implications for estimation of creatinine clearance. Ther Drug Monit. 1983;5(2):161–168.
- Hull JH, Hak LJ, Koch GG, Wargin WA, Chi SL, Mattocks AM. Influence of range of renal function and liver disease on predictability of creatinine clearance. Clin Pharmacol Ther. 1981; 29(4):516–521.
- Orlando R, Floreani M, Padrini R, Palatini P. Evaluation of measured and calculated creatinine clearances as glomerular filtration markers in different stages of liver cirrhosis. Clin Nephrol. 1999;51(6):341–347.
- Sherman DS, Fish DN, Teitelbaum I. Assessing renal function in cirrhotic patients: problems and pitfalls. Am J Kidney Dis. 2003;41(2):269–278.
- MacAulay J, Thompson K, Kiberd BA, Barnes DC, Peltekian KM. Serum creatinine in patients with advanced liver disease is of limited value for identification of moderate renal dysfunction: are the equations for estimating renal function better? Can J Gastroenterol. 2006;20(8):521–526.
- Francoz C, Prie D, Abdelrazek W, . Inaccuracies of creatinine and creatinine-based equations in candidates for liver transplantation with low creatinine: impact on the model for end-stage liver disease score. Liver Transpl. 2010;16(10): 1169–1177.
- Rognant N, Bacchetta J, Dubourg L, . What is the best alternative to inulin clearance to estimate GFR in patients with decompensated alcoholic cirrhosis? Nephrol Dial Transplant. 2010;25(11):3569–3575.
- Randers E, Erlandsen EJ, Pedersen OL, Hasling C, Danielsen H. Serum cystatin C as an endogenous parameter of the renal function in patients with normal to moderately impaired kidney function. Clin Nephrol. 2000;54(3):203–209.
- Gerbes AL, Gulberg V, Bilzer M, Vogeser M. Evaluation of serum cystatin C concentration as a marker of renal function in patients with cirrhosis of the liver. Gut. 2002;50(1):106–110.
- Orlando R, Mussap M, Plebani M, . Diagnostic value of plasma cystatin C as a glomerular filtration marker in decompensated liver cirrhosis. Clin Chem. 2002;48(6 Pt 1):850–858.
- Poge U, Gerhardt T, Stoffel-Wagner B, Klehr HU, Sauerbruch T, Woitas RP. Calculation of glomerular filtration rate based on cystatin C in cirrhotic patients. Nephrol Dial Transplant. 2006;21(3):660–664.
- Xirouchakis E, Marelli L, Cholongitas E, . Comparison of cystatin C and creatinine-based glomerular filtration rate formulas with 51Cr-EDTA clearance in patients with cirrhosis. Clin J Am Soc Nephrol. 2011;6(1):84–92.
- Hoek FJ, Kemperman FA, Krediet RT. A comparison between cystatin C, plasma creatinine and the Cockcroft and Gault formula for the estimation of glomerular filtration rate. Nephrol Dial Transplant. 2003;18(10):2024–2031.
- Larsson A, Malm J, Grubb A, Hansson LO. Calculation of glomerular filtration rate expressed in mL/min from plasma cystatin C values in mg/L. Scand J Clin Lab Invest. 2004;64(1):25–30.
- Matzke GR, McGory RW, Halstenson CE, Keane WF. Pharmacokinetics of vancomycin in patients with various degrees of renal function. Antimicrob Agents Chemother. 1984;25(4):433–437.
- Matzke GR, Zhanel GG, Guay DR. Clinical pharmacokinetics of vancomycin. Clin Pharmacokinet. 1986;11(4):257–282.
- Kamath PS, Wiesner RH, Malinchoc M, . A model to predict survival in patients with end-stage liver disease. Hepatology. 2001; 33(2):464–470.
- Glofil-125. Package Insert. Kirkland, WA: QOL Medical; 2000.
- Erlandsen EJ, Randers E, Kristensen JH. Evaluation of the Dade Behring N Latex Cystatin C assay on the Dade Behring Nephelometer II System. Scand J Clin Lab Invest. 1999; 59(1):1–8.
- National Kidney Foundation. K/DOQI clinical practice guidelines for chronic kidney disease: evaluation, classification, and stratification. Am J Kidney Dis. 2002;39(2 Suppl. 1):S1–S266.
- Wiesli P, Schwegler B, Spinas GA, Schmid C. Serum cystatin C is sensitive to small changes in thyroid function. Clin Chim Acta. 2003;338(1–2):87–90.
- Risch L, Herklotz R, Blumberg A, Huber AR. Effects of glucocorticoid immunosuppression on serum cystatin C concentrations in renal transplant patients. Clin Chem. 2001;47(11):2055–2059.
- Gonwa TA, Jennings L, Mai ML, Stark PC, Levey AS, Klintmalm GB. Estimation of glomerular filtration rates before and after orthotopic liver transplantation: evaluation of current equations. Liver Transpl. 2004;10(2):301–309.
- Woitas RP, Stoffel-Wagner B, Flommersfeld S, . Correlation of serum concentrations of cystatin C and creatinine to inulin clearance in liver cirrhosis. Clin Chem. 2000;46(5):712–715.
- Delanaye P, Radermecker RP, Rorive M, Depas G, Krzesinski JM. Indexing glomerular filtration rate for body surface area in obese patients is misleading: concept and example. Nephrol Dial Transplant. 2005;20(10):2024–2028.
- Demirovic JA, Pai AB, Pai MP. Estimation of creatinine clearance in morbidly obese patients. Am J Health Syst Pharm. 2009;66(7):642–648.
- Hudson JQ, Mason DL, Huch KM. Estimates of kidney function in obese African Americans with chronic kidney disease. Nephron Clin Pract. 2010;118(2):c101–c108.
- Rigalleau V, Chauveau P, Lasseur C, . Indexing glomerular filtration rate for body surface area is useful in obese subjects. Nephrol Dial Transplant. 2006;21(3):821.
- Schuck O, Teplan V, Stollova M, Skibova J. Estimation of glomerular filtration rate in obese patients with chronic renal impairment based on serum cystatin C levels. Clin Nephrol. 2004;62(2):92–96.
- Verhave JC, Fesler P, Ribstein J, du Cailar G, Mimran A. Estimation of renal function in subjects with normal serum creatinine levels: influence of age and body mass index. Am J Kidney Dis. 2005;46(2):233–241.
- Levey AS, Stevens LA, Schmid CH, . A new equation to estimate glomerular filtration rate. Ann Intern Med. 2009; 150(9):604–612.
- Francoz C, Glotz D, Moreau R, Durand F. The evaluation of renal function and disease in patients with cirrhosis. J Hepatol. 2010;52(4):605–613.
- Lim YS, Larson TS, Benson JT, . Serum sodium, renal function, and survival of patients with end-stage liver disease. J Hepatol. 2010;52(4):523–528.