Abstract
This study was designed to evaluate the renoprotective effect of insulin on diabetic nephropathy through Rac1 inhibition. Twenty Wistar rats were divided into three groups: control (C), diabetic (D), and insulin-treated diabetic (D + I). Diabetes was induced by a single streptozotocin (STZ) injection (45 mg/kg i.p.) in adult male rats. Diabetic animals were treated subcutaneously with insulin (6 U/kg), or saline once a day for 8 weeks. Age-matched control rats received only saline. The kidney tissue samples were analyzed by immunohistochemical staining for Rac1 and cleaved caspase-3 expressions and using the TUNEL method for determining apoptotic cells. Diabetes increased the number of TUNEL (+) cells and cleaved caspase-3 and Rac1 expression levels in kidney. Administration of insulin for 8 weeks reduced Rac1 expression and ameliorated histopathological changes in kidney of STZ-induced diabetes model. These results may suggest that the renoprotective effect of insulin at least partly results from inhibition of Rac1 overexpression.
INTRODUCTION
Nephropathy may occur about in one-third of diabetic patients and it is the most common cause for end-stage renal disease.Citation1 Although there are various mechanisms that may lead to pathological and functional changes in diabetic kidney, the exact mechanisms are not clearly identified. Recent studies indicate that apoptosis is one of the hallmarks of diabetic nephropathy (DN).Citation2
Hyperglycemia may lead to various pathologic processes including glycosylation of circulating and cellular proteins and overproduction of reactive oxygen species (ROS).Citation1–3 Small GTPase Rac1 is an intracellular signaling molecule that influences multiple cellular functions such as controlling the organization of cytoskeleton, gene expression, and cell proliferation. Rac1 is also a subunit of the plasma membrane NADPH-oxidase, leading to the production of ROS. Rac1-induced ROS has been demonstrated in a variety of cellular processes, including growth, migration, transformation, and apoptosis.Citation4,5 NADPH activation through Rac1 was shown on apoptosis in cardiomyocytes of diabetic miceCitation5 and intestinal epithelial cells.Citation6 While previous studies demonstrated that the NADPH-oxidase activation in the kidney in both hyperglycemia and hypertension models,Citation7,8 only one study presented in a congress by Yoshida et al. reported that hyperglycemia-induced Rac1 activation was observed in cultured cells and kidney of diabetic mice.Citation9
The treatment of DN includes the strict glycemic control by insulin and other treatment modalities such as reducing blood pressure, weight and lipid control, and smoking cessation. Intensive insulin treatment has been shown in large prospective randomized studies to delay the onset of DN and its progression in patients with type 1 and type 2 diabetes.Citation10 Insulin is known to preclude DN by lowering blood glucose level and thus preventing damages caused by hyperglycemia.Citation1,10 However, through mitogen-activated protein kinase (MAPK) and phosphoinositide-3 kinase (PI3K) signaling pathways, insulin has been reported to contribute to remodeling of the actin cytoskeleton of glomerular podocytes and prevent apoptosis in some tissues, including kidneys.Citation1,11 The fact that small GTPase Rac1 plays a role in the organization of the actin cytoskeleton and can induce apoptosis in some tissues (including kidney) may raise the question in minds whether renoprotective effect of insulin occurs at least partly via Rac1, besides lowering hyperglycemia.
Therefore, we aimed to investigate the renoprotective effect of insulin on DN at least partly through Rac1 inhibition. First, we evaluated the Rac1 expression levels and their association with apoptosis in kidneys of streptozotocin (STZ)-induced diabetic rats. Then we explored the effect of insulin on Rac1 expression and apoptosis.
MATERIALS AND METHODS
Animals
Adult male Wistar rats weighing 180–220 g were used in the present study. The study was approved by the Ethics Committee of the Research of Laboratory Animals, Dokuz Eylül University Medical School, and all procedures were performed according to the “Principles of Laboratory animal care” by the “National Institute of Health” publication. All animals were kept in standardized conditions of temperature (21–22°C) and illumination (12:12 L/D) and cages with mesh bottoms, providing free access to tap water and pelleted food. The animals were fasted for 12 h before the experiment, but had free access to water until the beginning of the experiment.
Induction of Diabetes Mellitus
Freshly prepared STZ (Sigma Chemical Co, St. Louis, MO, USA) was dissolved in 0.02 M citrate buffer (pH = 4.5) and administered intraperitoneally to the rats at 45 mg/kg. The age-matched control group received citrate buffer only. On the third or fourth day after STZ administration, serum glucose levels were measured using an Optium Xceed glucometer (Abbott Diabetes Care, Oxon, UK) with a drop of blood taken from the tail vein under diethyl ether anesthesia. Rats with blood glucose levels higher than 300 mg/dL were considered diabetic. Eight weeks after STZ administration, chronic diabetes was considered to be developed.
Experimental Study Design
Twenty rats were divided into three groups as follows: STZ-induced diabetic rats (D, n = 7), age-matched control rats (C, n = 6), and insulin-treated diabetic rats (D + I, n = 7). While the insulin-treated diabetic rats (D + I) were treated with 6U/kg/day NPH insulin (which is accepted to be effective for 18–24 h, Lilly, USA) subcutaneously (s.c.) for 8 weeks, diabetic group (D) was treated with saline s.c. for the same period.Citation12 The rats were terminated by cervical dislocation and left nephrectomy was performed immediately. The blood samples were obtained via cardiac puncture for measuring blood glucose level.
Histological examination
Kidney tissues were fixed in 10% buffered formalin and embedded in paraffin wax. Five-micron-thick sections were stained with hematoxylin and eosin and periodic acid-Schiff (PAS). Histological findings were recorded in detail.
In situ terminal deoxynucleotidyl transferase biotin-dUTP nick end labeling (TUNEL) assay
Apoptosis was evaluated by the in situ terminal-deoxynucleotidyl-transferase-mediated dUTP digoxigenin nick end labeling (TUNEL) assay. A Dead End Colorimetric TUNEL system kit (In Situ Cell Death Detection Kit1 Roche, Mannheim, Germany) was used for apoptotic cell detection. Sections were deparaffinized, rehydrated in graded alcohol and microwave in pretreated in trypsin solution at 37°C for 10 min (Roche; No. 10 109 819 001). After being washed in phosphate-buffered saline (PBS), the specimens were incubated with fluorescein-labeled deoxy-UTP and terminal deoxynucleotidyl transferase at 37°C for 60 min. Subsequently, anti-fluorescein antibody-peroxidase (converter POD) solutions were applied to the slides. Sections were stained with diaminobenzidine, counterstained with hematoxylin, and mounted with entellan. Detection of apoptotic cells was performed manually under the light microscope at a magnification of ×400. The apoptotic index was calculated as the percentage of cells showing TUNEL positivity. The percentage of TUNEL (+) cells was determined by counting the positive cells from five random fields in each rat. Two independent blinded observers performed all measurements for the source of kidney tissue.Citation13
Immunohistochemical Assessment
Immunohistochemical staining was performed using the streptavidin/biotin method. The immunohistochemistry procedure was performed for Rac1 (sc-217, Santa Cruz Biotechnology, 1/100 dilution) and cleaved caspase-3 (9661, Cell Signaling, 1/300 dilution). Sections of 5 μm were cut by microtome and were incubated at 60°C overnight and then dewaxed in xylene for 30 min. After rehydrating through a decreasing series of alcohol, sections were washed in distilled water for 10 min. They were then treated with 10 mM citrate buffer (Cat No.AP-9003-125 Labvision) at 95°C for 5 min to unmask antigens by heat treatment. Then slides were rinsed three times for 2 min each with deionized water. Sections were delineated using a Dako pen (Dako, Glostrup, Denmark) and incubated in a solution of 3% H2O2 for 15 min to inhibit endogenous peroxidase activity. They were then incubated with normal serum blocking solution for 30 min, after then incubated in a humid chamber overnight at +4°C with antibodies. Afterwards, they were washed three times for 5 min each with PBS, followed by incubation with biotinylated IgG and then with streptavidin–peroxidase conjugate (Invitrogen, Histostain-Plus Broad Spectrum, 85–9043). After washing three times for 5 min with PBS, sections were incubated for 5 min with a 3, 3'-diaminobenzidine (DAB) substrate containing diaminobenzidine (1718096, Roche) to detect immunoreactivity and then with Mayer’s hematoxylin. Sections were covered with Entellan mounting (Merck, Germany) and were analyzed by light microscopy using a BH-2 microscope (Olympus, Tokyo, Japan). Control samples were processed in an identical manner, but in the absence of primary antibody step. Immunolabeling intensity of Rac1 (tubulointerstitial and glomerular areas) was graded (with semiquantitative assay) independently by two observers blind to the experimental conditions on the following scale: mild (+), moderate (++), and strong (+++) labeling. The percentage of cleaved caspase-3 positive cells was determined by counting the positive cells from five random fields in each specimen at tubulointerstitial and glomerular areas.
Statistical Analysis
All values were expressed as the mean ± standard error (mean ± SEM). The Kruskal–Wallis and Mann–Whitney U-test was used to compare staining intensity values between groups. Spearman correlation analysis was performed between cleaved caspase-3 and Rac1 expressions. All statistical procedures were performed by SPSS 15.0 software for Windows (Chicago, IL, USA). A value of p < 0.05 was considered significant.
RESULTS
Blood Glucose Levels and Body Weights of Experimental Animals
Eight weeks after STZ injection, rats exhibited increased blood glucose levels and decreased body weights than control rats, as expected. In the insulin-treated diabetic group, blood glucose levels were close to the control group and their body weight did not decrease as in the diabetic group ().
Table 1. Blood glucose levels and body weights of experimental animals.
Table 2. Results of correlation analysis between cleaved caspase-3 expression and Rac1 expression among experimental groups.
Histology
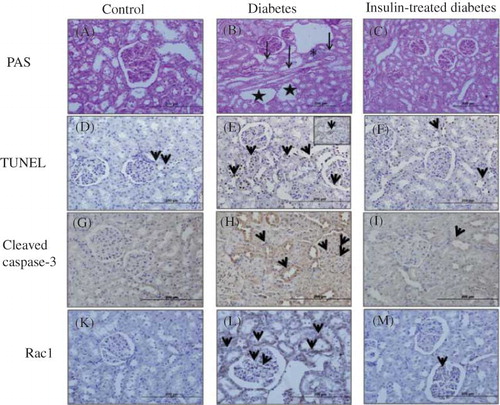
Normal histological structure was observed in PAS-stained kidney tissue specimens of the control group (A). Mesangial matrix expansion, loss of proximal tubulus brush border, inflammatory cell infiltration in interstitial tissue, degeneration in the renal tubulus, and vacuolization were observed in diabetic group (B). Moreover, these degenerative changes were mainly prevented by the insulin treatment (C).
Figure 1. Photomicrograph kidney sections from control (A), diabetic (B), and insulin-treated diabetic rats (C) PAS stain. It was observed normal morphologic structure in PAS-stained control group kidney specimens (A). Mesangial matrix expansion, loss of proximal tubulus brush border, inflamatory cell infiltration in interstitial tissue, degeneration in renal tubulus, and vacuolization were observed in diabetic group (B). Insulin-treated diabetic group, these degenerative changes were mainly prevented (C). TUNEL (+) cells and cleaved caspase-3 expressions in diabetic (tubulointerstitial area and glomerular area) group (E and H) were increased according to control (D and G) and insulin-treated diabetic groups (F and I). Rac1 immunoreactivity was showed moderate positivity in tubulointerstitial area and glomerular area in diabetic group (L), weak positivity was found both in control (K) and insulin-treated diabetic groups (M).
Determination of Apoptotic Cells
In the diabetic group compared to the control group, TUNEL staining results obtained in the renal cortex were 22.7 ± 1.2% versus 7.4 ± 0.4% in the tubulointerstitial area and 13.5 ± 0.7% versus 5.7 ± 0.4% in the glomerular area, respectively (p < 0.001, D–E and 2). TUNEL (+) cells in the insulin-treated diabetic group (13.2 ± 0.6% in tubulointerstitial area and 7.2 ± 0.5% in glomerular area) were significantly lower than the diabetes group (p < 0.001, F), but not identical as the control group ().
Figure 2. Percentage (%) of TUNEL (+) cells in kidney tissues.
Notes: All data were presented mean ± SEM. *p < 0.001, diabetic group versus control and insulin-treated diabetic group; **p < 0.001, insulin-treated diabetic group versus diabetic group.
Immunohistochemical Analysis
Immunohistochemical staining of cleaved caspase-3 showed weak expression (minimal positive staining) in kidney cortex tissues in the control group (tubulointerstitial area 4.4 ± 0.1 and glomerular area 2.3 ± 0.2) (G and ). Cleaved caspase-3 immunoreactivity were significantly increased in tubulointerstitial and glomerular mesangial areas in diabetic group (tubulointerstitial area 18.5 ± 0.5 and glomerular area 5.3 ± 0.2) (H and ). The kidney sections of insulin-treated diabetic rats (tubulointerstitial area 4.4 ± 0.7 and glomerular area 4.0 ± 0.3) were significantly lower compared to the diabetic group but similar immunoreactivity was seen when compared to the control group (I and ). Immunohistochemical staining of Rac1 showed weak expression (minimal positive staining) in the kidney cortex tissues (tubulointerstitial area 0.3 ± 0.1 and glomerular area 0.2 ± 0.1) of the control group (K and ). In the diabetic group, increased Rac 1 expressions were observed in glomerular mesangial areas and tubulointerstitial areas (tubulointerstitial area 1.9 ± 0.1 and glomerular area 0.6 ± 0.1) (L, p < 0.001). Although some glomerular mesangial areas and tubulointerstitial areas also showed increased immunoreactivity in insulin-treated diabetic group (tubulointerstitial area 0.5 ± 0.1 and glomerular area 0.4 ± 0.1), kidney specimens showed similar immunoreactivity as the control group (M and ).
Figure 3. Percentage (%) of Cleaved caspase-3 cells in kidney tissues.
Notes: All data were presented mean ± SEM. *p < 0.001, diabetic group versus control and insulin-treated diabetic group; **p < 0.001, insulin-treated diabetic group versus diabetic group.
Figure 4. Distribution of Rac1 expressions in kidney. The degrees of immunopositivity are indicated as: 0, negative staining; 1, weak staining; 2, moderate staining; 3, strong staining.
Notes: All data were presented mean ± SEM. *p < 0.001, Diabetic group versus control and insulin-treated diabetic group.
Correlation Analysis
In the diabetic group, Rac1 expressions showed moderate correlation with tubular cleaved caspase-3 expression (r = 0.383, p = 0.021) and inverse correlation with glomerular cleaved caspase-3 expression (r = −0.417, p = 0.011). There was no correlation between cleaved caspase-3 expression and Rac1 expression in tubuli and glomeruli of both control and insulin-treated diabetic kidneys ().
DISCUSSION
In the present study, the inhibitory effect of insulin on the development of DN was indirectly shown in the STZ-induced diabetic rat model to be collaterally effective along with decreasing hyperglycemia, as well as decreasing Rac1 expression and inhibiting apoptosis in the kidneys, at least to a certain extent.
Hyperglycemia is the major factor responsible for the development and progression of diabetic complications such as DN.Citation1,2 The present study showed that 8 week course of STZ-induced hyperglycemia caused histopathologic findings of DN including mesangial matrix expansion, loss of proximal tubulus brush border, inflammatory cell infiltration in interstitial tissue, degeneration in the renal tubulus, and vacuolization in kidney of Wistar rats. Increased oxidative stress due to oxygen free radical production induced by hyperglycemia plays an important role in the development and progression of DN.Citation1,7 Although multiple sources of ROS have been demonstrated, NADPH oxidase is a pivotal determinant of the redox state in the kidneys and higher NADPH oxidase levels and activity in the kidney has been detected in diabetesCitation14,15 and in high glucose conditions.Citation16,17 NADPH oxidase is a multicomponent enzyme complex and its subunit Rac1 is critical for gp91phox –NADPH oxidase activation, which is the major source of ROS production exerting cellular dysfunction and cell death in the form of necrosis or apoptosis.Citation6 It has been demonstrated that apoptosis may play an important role in the diabetic renal injury.Citation2,18–20 However, previous studies showed that Rac1 is a critical molecule of ROS production and a likely cause of apoptosis.Citation6,21
In this study, increased TUNEL (+) cells in the glomerular mesangium and tubular epithelial cells in the kidneys of diabetic rats were observed when compared to control group, and these results were found compatible with the recent reports.Citation17,20 In the diabetic group, cleaved caspase-3 expression was found higher in tubulointerstitial and glomerular areas compared to the control group, and was consistent with the report by Sato et al. which stated that caspase-3 activities in the kidneys of diabetic rats at the 8th week were 1.5 times greater than those in the control group.Citation20 It has been reported that glomerular apoptosis was minimal in rats having 4 and 8 weeks of DM and was compatible with the outcome of the present study and also showed significantly higher glomerular apoptosis values in rats with 6 months of DM compared to the controls.Citation18 The presence of apoptotic cells and increased cleaved caspase-3 expression in the tubulointerstitial area that was even higher than glomerular area suggested that STZ-induced DN model in the present study may affect primarily tubulointerstitial area at 8 weeks after diabetes inducement. The results obtained in the present study are compatible with those of the study by Menini et al.Citation11 who found a significant increase in glomerular apoptosis at 4 and 6 months in STZ-induced diabetic rats but not at 2 months after diabetes inducement. Also, in our previous study, TUNEL-positive cells were found both in the glomerular mesangium and tubular epithelial cells in the kidneys of diabetic rats. Our previous results seem to be in conflict with our present results but, our previous study had been performed in 14 weeks (4 months) after STZ-inducement of diabetes while the present study was performed with STZ-induced diabetic rats after 8 weeks (2 months) of inducement.Citation19
Rac1 mediated renal injury was shown in salt, Angiotensin-II- and oxalate-induced renal injuries in vivo and in vitro models.Citation22,23 Shibata et al. revealed that high salt diet caused renal Rac1 upregulation leading to hypertension and renal injury in salt-sensitive Dahl rats.Citation22 In addition, Thamilselvan et al. demonstrated the role of Rac1 on oxalate-induced cell injury in epithelial cell line from pig kidney with properties of proximal tubular cells. Also, the beneficial effect of Rac1 inhibitor was shown in the same study.Citation23 While Rac1 was shown to be associated with nephropathy in nondiabetic experimental models in these studies, only one study by Yoshida et al. reported hyperglycemia-induced Rac1 activation in cultured cells and kidney of diabetic mice.Citation9 However, we were not able to read the full text of their study, since it was not published yet, to our knowledge.
In this study, Rac1 expression was higher in the kidneys of diabetic rats compared to the control group. Also, Rac1 expression in the tubuli was significantly increased and its distribution was similar to that of apoptotic regions. These present results were consistent with above mentioned studies investigating renal injury in nondiabetic experimental models as well as the study conducted by Yoshida et al in diabetic kidneys.Citation9 Although Rac1 expression was moderately correlated with tubular cleaved caspase-3 expression, there was inverse correlation in glomeruli in the diabetic group. These results suggest that the increase in Rac1 expressions may be related to especially tubular apoptosis and also may be associated with DN in 8 weeks STZ-induced diabetic rat model.
The treatment of DN should include the normalizing glycemic control by insulin and the other treatments such as reducing blood pressure, weight and lipid control, and smoking cessation. Optimal glycemic control for type 1 diabetes needs insulin treatment. Also most of the patients with type II diabetes ultimately will require insulin.Citation1,10 Intensive insulin treatment that has been shown in various large prospective randomized studies may delay the onset of DN and its progression in patients with type 1 and type 2 diabetes.Citation10 Although the mechanisms of insulin in preventing diabetic complications are well known, the mechanisms are unclear for developing DN.
It has been shown that insulin has an antiapoptotic effect on some tissues including heart in ischemia-reoxygenation models and kidney in diabetic state.Citation11,24 Therefore, in this present study, the effects of insulin treatment on apoptosis and on Rac1 expressions were evaluated in the STZ-induced diabetic rats. In the diabetic group, the histological changes induced by diabetes were prevented by 8 week insulin treatment, as expected. TUNEL (+) cells in the insulin-treated diabetic group were significantly lower than the diabetic group, but not at the same levels as the control group. Although insulin treatment decreased cleaved caspase-3 expressions nearly 41% in tubulointerstitial area and 25% in glomerular area, it has not decreased the levels as in the control group. This was also evidenced in the present study, so that preventing an increase in TUNEL (+) cells and caspase-3 by insulin may be the result of its antiapoptotic action. Unfortunately, there was not enough decrease in apoptosis in the insulin-treated group compared to the control group, which may suggest that additional treatment to prevent DN is needed.
Rac1 immunoreactivity was significantly decreased and there was no correlation between Rac1 and cleaved caspase-3 expressions in the kidneys of insulin-treated diabetic group. The decrease in Rac1 immunoreactivity in the insulin-treated group may suggest that preventing effect of insulin in addition to hyperglycemia improving effect may, at least, partly result from the inhibition of Rac1 overexpression.
Moreover, the treatment modalities such as Rac1 inhibition may be promising in this area of research and further relevant studies are required to be conducted. The significant decreases in Rac1 expressions in tubulointerstitial area suggest that Rac1 inhibition may be most effective in tubulointerstitial injury in DN.
Insulin treatment only delays DN development but not in all patients. Therefore, other treatment modalities such as Angiotensin converting enzyme inhibitors and Angiotensin receptor blockers related renin–angiotensin aldosterone system (RAAS) may be used to prevent DN. The relation of Rac1 with RAAS system was shown in several studies which suggest that mineralocorticoid receptor activation by Rac1 may be responsible for salt sensitive and A-II induced renal injury.Citation21–23
Insulin is known to prevent DN by lowering blood glucose level and thus inhibiting hyperglycemia-related damages.Citation1,10 However, through MAPK and PI3K signaling pathways, insulin has been reported to contribute to remodeling of the actin cytoskeleton of glomerular podocytes and prevent apoptosis in some tissues, including kidneys.Citation1,11 Various roles of the small GTPase Rac1, such as organization of the actin cytoskeleton and induction of apoptosis in some tissues including kidneys, have been demonstrated to date.Citation4,5,21–23 This is the first study that examined the effects of 8 weeks insulin treatment on Rac1 expression in the kidneys of a STZ-induced diabetic rat model. In this study, the relation between insulin and Rac1 in rat DN model is investigated and demonstrated.
Renoprotective effect of insulin is substantially due to improving hyperglycemia, however, inhibition of Rac1 overexpression by insulin is also recognized important in this regard, at least to a certain extent. This present study demonstrated that insulin inhibited Rac1 overexpression in the kidneys and exhibited renoprotective effect, at least partially, in this way.
Taken together, these findings suggest that, targeting Rac1 signaling pathway may be a new therapeutic approach in the management of DN. However, further studies are necessary to understand the role of Rac1 in DN.
Declaration of interest
The authors report no conflicts of interest. The authors alone are responsible for the content and writing of this article.
ACKNOWLEDGMENTS
This work was supported by Dokuz Eylul University Research Foundation (2010. KB. SAG. 019). The authors thank Prof. Dr. Semra Kocturk for kindly providing us with the cleaved caspase-3 antibody. This study was presented as a poster in the EPHAR 2012 which was held in Granada, Spain, 17–21 July 2012.
REFERENCES
- Choudhury D. Diabetic nephropathy—a multifaceted target of new therapies. Discov Med. 2010;10:406–415.
- Wagener FA, Dekker D, Berden JH, Scharstuhl A, van der Vlag J. The role of reactive oxygen species in apoptosis of the diabetic kidney. Apoptosis. 2009;14(12):1451–1458.
- Cao Z, Cooper ME. Pathogenesis of diabetic nephropathy. J Diabet Invest. 2011;2:243–247.
- Tobar N, Cáceres M, Santibáñez JF, Smith PC, Rac MJ. 1 activity and intracellular ROS modulate the migratory potential of MCF-7 cells through a NADPH oxidase and NFkappaB-dependent mechanism. Cancer Lett. 2008;267:125–132.
- Shen E, Yanwen L, Ying L, . Rac1 is required for cardiomyocyte apoptosis during hyperglycemia. Diabetes. 2009;58:2386–2395.
- Jin S, Ray RM, Johnson LR. TNF-alpha/cycloheximide-induced apoptosis in intestinal epithelial cells requires Rac1-regulated reactive oxygen species. Am J Physiol Gastrointest Liver Physiol. 2008;294:928–937.
- Peixoto EB, Pessoa BS, Biswas SK. Lopes de Faria JB. Antioxidant SOD mimetic prevents NADPH oxidase-induced oxidative stress and renal damage in the early stage of experimental diabetes and hypertension. Am J Nephrol. 2009;29(4):309–318.
- Moon JY, Tanimoto M, Gohda T, . Attenuating effect of angiotensin-(1–7) on angiotensin II-mediated NAD(P)H oxidase activation in type 2 diabetic nephropathy of KK-A(y)/Ta mice. Am J Physiol Renal Physiol. 2011;300:F1271–F1282.
- Yoshida S, Nagase M, Shibata S, Kawarazaki W, Takeuchi M, Fujita T. Intrarenal Rac1 activation and renoprotective effect of mineralocorticoid receptor antagonist in obese diabetic nephropathy. NDT Plus. 2009: ii985. Abstracts from the World Congress of Nephrology, Milan, Italy, May 22–26, 2009.
- American Diabetes Association. Standards of medical care in diabetes—2011. Diabetes Care. 2011;34:S11–S61.
- Menini S, Iacobini C, Oddi G, . Increased glomerular cell (podocyte) apoptosis in rats with streptozotocin-induced Diabetes Mellitus: role in the development of diabetic glomerular disease. Diabetologia. 2007;50:2591–2599.
- Paskaloglu K, Sener G, Ayanoglu-Dülger G. Melatonin treatment protects against diabetes-induced functional and biochemical changes in rat aorta and corpus cavernosum. Eur J Pharmacol. 2004;499:345–354.
- Guneli E, Tugyan K, Ozturk H, Gumustekin M, Cilaker S, Uysal N. Effect of melatonin on testicular damage in streptozotocin-induced diabetes rats. Eur Surg Res. 2008;40:354–360.
- Asaba K, Tojo A, Onozato ML, Goto A, Quinn Fujita T, Wilcox CS. Effects of NADPH oxidase inhibitor in diabetic nephropathy. Kidney Int. 2005;6:1890–1898.
- Onozato ML, Tojo A, Goto A, Fujita T, Wilcox CS. Oxidative stress and nitric oxide synthase in rat diabetic nephropathy: effects of ACEI and ARB. Kidney Int. 2002;61:186–194.
- Ishii N, Ogawa Z, Suzuki K, Numakami K, Saruta T, Itoh H. Glucose loading induces DNA fragmentation in rat proximal tubular cells. Metabolism. 1996;45:1348–1353.
- Ortiz A, Ziyadeh FN, Neilson EG. Expression of apoptosis-regulatory genes in renal tubular epithelial cells exposed to high ambient glucose and in diabetic kidneys. J Investig Med. 1997;45:50–56.
- Pesce C, Menini S, Pricci F, . Glomerular cell replication and cell loss through apoptosis in experimental Diabetes Mellitus. Nephron. 2002;90:484–488.
- Gumustekin M, Tekmen I, Guneli E, . Short-term melatonin treatment improved diabetic nephropathy but not hemorheological changes in diabetic rats. Pharmazie. 2007;62:693–698.
- Sato Y, Feng GG, Huang L, . Enhanced expression of naofen in kidney of streptozotocin induced diabetic rats: possible correlation to apoptosis of tubular epithelial cells. Clin Exp Nephrol. 2010;14:205–212.
- Shibata S, Nagase M, Yoshida S, . Modification of mineralocorticoid receptor function by Rac1 GTPase: implication in proteinuric kidney disease. Nat Med. 2008;14:1370–1376.
- Shibata S, Mu S, Kawarazaki H, . Rac1 GTPase in rodent kidneys is essential for salt-sensitive hypertension via a mineralocorticoid receptor-dependent pathway. J Clin Invest. 2011;121:3233–3243.
- Thamilselvan V, Menon M, Thamilselvan S. Selective Rac1 inhibition protects renal tubular epithelial cells from oxalate-induced NADPH oxidase-mediated oxidative cell injury. Urol Res. 2012;40:415–423.
- Jonassen AK, Brar BK, Mjos OD, Sack MN, Latchman DS, Yellon DM. Insulin administered at reoxygenation exerts a cardioprotective effect in myocytes by a possible anti-apoptotic mechanism. J Mol Cell Cardiol. 2000;32:757–764.