Abstract
Background: The primary aim of this study was to assess whether a fixed protocol, using a specially trained team, for intermediate follow-up to fulfillment of guideline targets is non-inferior to conventional follow-up in the care of uraemic patients. A secondary aim was to investigate possible impact on patient outcome. Methods: The cohort comprised 424 patients from seven centers. Inclusion criteria were either serum creatinine exceeding 200 µmol/l or calculated clearance below 30 ml/min, representing CKD 4 or 5a. Six centers followed a standardized protocol (group 1). One center provided controls (group 2). The study design was prospective and interventional. The variables measured were blood hemoglobin, bicarbonate, calcium, phosphate, intact parathyroid hormone, albumin, renal function variables, blood pressure and RAAS blockade. The number of patients achieving the set goals was analyzed as a time trend to determine if the intervention resulted in an improvement. Results: At baseline, group 1 had significantly lower GFR and higher serum creatinine, calcium, phosphate, calcium × phosphate product and bicarbonate, lower mean arterial pressure (MAP), systolic blood pressures and less use of RAAS. During the intervention, group 1 improved in the direction of guidelines for blood hemoglobin, albumin, bicarbonate and MAP. Outcome of secondary endpoints gave a risk of death of 30% in both groups, while the risk of renal replacement therapy was higher in group 1. Conclusions: However, the time to renal replacement therapy was significantly shorter in the intervention group, indicating that other variables than guideline achievements are important for the patient.
Introduction
Uraemia is a condition of impaired health in which various irregularities need to be managed simultaneously during follow-up in the outpatient clinic. Positive effects of timely referral to a nephrologist for the care of the patient include delayed progression of renal failure and adequate preparation before entering RRT.Citation1 Referring the patient to a nephrologist increases the possibility for initiation of optimal treatment.Citation2–12
However, in relation to anemia, acidosis, hyperlipidemia, hyperphosphatemia, hyperparathyroidism, use of angiotensin renal blockers (ARB) and hypertension, the management of the patient is often suboptimal.Citation2,Citation4,Citation5,Citation13,Citation14 The implementation of new strategies in daily care may also be impeded by the difference in treatment goals.Citation15–20
Primary aim of this study was to assess whether a fixed protocol, using specially trained renal co-ordinators for intermediate control of data and appointments, is non-inferior in terms of fulfilling guideline targets. The secondary aim was to investigate the impact on patient outcome.
Material and methods
The investigation was performed as a prospective, interventional study. The patient cohort comprised 424 consecutively included subjects from seven centers. Inclusion criteria were either serum creatinine exceeding 200 µmol/l or calculated clearance below 30 ml/min. This corresponds to CKD stages 4 and 5a.Citation21,Citation22 The various diagnoses are presented in .
Table 1. Demographic data, patients in group 1 and group 2.
Six centers followed a standardized program (group 1). Five of the centers were county hospitals and one was a university clinic. Another center at a second university clinic, provided controls, where clinicians and staff were blinded to the aim of the study. The inclusion period ranged from January 2002 to December 2005. The patients were followed until uptake into RRT or death.
A uniform protocol was designed (group 1, , ). Intermediate outpatient clinical appointments were performed by specially trained renal nurses (renal co-ordinators) for intermediate control of data and extra appointments performed in collaboration with local physicians. Variables considered mandatory in the treatment of CKD were identified: hemoglobin, blood pressure (mean), acid–base balance, phosphate, intact parathyroid hormone, albumin, renal function variables and the use of renin--angiotensin--aldosterone-system (RAAS) blockade ().
Figure 1. Schedule for registration of guideline variables.
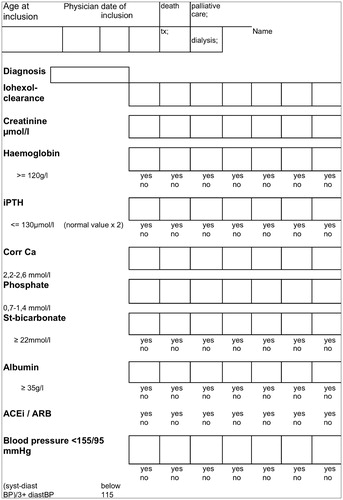
Table 2. Targets set for patients treated in group 1.
Follow-up appointments were scheduled quarterly in group 1. Patients expected to have less than three months to RRT were excluded. Secondary endpoint was defined as time to start of dialysis or death before start of dialysis.
The Ethics Committee of the University of Linköping approved the study.
Demographic data and measurement of glomerular filtration rate (GFR)
Baseline data for patients are presented in Table 3. Since the patients were selected based either on a serum creatinine level exceeding 200 µmol/l at entry or a glomerular filtration rate below 30 ml/min, measured on a sample or estimated by calculation according to the Cockroft–Gault formula (using an estimated height for men of 175 cm and women of 162 cm).
Blood pressure
Mean arterial pressure (MAP) was calculated according to the formula: ((diastolic blood pressure) + (1/3 × (systolic blood pressure – diastolic blood pressure))).
Edmonton system assessment scale (ESAS)
At the scheduled appointments (group 1 only) a self-report form was used and ESASCitation23 scores were calculated on 570 occasions in 92 patients. The score evaluates the well-being of the patient.
Statistical analyses
Group differences in time to event were analyzed using the Cox proportional hazard regression. It was evaluated graphically by examining the Kaplan–Meier survival curves. Time to event was defined as months from study inclusion to time of death or RRT. Patients who had not experienced an event at the end of the study were censored. The regression included the following independent factors: group, gender and age. To analyze whether possible differences varied with age or gender, the 2-way interactions group * age and group * gender were included in the initial model and removed if non-significant. Further analyses were adjusted for group differences at baseline by also including creatinine, glomerular filtration rate (GFR), blood hemoglobin, calcium × phosphate product, albumin, bicarbonate, mean arterial pressure (MAP) and use of ACE-inhibitors/ARB. Parathyroid hormone data (PTH) were excluded from that calculation due to insufficient number of measurements.
Analyses were performed for trends in risk factors such as mean arterial blood pressure, systolic and diastolic blood pressure, serum bicarbonate, phosphate, calcium, PTH, albumin, calcium × phosphate product, creatinine and glomerular filtration rate (GFR) using generalized estimation equations (GEE, ) assuming different correlation structures between repeated samples depending on what outcome-variable was measured (). Analyses included data up to 2 years of follow-up. Survival analysis was followed up for a prolonged period of time.
Chi-square analyses were calculated. The level of significance was set at less than 0.05.
Results
Baseline data
At entry into the study (baseline) GFR was significantly lower in group 1 (19 ± 8 vs. 22 ± 7 ml/min, p < 0.001, , ), corresponding to a higher serum creatinine in group 1 (299 µmol/l ± 95 vs. 273 ± 92, p = 0.009, ). Uptake into dialysis occurred at GFR level 6–10 at all centers. Women had lower values than men; this is congruent with inclusion based on serum creatinine below 200 µmol/l women will have lower GFR.
Figure 2. Change of mean value of various variables at visit 1 (start), and then every three months until visit 9 (24 months). Group 1 filled circles and filled line versus Group 2 (controls) with open squares and hatched line. (A) Estimated GFR; (B) serum creatinine; (C) blood haemoglobin; (D) serum albumin; (E) Ca × phosphate product; (F) serum total calcium; (G) serum bicarbonate; (H) mean arterial pressure (MAP).
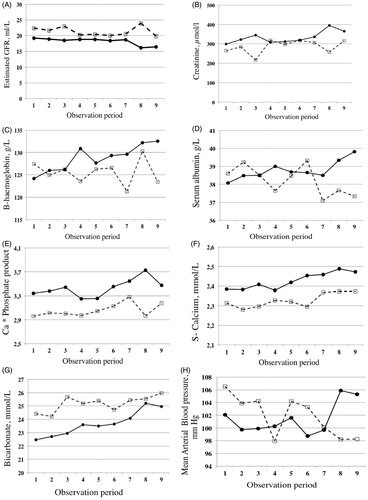
There was no significant difference between the groups at baseline with regard to gender, age, albumin, PTH and diastolic blood pressure. Group 1 had higher serum calcium, phosphate and calcium × phosphate product, while group 2 had higher bicarbonate levels, systolic blood pressure, mean arterial pressure and more extensive use of ACE inhibitors/ARB.
Achievement of treatment goals toward guidelines
The use of a protocol resulted in a significant improvement of several of the variables over time.
Blood hemoglobin
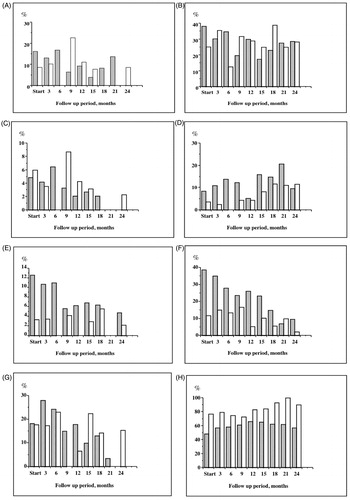
The mean blood hemoglobin differed between genders but was similar at start. It increased over time in group 1 in contrast to group 2 (p = 0.00, ; ). The trend differed between the groups. More patients were below guideline level 110 g/l in group 1 at start (16.5% vs. 7.5, p = 0.018) but this did not differ at 12 and 24 months (.
Figure 3. Percentage of patients that are outside of guideline values in Group 1 (hatched bars) and Group 2 (open bars). (A) Blood haemoglobin less than 110 g/L; (B) blood haemoglobin less than 120 g/L; (C) serum albumin less than 30 g/L; (D) serum calcium × phosphate product above 4.5; (E) standard bicarbonate (SBC) less than 20 mmol/L; (F) standard bicarbonate (SBC) less than 22 mmol/L; (G) parathyroid hormone (PTH) above 300 pmol/L; (H) percentage of patients prescribed ACE-inhibitors/ARB.
Calcium × phosphate product
There was a significantly higher calcium × phosphate product in group 1 at start. This difference was maintained while a similar increase was noted in both groups (p = 0.001, , ).
Table 3. Baseline data for patients in groups 1 and 2 (controls).
More patients were above the guideline product of 4.5 in group 1 at start (8% vs. 2, p = 0.011). This did not differ between the groups at 12 and 24 months (). There were differences between the groups and genders. There was a significant change over time (p = 0.001, ) while this trend did not differ between the groups ().
Table 4. (A) Overview of the correlation structure used (Corr. Structure: I = Independent, A = Autoregressive), U = unstructured), distribution (N = Normal, G = Gamma) and Link function (I = Identity, L = Log) for the various variables analyzed. (B) Risk factor trend analysis using GEE models, separate model for each factor. p Values are given in the table.a
Serum albumin
Serum albumin was similar between the groups at start (). There was a significant trend of improvement in group 1, while a reduction was seen in group 2 (). The proportion of patients who had a serum albumin of less than 30 g/l at start of study were 6% in both groups and at 24 months, 0 versus 1.7% (). The trend for serum albumin changed differently between the groups (p = 0.005, ) over time.
Serum bicarbonate
There was higher serum bicarbonate at start in group 2 than group 1 (). There was an increase in mean standard bicarbonate over time in both groups ().
At start, 43% of patients in group 1 were below the guideline level versus 12.5% in group 2 (p = 0.001). At 24 months, the difference was not present and 9.5 versus 6.6% of patients were below guideline levels (.
There was a significant trend toward fewer patients with pathologically lowered concentrations in group 1 (R = −0.95, p < 0.001) and group 2 (R = −0.69, p = 0.038) (). There was a difference between the groups and a trend of change over time that was similar for the groups (p < 0.001, ).
Parathyroid hormone
The proportion of patients with serum PTH exceeding 300 µmol/l did not differ between the groups during the observation period (18 vs. 17% at start, ).
Blood pressure
The MAP was higher at start in group 2 (). There was a significant trend over time (p = 0.018, ). In addition, there was a reduction in group 1 and in contrast an increase in group 2 (p = 0.007, , ). At the first appointment MAP was above the guidelines in 13% in the group 1 versus 24% in the group 2 (p = 0.015). At the one-year appointment 10 versus 15% were above the guidelines (not significant, ns.) and at the 2-year appointment 24 versus 8.5% (ns.) were above guidelines.
ACE inhibitors/ARB
A larger proportion of patients in group 2 were treated with either ACE-inhibition/ARB at start (78% vs. 48, p = 0.001, ) and at 3, 12, 15, 18 and 24 months than in group 1 (p < 0.05).
Over the observation period there was a significant trend of an increased prescription of ACE-inhibitors or ARB in group 2 (p = 0.001). Such trend could not be detected in group 1 ().
There was no difference in blood pressure when comparing data of those measures when the patients were prescribed ACE-inhibition/ARB or not (systolic blood pressure 145 ± 22 vs. 146.8 ± 24; diastolic 80 ± 11 vs. 80 ± 12). Neither was there a difference in blood hemoglobin at these occasions (127 ± 14, n = 1012 vs. 126 ± 15 g/l).
There was no difference in risk for death if the patients were on ACE/ARB-medication or not at baseline (67 of 242 vs. 63 of 178).
ESAS
ESAS was determined only in group 1. There was a significant correlation between the ESAS score and PTH (R = 0.12, n = 540, p = 0.005). ESAS correlated inversely to iohexol clearance values (R = −0.10, n = 493, p = 0.025), hemoglobin (R = −0.12, n = 493, p = 0.006), and albumin (R = −0.11, n = 572, p = 0.011). The mean ESAS score was 2.7 (±2.0, n = 252) for patients not on ACEinh, and 2.2 (±2.4, n = 320, p = 0.010) for patients on ACEinh treatment.
Gender comparison
Women had, compared to men, at baseline a significantly lower estimated creatinine clearance, (14 ± 6 ml/min vs. 23 ± 7, p = 0.000), serum creatinine (270 ± 83 vs. 301 ± 99, p = 0.001) and hemoglobin, while higher levels were present for PTH, phosphate and the calcium × phosphate product. Except for estimated GFR and serum creatinine these differences were not present at 24-month follow-up.
Secondary endpoints
During the follow-up period, 29% died in group 1 and 34% in group 2 (not significant).
The mean number of months used in the Kaplan–Meier estimation for time to death of patients was 59.7 (CI 55.3–64.1) versus 68.3 (CI 62.2–74.3). The survival distribution did not differ between the groups ( and , ).
Figure 4. Kaplan--Meier curve of survival over observation time in month in Group 1 (lower line) or Group 2 (upper line).
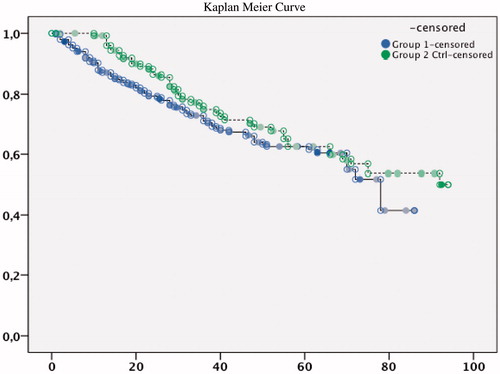
Table 5. Cox regression forward conditional with analysis using “death” as endpoint and variables at first appointment.
Table 6. Means and median months for survival time in the Kaplan–Meier equation.
The mean number of months used in the Kaplan–Meier estimation for time to Renal Replacement Therapy was 49 months for group 1 (CI 45–53) and 66 months for group 2 (CI 60–72). The extent of patient who entered the dialysis program was higher in group 1 than group 2 (50%, n = 146 vs. 38%, n = 50, p = 0.044). The hazard ratio, adjusted for age and gender, was 1.77 (95% CI: 1.38–2.26) for group 1 compared to group 2 ( and ). The difference was still significant after adjustments for baseline factors (). The patients who entered into RRT (n = 146 group 1 and 50 in group 2) started hemodialysis (44% in group 1 vs. 23% in group 2), peritoneal dialysis (3% vs. 16%) and transplantation directly, respectively (3% vs. 1%).
Figure 5. Kaplan--Meier curve of retention free of renal replacement therapy over observation time in month in Group 1 (lower line) or Group 2 (upper line).
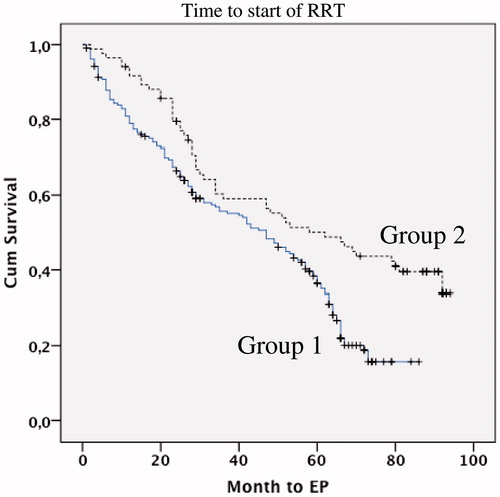
Table 7. Cox regression analysis using “renal replacement therapy” as endpoint and variables at baseline (first appointment). Forward conditional analyses.
Table 8. Means and medians for survival time. Kaplan–Meier estimation for time to renal replacement therapy.
Cox regression analyses were performed with death or start of renal replacement therapy by any reason as endpoint and including the variables age, gender, study groups, estimated GFR, serum creatinine, calcium × phosphate product, serum bicarbonate level, serum albumin, mean arterial pressure (MAP) and use of ACE inhibitors or ARB in the models. In a forward conditional analysis for the end point, death significant variables were age, serum creatinine, calcium × phosphate product and mean arterial pressure (MAP, ). The Cox regression analysis with renal replacement therapy as endpoint revealed as significant base line variables the group effect, serum creatinine and the calcium × phosphate product ().
Discussion
This study investigated if there would be a change in outcome using the addition of intermediate outpatient visits with the help of renal co-ordinators for group 1 patients. Such intervention resulted in improvements in patients’ adherence to guidelines with regard to the levels of hemoglobin, the calcium × phosphate product, albumin and bicarbonate, while there was no increase in prescription of ACE inhibitors among care providers. This indicates that the support of the renal co-ordinator and dietician guided by local physicians in this regard was not inferior and even to some extent improved outcome as a resource to achieve adherence to guidelines of these patients.
Approximately 30% of patients in both groups died during the study period. Although the time from study start to death was longer in the non-intervention group, the survival distribution did not differ.
A larger proportion of patients in group 1 entered RRT. One explanation may be the lower GFR and higher serum creatinine levels at baseline in that group. Another could be that although patients in group 1 had improved variables in relation to guideline levels, a number of significant baseline variables were worse than in group 2, although not blood pressure. However, there was no evident improvement in group 1 toward the mean over time in the Kaplan–Meier curve. The Cox analysis confirmed that higher serum creatinine but not lower GFR was of worse prognosis. This may indicate that patients with small muscle mass receive dialysis later.Citation24 Worse prognosis for patients with a higher calcium × phosphate product is consistent with faster deterioration of renal function, but may also indicate poor adherence to dietary recommendations, phosphate binder intake and other medication. Another reason for group 2 having a more favorable outcome may be that a lack of renal co-ordinators will not result in a replacement of a planned outpatient clinic visits to an experienced physician. In such visits the physician also will consider other clinical disturbances and risk factors besides guideline criteria, such as cardiac function, fluid state, metabolic and lipid control and physical activity recommendations. However, according to others when the option is to use multiple nephrology trainees rotating through a nephrology clinic, the time to RRT does not differ although the support of single experienced renal nurse practitioner working to a protocol, are more likely to adhere to guidelines.Citation25,Citation26 Notable is that longer duration of regular nephrological care in the predialysis period, at least for several years prior to the start of dialysis, is associated with a better long-term survival on dialysis. Such data strongly support the argument for early referral and regular nephrological care of chronic renal failure patients.Citation3
In the Cox regression analysis, it was noteworthy that lower MAP indicated worse outcome. Another reason for the adverse effect of low MAP may be that the guidelines support too low blood pressure for the individual patient, especially patients who are older and/or suffer from arteriosclerosis resulting in ischaemic lesions. Inappropriate use of RAAS inhibitors may also accelerate the decline of renal function in vulnerable patients.Citation27,Citation28 The higher extent and possibly earlier prescription of ACE-inhibitors or ARB to group 2 may be another reason for prolonged renal survival of those patients. However, the beneficial effect of ACE inhibitors or ARB was not verified in the Cox model.
A systemic approach in the care of patients with renal insufficiency has been described as beneficial to outcome in studies where patients with diabetic nephropathy and anemia were treated according to a structured protocol, with positive effects achieved in terms of the rate of renal decline and anemia correction.Citation29,Citation30 All variables included in the protocol were considered risk factors for shortening of renal and patient survival, such as elevated blood pressure,Citation7,Citation19 anemia,Citation8 hyperparathyroidism,Citation9 metabolic acidosisCitation31 and hypoalbuminemia.Citation10
ESAS score did not deteriorate over the time, suggesting that the interventions did not affect the subjective wellbeing. Adjustment of quality of life expectations during the course of renal disease may also take place.Citation32
This study confirms that a structured protocol used by a specially trained multidisciplinary team in daily patient care at centers with limited resources facilitates to achievement of guideline targets. However, secondary end-point data indicate that more intense follow-up and possibly even earlier interventions performed by the physicians, i.e. “doctor’s time,” are important.
Declaration of interest
The authors report no conflicts of interest. We also thank Amgen, Genzyme, Astra Zeneca and the Jönköping County Council for financial support.
Acknowledgements
We would like to thank the nurses for patient coordination and data retrieval: Annika Johansson, Annika Svensson, Catarina Löwhagen, Maria Grubbström, Susanne Sparr, Solveig Lund, Lena Ringstad, Anna Hallberg-Karlsson, Ingrid Göransson, Annika Eriksson, Helene Arbman and others.
References
- Goransson LG, Bergrem H. Consequences of late referral of patients with end-stage renal disease. J Intern Med. 2001;250:154–159
- Patel SS, Kimmel PL, Singh A. New clinical practice guidelines for chronic kidney disease: a framework for K/DOQI. Semin Nephrol. 2002;22:449–458
- Jungers P, Massy ZA, Nguyen-Khoa T, et al. Longer duration of predialysis nephrological care is associated with improved long-term survival of dialysis patients. Nephrol Dial Transplant. 2001;16:2357–2364
- Codreanu I, Perico N, Remuzzi G. Dual blockade of the renin-angiotensin system: the ultimate treatment for renal protection? J Am Soc Nephrol. 2005;16(Suppl 1):S34–S38
- Minutolo R, Chiodini P, Cianciaruso B, et al. Epoetin therapy and hemoglobin level variability in nondialysis patients with chronic kidney disease. Clin J Am Soc of Nephrol. 2009;4:552–559
- Esnault VL, Ekhlas A, Nguyen JM, Moranne O. Diuretic uptitration with half dose combined ACEI + ARB better decreases proteinuria than combined ACEI + ARB uptitration. Nephrol Dial Transplant. 2010;25:2218–2224
- Sarnak MJ, Greene T, Wang X, et al. The effect of a lower target blood pressure on the progression of kidney disease: long-term follow-up of the modification of diet in renal disease study. Ann Intern Med. 2005;142:342–351
- Rossert J, Froissart M, Jacquot C. Anemia management and chronic renal failure progression. Kidney Int Suppl. 2005;99:S76–S81
- Schmitt CP, Odenwald T, Ritz E. Calcium, calcium regulatory hormones, and calcimimetics: impact on cardiovascular mortality. J Am Soc of Nephrol. 2006;17:S78–S80
- Menon V, Greene T, Wang X, et al. C-reactive protein and albumin as predictors of all-cause and cardiovascular mortality in chronic kidney disease. Kidney Int. 2005;68:766–772
- Laverman GD, Remuzzi G, Ruggenenti P. ACE inhibition versus angiotensin receptor blockade: which is better for renal and cardiovascular protection? J Am Soc Nephrol. 2004;15(Suppl 1):S64–S70
- Cleveland DR, Jindal KK, Hirsch DJ, Kiberd BA. Quality of prereferral care in patients with chronic renal insufficiency. Am J Kidney Dis. 2002;40:30–36
- Hansen RA, Chin H, Blalock S, Joy MS. Predialysis chronic kidney disease: evaluation of quality of life in clinic patients receiving comprehensive anemia care. Res Social Adm Pharm. 2009;5:143–153
- Perico N, Codreanu I, Schieppati A, Remuzzi G. Prevention of progression and remission/regression strategies for chronic renal diseases: can we do better now than five years ago? Kidney Int Suppl. 2005;98:S21–S24
- Baigent C, Landray MJ, Reith C, et al. (Study of Heart and Renal Protection): a randomised placebo-controlled trial. Lancet. 2011;377:2181–2192
- Hostetter TH, Lising M. National kidney disease education program. J Natl Med Assoc. 2002;94:72S–75S
- Combe C, McCullough KP, Asano Y, Ginsberg N, Maroni BJ, Pifer TB. Kidney Disease Outcomes Quality Initiative (K/DOQI) and the Dialysis Outcomes and Practice Patterns Study (DOPPS): nutrition guidelines, indicators, and practices. Am J Kidney Dis. 2004;44:39–46
- Pai AB, Smeeding JE, Brook RA. The role of sevelamer in achieving the kidney disease outcomes quality initiative (K/DOQI) guidelines for hyperphosphatemia. Curr Med Res Opin. 2004;20:991–999
- Fioretto P, Solini A. Antihypertensive treatment and multifactorial approach for renal protection in diabetes. J Am Soc Nephrol. 2005;16(Suppl 1):S18–S21
- van Zuilen AD, Blankestijn PJ, van Buren M, et al. Quality of care in patients with chronic kidney disease is determined by hospital specific factors. Nephrol Dial Transplant. 2010;25:3647–3654
- St Peter WL, Schoolwerth AC, McGowan T, McClellan WM. Chronic kidney disease: issues and establishing programs and clinics for improved patient outcomes. Am J Kidney Dis. 2003;41:903–924
- National Kidney Foundation. K/DOQI clinical practice guidelines for chronic kidney disease: evaluation, classification, and stratification. Am J Kidney Dis. 2002;39:S1–S266
- Bruera E, Kuehn N, Miller MJ, Selmser P, Macmillan K. The Edmonton Symptom Assessment System (ESAS): a simple method for the assessment of palliative care patients. J Palliat Care. 1991;7:6–9
- Swedko PJ, Clark HD, Paramsothy K, Akbari A. Serum creatinine is an inadequate screening test for renal failure in elderly patients. Arch Intern Med. 2003;163:356–360
- Holmberg B, Stegmayr BG. Cardiovascular conditions in hemodialysis patients may be worsened by extensive interdialytic weight gain. Hemodial Int. 2009;13:27–31
- Lee W, Campoy S, Smits G, Vu Tran Z, Chonchol M. Effectiveness of a chronic kidney disease clinic in achieving K/DOQI guideline targets at initiation of dialysis – a single-centre experience. Nephrol Dial Transplant. 2007;22:833–838
- Onuigbo MA. Can ACE inhibitors and angiotensin receptor blockers be detrimental in CKD patients? Nephron Clin Pract. 2011;118:c407–c419
- Bohler S, Pittrow D, Bramlage P, Kirch W. Drug interactions with angiotensin receptor blockers. Expert Opin Drug Saf. 2005;4:7–18
- Hossli S. Developing an anemia management protocol. Case study of the anemic patient. ANNA J. 1997;24:678–684; quiz 685
- Leung WY, So WY, Tong PC, Chan NN, Chan JC. Effects of structured care by a pharmacist-diabetes specialist team in patients with type 2 diabetic nephropathy. Am J Med. 2005;118:1414.e21--1414.e27
- Shah SN, Abramowitz M, Hostetter TH, Melamed ML. Serum bicarbonate levels and the progression of kidney disease: a cohort study. Am J of Kidney Dis. 2009;54:270–277
- Davison SN, Jhangri GS, Johnson JA. Cross-sectional validity of a modified Edmonton symptom assessment system in dialysis patients: a simple assessment of symptom burden. Kidney Int. 2006;69:1621–1625