
Abstract
Aim: There is limited information about arterial stiffness in chronic kidney disease (CKD) which is an independent risk factor for cardiovascular events. Pulse wave velocity (PWV), augmentation index (AIx) are using to determine arterial stiffness. We aimed to study PWV, AIx, volume status in patients with stage 3B-5 CKD and continuous ambulatory peritoneal dialysis (CAPD). Methods: Sixty-six stage 3B-5 CKD patients, 21 CAPD patients, 34 healthy controls were included. Pulse wave velocity, AIx, volume status was evaluated by Mobil-O-Graph®, and bioimpedance spectroscopy, respectively. Results: The Median PWV was 7.5 m/s in CKD, 6.2 m/s in CAPD, 5.9 m/s in healthy controls, and while PWV was found to have increased significantly in CKD patients (p = 0.002), the Alx values were similar in all groups. The median extracellular fluid excess was higher in both the CKD and, CAPD patients when compared with healthy controls (1.26 and 1.21 L, respectively). Overhydration was more prevalent in CKD and CAPD patients (p < 0.001). Age, central systolic blood pressure, body mass index, fat mass, overhydration, CKD, eGFR were the major determinants of PWV. Conclusion: Increased PWV was found in stage 3B-5 CKD patients. Overhydration may contribute this increment.
Introduction
Chronic kidney disease (CKD) has become a public health problem the world over, witnessing an increasing in both incidence and prevalence. Cardiovascular diseases (CVD) are the most important cause of morbidity and mortality in CKD.Citation1–3 Traditional risk factors of atherosclerosis such as diabetes mellitus (DM), hypertension (HT), dyslipidemia frequently coexists with CKD, additionally novel risk factors specific to CKD such as volume overload, oxidative stress, inflammation, malnutrition, uremic toxins contribute to progression of atherosclerosis.Citation4–6 In CKD, arterial stiffness is a very important indicator of the onset of the atherosclerotic process.Citation7,Citation8
In simple terms, arterial stiffness refers to the rigidity of the arterial walls.Citation9 Patients with end state renal disease (ESRD) have much stiffer arteries than controls of the same age and blood pressure, however there is limited information regarding the prognostic value of arterial stiffness in patients with mild to moderate renal disease.Citation7 Measures of Pulse Wave Velocity (PWV) and augmentation index (Alx) are the two main methods for evaluating arterial stiffness.Citation8–11 In patients with ESRD, a reduction in PWV of 1 m/s with blood pressure control has been associated with a 21% reduction in the risk of cardiovascular death.Citation12 A decline in renal function affects sodium and therefore extracellular volume.Citation13 Volume overload leads to elevated PWV and Alx levels, although volume reduction and angiotensin-converting enzyme (ACE) inhibition both improve the aortic PWV and AIx, as demonstrated in hemodialysis patients.Citation14 Because of advances in non-invasive biotechnology, arterial stiffness can be easily evaluated by measuring PWV and Alx.Citation10 In this study, we aimed to evaluate PWV, AIx and volume status of the stage 3B-5 CKD and continuous ambulatory peritoneal dialysis (CAPD) patients comparing with healthy controls.
Materials and methods
Patients
One hundred twenty-one people, comprised of 21 patients on CAPD for at least 3 months, 66 patients with stage 3B-5 CKD and 34 healthy individuals (control group) were included in the study. The study was conducted between July and December 2011. All participants were informed and gave written informed consent to participate in the study.
Participants with active infections, valvular heart disease, coronary artery disease, peripheral artery disease, malignancy, metal valves, stents, metal sutures, or metal prosthesis were excluded from the study.
A physical examination was performed and their height, weight were measured. Characteristics of the patients such as age, sex, primary renal disease, existence of HT, DM, usage of medication, smoking, were obtained from the medical charts. The body mass index (BMI) was calculated by the weight (kg)/height (m2) formula.
Laboratory examination
Following a 12-h fasting period full blood count, serum creatinine, uric acid, calcium (Ca), phosphorus (P), parathyroid hormone (PTH), albumin, lipid levels were measured at the time of measuring arterial stiffness. Estimated glomerular filtration rate (eGFR) calculated by the short Modification of Diet in Renal Disease (MDRD) formula.
Arterial stiffness measurement
A single cuffed arteriograph device (I.E.M. GmbH brand Mobil-O-Graph PWA, a model pulse wave analysis device) was used for the arterial stiffness measurements, which is using a validated oscillometric technique. The participants included in the study were made to rest for 10 min before measurement, and were required not to smoke or drink any caffeinated beverages in the 30 min leading up to measurement. Prior to measurement, the date of birth, height, weight, and smoking status of each patient were entered into the software program of the device, and the cuff was attached to side of the upper arm with no fistulas on the brachial artery trace. The cuff was held in line with the heart, and the device took three measurements automatically at 30-s intervals.
The arteriograph first measures the blood pressure in the upper arm oscillometrically, afterwards produces a cuff pressure over the brachial artery that is 35 mmHg in excess of the systolic blood pressure measured. The pressure fluctuations in the brachial artery are now detected by the cuff.Citation15
As the central pressure changes, early (direct) systolic wave (P1), late (reflected) systolic wave (P2) and diastolic wave(s) (P3) reach this point and cause a beat on the membrane like a drumstick. These very small suprasystolic pressure changes are recorded by a high fidelity pressure sensor in the device.Citation16 The software of the arteriograph decomposes the early, late systolic and diastolic waves and also determines the onset and the peaks of the waves.Citation17 Using the integral software, augmentation pressure (AP) was calculated as the difference between the second and first systolic peaks, and AIx was calculated as AP expressed as a percentage of the pulse pressure. Heart rate and mean arterial pressure were obtained from the pressure waveform.Citation18 The device measures the time interval between the peaks of the direct (first) and reflected (late) systolic wave (return time—RT). Aortic PWV (PWVao) calculation, the distance from sternal notch to the upper edge of the pubic bone (Jugulum-Symphisis¼“Jug_Sy”) is used, in that this provides the nearest value of the true aortic length. The PWVao was calculated by using the formula:
The calculation of the central systolic blood pressure (CSBP) in the arteriograph was based on the relationship between the brachial and CSBP based on the late systolic wave amplitude.Citation16
Body composition and volume measurement
Body composition and volume status were assessed with a portable whole body bioimpedance spectroscopy device (BCM—Fresenius Medical Care D GmbH) which has been validated previously.Citation19 Electrodes were attached to one hand and one foot at the ipsilateral side, after the patient had been in recumbent position for at least 5 min. Peritoneal dialysis patients measurements performed with empty peritoneal cavity. All measurements were done by the same trained nurse.
The BCM measures the impedance spectroscopy at 50 different frequencies between 5 kHz and 1 MHz.Citation20,Citation21 The principle of measuring the flow of current through the body (impedance) is dependent on the frequency applied. At low frequencies, the current cannot bridge the cellular membrane and will pass predominantly through the extracellular space. At higher frequencies, penetration of the cell membrane occurs and the current is conducted by both the extracellular water (ECW) and intracellular water (ICW).Citation22 The fluid volumes ECW, ICW and total body water (TBW) were determined using the approach described by Moissl.Citation19 Volume status, lean tissue mass (LTM), and fat tissue mass (FTM) were calculated based on a physiologic tissue model described by Chamney.Citation23 Overhydration can be calculated from the difference between the normal ECW expected and the measured ECW. The LTM and FTM were normalized to the body surface area to obtain lean tissue index (LTI = LTM/height2) and fat tissue index (FTI = FTM/height2).Citation24
Statistical analysis
Statistical evaluations were carried out using the Statistical Package for Social Sciences for Windows version 17 (SPSS Inc; Chicago, IL) packet program. The accordance of quantitative data with normal distribution was examined with the Kolmogorov–Smirnov test. For the data found to be in accordance with the normal distribution, a one-way analysis of variance was used for comparison between groups, Tukey or Tamhane tests were used according to homogeneity of the variance for multiple comparisons, and the definitive statistics were indicated as mean ± standard deviation. For the data that was not in accordance with the normal distribution, a Kruskal–Wallis test was used to make comparison between groups, and a Dunn test was used multiple comparisons. The definitive statistics were indicated as median (25–75 percentile) or mean ± standard deviation. The relationship between the variables was examined with the Pearson Correlation Coefficient. Multiple linear regression analysis was used to evaluate the contribution of each risk factor to the median PWV. p Values of <0.05 were considered significant.
Approval of the ethics committee
The study was presented to local ethics committee of clinical research and has received approval with decision number B.30.2.ADÜ.0.01.00/050.04-49, dated 24.06.2011.
Results
Of the 121 participants in the study, 66 had stage 3B-5 CKD (not yet initiated dialysis), 21 were on CAPD (for at least 3 months), and 34 were healthy control subjects. Demographic and clinical characteristics of the participants are shown in .
Table 1. Demographic and clinical characteristics of the study groups.
The median PWV values recorded by Mobil-O-Graph were 7.5 m/s in stage 3B-5 CKD patients, 6.2 m/s in CAPD patients and 5.9 m/s in healthy controls. The PWV values were significantly higher in stage 3B-5 CKD patients than the others (p = 0.002), while no significant difference was found between CAPD patients and healthy controls ().
Figure 1. Pulse wave velocity median values of the groups. [PWV; median (25–75 percentile) ± min, max value; *: difference between CKD patients and CAPD and control group, p = 0.002].
![Figure 1. Pulse wave velocity median values of the groups. [PWV; median (25–75 percentile) ± min, max value; *: difference between CKD patients and CAPD and control group, p = 0.002].](/cms/asset/d7bbcb08-028a-4900-ac38-581f62544dd4/irnf_a_830224_f0001_b.jpg)
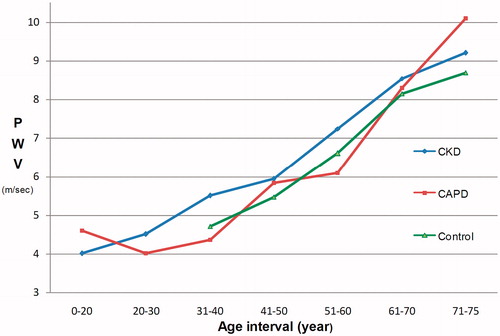
In analysis according to age interval, PWV values in 41–50-year-old interval were 5.93 m/s in CKD, 5.83 m/s in CAPD, and 5.47 m/s in healthy controls. An increase in PWV values with age was recorded in all groups, however, the difference was not statistically significant (). Age and CSBP adjusted univariate analysis confirmed that PWV was higher in CKD group than healthy controls (p = 0.002). Overhydration adjusted analysis showed that PWV was higher in CKD group than CAPD group (p = 0.019).
Figure 2. Mean pulse wave velocity of the groups by age.
Blood pressure, pulse pressure measurements were statistically higher in CKD group than the control group. Central pulse pressure (CPP) was significantly higher in CKD group than the others (p = 0.018). Augmentation pressure, Alx normalized with 75/min heart rate (Alx@75) values were the same in all groups ().
The median extracellular fluid excess was higher in both the CKD and CAPD patients when compared with healthy controls (1.26 and 1.21 L, respectively) and overhydration was found in both CKD and CAPD patients (p < 0.001; ).
Figure 3. Overhydration of the groups. [Overhydration; median (25–75 percentile) ± min, max value; f: difference between Control group and CKD and CAPD patients, p < 0.001].
![Figure 3. Overhydration of the groups. [Overhydration; median (25–75 percentile) ± min, max value; f: difference between Control group and CKD and CAPD patients, p < 0.001].](/cms/asset/e197dd6a-3d57-48dd-8872-feb706e5e24d/irnf_a_830224_f0003_b.jpg)
Total Body Water, ECW, FTI, FTM measurements showed no difference between the three groups; while body cell mass, LTM, LTI, ICW values were significantly lower in the CAPD group ().
Table 2. Body composition measurement of groups.
Uric acid (p < 0.001) and triglyceride (p = 0.005) levels were higher in the CKD group than the control (p < 0.001). The median albumin level was 0.3 g/dL and 0.8 g/dL lower than the control group in CKD and CAPD groups, respectively, and was statistically significant (p < 0.001). The albumin level in CKD group was higher than the CAPD group (p < 0.001; ).
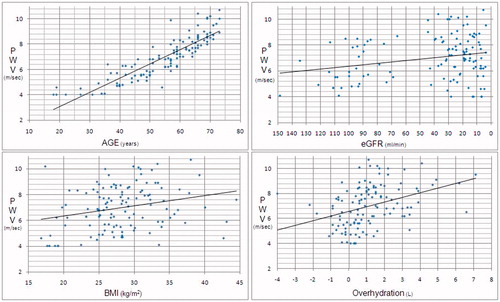
In an analysis of all groups, PWV was correlated positively with age (p < 0.001, r = 0.881), excess fluid (p < 0.001, r = 0.372), CSBP (p < 0.001, r = 0.493), CPP (p < 0.001, r = 0.484), AP (p < 0.001, r = 0.326), FTI (p = 0.003, r = 0.271), FTM (p = 0.003, r = 0.264), BMI (p = 0.004, r = 0.259), and negatively with eGFR (p = 0.008, r = −0.241) and LTI (p = 0.025, r = −0.204; ).
Figure 4. Correlation of pulse wave velocity with age, eGFR, BMI, overhydration.
To identify determinants of PWV, a multivariate regression analysis performed, and found that increased PWV was independently associated with age, CSBP, CPP, eGFR, and FTI (p < 0.001, p < 0.001, p < 0.001, p = 0.001, p = 0.18, respectively; ).
Table 3. Multiple linear regression analysis between PWV and other variables.
Discussion
The shape, and the magnitude of the arterial waveform changes as the wave travels from the heart to the periphery. Pulse pressure increases as the pressure wave travels to the periphery; which is known as “pulse pressure augmentation”. This is a result of the interaction of the forward and backward (reflected) traveling pressure waves, which occur due to changes in vascular impedance. Changes in vascular impedance are attributable to branching, plate and changes in vascular calibration,Citation25,Citation26 although there are many accompanying factors such as heart rate,Citation27 height/gender,Citation28–30 medication,Citation31–34 HT, DM, and other standard CVD risk factors.Citation18
The relation between the arterial wave form and CKD progression was identified by Takenaka et al.,Citation35 who found that Alx positively correlated with age, weight, and negatively with heart rate, and a more significant decrease was determined in creatinine clearance of those with higher basal Alx values in a 1-year observation. It was found that AIx, an important measurement of arterial compliance, increases with age until about 55 years and slows down to a plateau thereafter. However, AP continues to increase steadily with age, suggesting that AP should be measured in the elderly and not Alx.Citation36 In order to easily evaluate the Alx in different heart rates, Alx is often normalized to an heart rate of 75 beats/min.Citation37 It has been demonstrated that central AIx and aortic PWV are differentially affected by aging, and that central AIx may be a more sensitive marker of arterial aging in younger individuals, while PWVao more sensitive in those over 50 years of age.Citation38 Although no difference was found between the groups in terms of Alx@75 and AP, the highest Alx@75 values were recorded in the CKD group, while the lowest were seen in control group. In CKD group, the median age was 59 years, leading to the conclusion that an advanced age had an effect on Alx results.
A positive correlation has been demonstrated previously between PWV with age, systolic BP, and negatively with eGFR in CKD patients.Citation39,Citation40 Similar correlation was identified between PWV with age, eGFR, CSBP, CPP were found in our results consistent with these previous studies. Wang et al.Citation41 showed that SBP, eGFR were the major determinants of arterial stiffness. Multivariate analyses of our results have shown that PWV is independently associated with age, CSBP, CPP, EGFR, while age adjusted analyses found that PWV greater in CKD. This leads to the conclusion that CKD is a significant marker of arterial stiffness.
Patients on peritoneal dialysis or hemodialysis had better PWV and AIx than predialysis stage 5 CKD patients, indicating that dialysis may improve arterial stiffness.Citation42 Arterial stiffness in dialysis patients could be related to molecules such as homocysteine, advanced glycation end products (AGE), asymmetrical dimethyl arginine (ADMA) which are known to accumulate in the uremic plasma and have a negative effect on vascular functions, may be removed with dialysis treatment.Citation42,Citation43 While our study showed a significant elevation PWV in CKD than the other groups, no significant difference was founded between the CAPD and control groups. These findings are consistent with literature, that dialysis treatment can improve arterial stiffness. Having better arterial stiffness parameters in CAPD than the CKD group may be due to removal of uremic toxins by dialysis.
Chamney et al.Citation23 defined the three-compartment model for body composition; according to this, the body comprises of excess fluid, normally hydrated lean tissue and normally hydrated adipose tissue.
It has been demonstrated that LTM was not a determinant of PWV in elderly. Benetos et al.Citation44 showed that elderly men with high LTM and low FTM exhibit the lowest arterial stiffness. Truncal obesity is closely related with cardiovascular disease risk, DM and HT. Six-year follow-up of a study revealed that increases in trunk mass and decreases in peripheral fat mass are associated with accelerated arterial stiffening.Citation45 In our study, a positive relationship between PWV with fat mass and BMI, negative with LTI was found, indicating that fat mass is important for increasing PWV and affected arterial stiffness.
The excess fluid detected by multi-frequency bio-impedance is related to mortality, malnutrition, inflammation and atherosclerosis in dialysis patients.Citation24,Citation46 An independent relation has been identified between the PWV and ECW/TBW ratio in peritoneal dialysis and hemodialysis patients. It has been shown that excess fluid plays an important role in the development of arterial stiffness in dialysis patients by increasing arterial distension and systolic blood pressure.Citation47,Citation48 A positive strong correlation has been determined between PWV and excess fluid in our study, suggesting that excess fluid leads to an increase of arterial stiffness and cardiovascular diseases.
Conclusion
Our study has shown that PWV is found to increase in stage 3-5 CKD patients more than CAPD patients. Age, CSBP, BMI, fat mass, overhydration, CKD, eGFR, are the major determinants of PWV. Hypervolemia treatment in CKD patients may be useful to improve arterial stiffness. There is an increase in arterial stiffness in uremic patients. To reduce the risk of cardiovascular death further studies are needed, aimed at reducing arterial stiffness.
Declaration of interest
The authors report no conflicts of interest. The authors alone are responsible for the content and writing of the article.
References
- National Kidney Foundation. K/DOQI Clinical Practice Guidelines for Chronic Kidney Disease: evaluation, Classification and Stratification. Am J Kidney Dis. 2002;39:1–266
- Foley RN, Parfrey PS, Sarnak MJ. Clinical epidemiology of cardiovascular disease in chronic renal disease. Am J Kidney Dis. 1998;32:112–119
- Süleymanlar G, Utas C, Arınsoy T, et al. A population-based survey of chronic renal disease in Turkey—the CREDIT study. Nephrol Dial Transplant. 2011;26:1862–1871
- Third Report of the Expert Panel on Detection, Evaluation, and Treatment of High Blood Cholesterol in Adults (ATP III Final Report). NIH Publication No. 02-5215; 2002:1-284. Available at: http://www.nhlbi.nih.gov/guidelines/cholesterol/atp3full.pdf Accessed 17 November 2011
- Locatelli F, Pozzoni P, Tentori F, del Vecchio L. Epidemiology of cardiovascular risk in patients with chronic kidney disease. Nephrol Dial Transplant. 2003;18:Vii2–9
- Schiffrin EL, Lipman ML, Mann JF. Chronic kidney disease: effects on the cardiovascular system. Circulation. 2007;116:85–97
- Sakuragi S, Abhayaratna WP. Arterial stiffness: methods of measurement, physiologic determinants and prediction of cardiovascular outcomes. Int J Cardiol. 2010;138:112–118
- Wang X, Keith JC Jr, Struthers AD, Feuerstein GZ. Assessment of arterial stiffness, a translational medicine biomarker system for evaluation of vascular risk. Cardiovasc Ther. 2008;26:214–223
- Mackenzie IS, Wilkinson IB, Cockcroft JR. Assessment of arterial stiffness in clinical practice. QJM. 2002;95:67–74
- Shirwany NA, Zou M. Arterial stiffness: a brief review. Acta Pharmacol Sin. 2010;31:1267–1276
- Davies JI, Struthers AD. Pulse wave analysis and pulse wave velocity: a critical review of their strengths and weaknesses. J Hypertens. 2003;21:463–472
- Guerin AP, Blacher J, Pannier B, Marchais SJ, Safar ME, London GM. Impact of aortic stiffness attenuation on survival of patients in end-stage renal failure. Circulation. 2001;103:987–992
- Charra B, Chazot C. Volume control, blood pressure and cardiovascular function. Lessons from hemodialysis treatment. Nephron Physiol. 2003;93:94–101
- Tycho Vuurmans JL, Boer WH, Bos WJ, Blankestijn PJ, Koomans HA. Contribution of volume overload and angiotensin II to the increased pulse wave velocity of hemodialysis patients. J Am Soc Nephrol. 2002;13:177–183
- Jatoi NA, Mahmud A, Bennett K, Feely J. Assessment of arterial stiffness in hypertension: comparison of oscillometric (Arteriograph), piezoelectronic (Complior) and tonometric (SphygmoCor) techniques. J Hypertens. 2009;27:2186–2191
- Horváth IG, Németh A, Lenkey Z, et al. Invasive validation of a new oscillometric device (Arteriograph) for measuring augmentation index, central blood pressure and aortic pulse wave velocity. J Hypertens. 2010;28:2068–2075
- Baulmann J, Schillings U, Rickert S, et al. A new oscillometric method for assessment of arterial stiffness: comparison with tonometric and piezo-electronic methods. J Hypertens. 2008;26:523–528
- McEniery CM, Yasmin, McDonnell B, et al.; Anglo-Cardiff Collaborative Trial Investigators. Central pressure: variability and impact of cardiovascular risk factors the Anglo-Cardiff Collaborative Trial II. Hypertension. 2008;51:1476–1482
- Moissl UM, Wabel P, Chamney PW, et al. Body fluid volume determination via body composition spectroscopy in health and disease. Physiol Meas. 2006;27:921–933
- Van Biesen W, Williams JD, Covic AC, et al.; EuroBCM Study Group. Fluid status in peritoneal dialysis patients: the European Body Composition Monitoring (EuroBCM) study cohort. PLoS One. 2011;6(2):e17148
- Wabel P, Chamney P, Moissl U, Jirka T. Importance of whole-body bioimpedance spectroscopy for the management of fluid balance. Blood Purif. 2009;27:75–80
- De Lorenzo A, Andreoli A, Matthie J, Withers P. Predicting body cell mass with bioimpedance by using theoretical methods: a technological review. J Appl Physiol. 1997;82(5):1542–1558
- Chamney PW, Wabel P, Moissl UM, et al. A whole-body model to distinguish excess fluid from the hydration of major body tissues. Am J Clin Nutr. 2007;85:80–89
- Wizemann V, Wabel P, Chamney P, et al. The mortality risk of overhydration in hemodialysis patients. Nephrol Dial Transplant. 2009;24(5):1574–1579
- Davies JI, Struthers AD. Pulse wave analysis and pulse wave velocity: a critical review of their strengths and weaknesses. J Hypertens. 2003;21:463–472
- Cohen DL, Townsend RR. Central blood pressure and chronic kidney disease progression. Int J Nephrol. 2011;2011:1–7
- Wilkinson IB, MacCallum H, Flint L, Cockcroft JR, Newby DE, Webb DJ. The influence of heart rate on augmentation index and central arterial pressure in humans. J Physiol. 2000;525:263–270
- Marchais SJ, Guerin AP, Pannier BM, Levy BI, Safar ME, London GM. Wave reflections and cardiac hypertrophy in chronic uremia: influence of body size. Hypertension. 1993;22:876–883
- Yasmin, Brown MJ. Similarities and differences between augmentation index and pulse wave velocity in the assessment of arterial stiffness. Q J Med. 1999;92:595–600
- Mills CJ, Gabe IT, Gault JH, et al. Pressure-flow relationships and vascular impedance in man. Cardiovasc Res. 1970;4:405–417
- Mahmud A, Feely J. Favourable effects on arterial wave reflection and pulse pressure amplification of adding angiotensin II receptor blockade in resistant hypertension. J Hum Hypertens. 2000;14:541–546
- Dart AM, Reid CM, McGrath B. Effects of ACE inhibitor therapy on derived central arterial waveforms in hypertension. Am J Hypertens. 2001;14:804–810
- Chen CH, Ting CT, Lin SJ, et al. Different effects of fosinopril and atenolol on wave reflections in hypertensive patients. Hypertension. 1995;25:1034–1041
- Protogerou AD, Stergiou GS, Vlachopoulos C, Blacher J, Achimastos A. The effect of antihypertensive drugs on central blood pressure beyond peripheral blood pressure. Part II: evidence for specific class-effects of antihypertensive drugs on pressure amplification. Curr Pharm Des. 2009;15:272–289
- Takenaka T, Mimura T, Kanno Y, Suzuki H. Qualification of arterial stiffness as a risk factor to the progression of chronic kidney diseases. Am J Nephrol. 2005;25:417–424
- Fantin F, Mattocks A, Bulpitt CJ, Banya W, Rajkumar C. Is augmentation index a good measure of vascular stiffness in the elderly? Age Ageing 2007;36:43–48
- Nelson MR, Stepanek J, Cevette M, Covalciuc M, Hurst RT, Tajik AJ. Noninvasive measurement of central vascular pressures with arterial tonometry: clinical revival of the pulse pressure waveform? Mayo Clin Proc. 2010;85:460–472
- McEniery CM, Yasmin, Hall IR, Qasem A, Wilkinson IB, Cockcroft JR; ACCT Investigators. Normal vascular aging: differential effects on wave reflection and aortic pulse wave velocity: the Anglo-Cardiff Collaborative Trial (ACCT). J Am Coll Cardiol. 2005;46:1753–1760
- Mourad JJ, Pannier B, Blacher J, et al. Creatinine clearance, pulse wave velocity, carotid compliance and essential hypertension. Kidney Int. 2001;59(5):1834–1841
- Matsuda N, Takei T, Fujiu A, Ogawa T, Nitta K. Arterial stiffness in patients with non-diabetic chronic kidney disease (CKD). J Atheroscler Thromb. 2009;16(1):57–62
- Wang MC, Tsai WC, Chen JY, Huang JJ. Stepwise increase in arterial stiffness corresponding with the stages of chronic kidney disease. Am J Kidney Dis. 2005;45:494–501
- Yang L, Lin Y, Ye C, et al. Effects of peritoneal dialysis and hemodialysis on arterial stiffness compared with predialysis patients. Clin Nephrol. 2011;75:188–194
- Shinohara K, Shoji T, Tsujimoto Y, et al. Arterial stiffness in predialysis patients with uremia. Kidney Int. 2004;65(3):936–943
- Benetos A, Zervoudaki A, Kearney-Schwartz A, et al. Effects of lean and fat mass on bone mineral density and arterial stiffness in elderly men. Osteoporos Int. 2009;20:1385–1391
- Schouten F, Twisk JW, de Boer MR, et al. Increases in central fat mass and decreases in peripheral fat mass are associated with accelerated arterial stiffening in healthy adults: the Amsterdam Growth and Health Longitudinal Study. Am J Clin Nutr. 2011;94(1):40–48
- Demirci MS, Demirci C, Ozdogan O, et al. Relations between malnutrition-inflammation-atherosclerosis and volume status. The usefulness of bioimpedance analysis in peritoneal dialysis patients. Nephrol Dial Transplant. 2011;26:1708–1716
- Zheng D, Cheng LT, Zhuang Z, Gu Y, Tang LJ, Wang T. Correlation between pulse wave velocity and fluid distribution in hemodialysis patients. Blood Purif. 2009;27(3):248–252
- Zhe XW, Tian XK, Chen W, et al. Association between arterial stiffness and peritoneal fluid kinetics. Am J Nephrol. 2008;28:128–132