
Abstract
This study was aimed at revealing the factors and the interrelationships between factors on microalbuminuria development among type 2 diabetes (T2D) patients. Between 2004 and 2011, 461 T2D patients with a baseline urine albumin-to-creatinine ratio (UACR) of <30 mg/g, and an estimated glomerular filtration rate (eGFR) of >60 mL/min were evaluated retrospectively. Sixty-eight (14.8%) subjects had developed microalbuminuria in a mean follow-up of 6.82 years. Statistical analysis had revealed that the higher baseline UACR (10 mg/g; sensitivity, 80.9%, specificity, 63.6%; AUC = 0.774) and glycohemoglobin level (HbA1c) (8%; sensitivity, 72.1%, specificity, 61.6%; AUC = 0.698) were the two independent microalbuminuria risk factors. When considering the risk of microalbuminuria, the data were normalized with respect to subjects with low-normal UACR (<10 mg/g) and HbA1c < 8%. The adjusted hazard ratio for subjects with low-normal UACR/HbA1c > 8%, high-normal UACR/HbA1c < 8%, and high-normal UACR/HbA1c >8% were 2.59 (p = 0.107), 6.15 (p = 0.001), and 16.96 (p < 0.001), respectively. It was determined that an increase of HbA1c levels (<8, 8–9, 9–10, >10%) showed a progressively increase of the hazard risk in baseline high-normal UACR group. But the same correlation was not shown in the low-normal UACR group. This study identified the relationships of high-normal albuminuria and glycemic control on microalbuminuria development among T2D patients. Glycemic control is especially beneficial for T2D patients with baseline high-normal UACR in preventing microalbuminuria development.
Introduction
Diabetic nephropathy is the leading cause of chronic kidney disease (CKD) and dialysis.Citation1,Citation2 Medical costs have increased along with the progression of diabetic nephropathy, and the prevalence of diabetic nephropathy is responsible for the great burden on the healthcare systems worldwide.Citation3,Citation4 In Taiwan, the prevalence of diabetic nephropathy and diabetes-related dialysis is increasing, according to the most recent nationwide investigation.Citation2
The presence of albuminuria is an indicator of renal impairment.Citation5,Citation6 Microalbuminuria, defined as urine albumin excretion rate (UAER) of 20–200 μg/min or urine albumin-to-creatinine ratio (UACR) of 30–300 mg/g, has been considered as incipient diabetic nephropathy and the forerunner of overt diabetic nephropathy.Citation5 Therefore, the early detection of microalbuminuria risks can help in delaying or preventing diabetic nephropathy. Previous studies had revealed that various factors such as baseline albuminuria,Citation7–9 glucose level,Citation8,Citation10 glucose variabilityCitation11 and insulin resistanceCitation12 can be used in assessing microalbuminuria risks.
In this study, we found that baseline high-normal UACR and glycohemoglobin (HbA1c) levels were the two independent factors that influence microalbuminuria development. And further correlations between these two factors were investigated in our study.
Materials and methods
Data collection
This study was conducted with a sample population that consists of 11,414 type 2 diabetes mellitus (T2D) subjects from the diabetes shared care system in Chang Gung Memorial Hospital, a 3500-bed tertiary medical center, in northern Taiwan. All subjects in the shared care system were routinely monitored for serum glucose levels, HbA1c levels, lipid profiles, and creatinine levels for at least four times a year. The patients’ UACR and indirect eye fundus were also examined at least once a year. The selection criteria in selecting the study subjects were two consecutive UACRs of <30 mg/g and an estimated glomerular filtration rate of (eGFR; Modification of Diet in Renal Disease) >60 mL/min which occurred in 2004–2005. Patients with severe heart, lung, and liver diseases or cancer comorbidities were excluded. A total of 461 patients were enrolled in this study. The patients who had a UACR of >30 mg/g in two consecutive urine tests prior to 2012 were defined as microalbuminuria patients. This research was approved by the institutional review board of Chang Gung Memorial hospital. The average follow-up duration was 6.82 ± 0.79 years.
The glycemic, blood pressure, and lipid control treatments for the subjects were performed according to the American Diabetes Association (ADA) guidelines.Citation13 Most of patients with hypertension were treated with angiotensin-converting enzyme inhibitors (ACEIs) or angiotensin II receptor blockers (ARBs).
The demographic data, blood pressure, body mass index, medications for hyperglycemia and hypertension, and retinopathy at the time of enrollment were reviewed on each patient’s medical chart records.
Statistical analysis
The Mann–Whitney U-test and Pearson’s chi-squared test were used to examine the continuous and categorical variables, respectively. Binary logistic regression was then used to explore the relationship between the covariates of interest and microalbuminuria. Receiver operating characteristic (ROC) curve was used in determining the cutoff point as well as assessing the predictive performance for the significant risk factors found in the binary logistic regression.
Cox regression hazard model was used to explore the association between independent risk factors and the development of microalbuminuria. Covariates that were related to the development of microalbuminuria or that were considered relative to the microalbuminuria development were adjusted. A two-sided p values of <0.05 were considered statistically significant. All calculations were performed using Statistical Package for the Social Sciences (SPSS) version 19.0 software (IBM Corp., Armonk, NY)
Results
The baseline clinical characteristics of the 461 subjects (232 men and 229 women) are shown in . The mean subject age was 55.77 ± 9.74 years, the mean diabetes duration was 8.15 ± 6.28 years, the mean HbA1c value was 7.92 ± 1.28%, and the mean UACR level was 10.65 ± 5.27 mg/g. During the follow-up of 6.82 ± 0.79 years, 68 (14.8%) subjects developed microalbuminuria. The average annual incidence of microalbuminuria development was 2.17%.
Table 1. Demographic data of the 461 patients with normoalbuminuria; and a comparison between patients who had stable normoalbuminuria and patients who developed microalbuminuria over 6.82 years.
The univariate analysis indicated that, in comparison to that of a normoalbuminuria group, the microalbuminuria development group had longer diabetes duration (9.34 vs. 7.95 years), had more subjects on insulin therapy (32.4% vs. 14.2%), had a poorer glycemic control (8.71% vs. 7.78%), and had a higher baseline UACR (15.31 mg/g vs. 9.85 mg/g) (). Though more hypertension subjects were included (44.1% vs. 34.4%) in the microalbuminuria development group (p = 0.052), the average blood pressure levels were similar between the microalbuminuria and control groups. There were a total of 165 subjects that had hypertension, and the mean systolic/diastolic blood pressure was 134/76 mmHg after treatment. Among the hypertension subjects, 80% (132/165) of which was treated with ACEIs or ARBs.
Binary logistic regression was used for analyzing the significant risk factors reported in the univariate analysis or in previous cohort studies, and the result demonstrated that a higher baseline UACR (OR 1.18, 95% CI 1.11–1.26, p < 0.001) and HbA1c (OR 1.38, 95% CI 1.04–1.83, p < 0.024) levels were the two independent risk factors in microalbuminuria development ().
Table 2. Results of binary logistic regression analysis of significant or interesting microalbuminuria risk factors.
Using the ROC curve analysis and Youden index, the cutoff point chosen for UACR and HbA1c were 10 mg/g (sensitivity, 80.9%; specificity, 63.6%; AUC = 0.774, CI = 0.72–0.83) and 8.0% (sensitivity, 72.1%; specificity, 61.6%; AUC = 0.698, CI = 0.63–0.77), respectively. Therefore, we defined the baseline UACR of 10–29.9 mg/g as high-normal, and <10 mg/g as low-normal albuminuria.
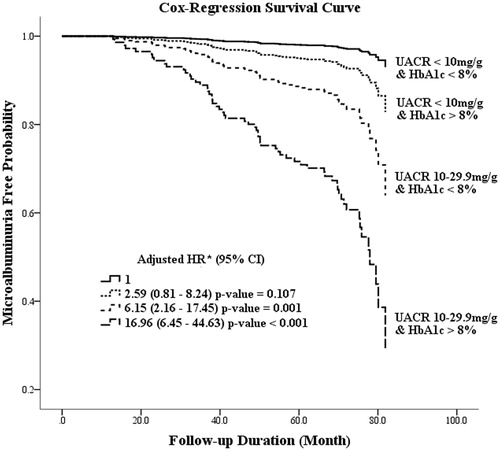
When considering the risk of microalbuminuria in subjects, the analysis was normalized with respect to low-normal UACR (<10 mg/g) and HbA1c < 8%. The adjusted hazard ratio (HR) for subjects with low-normal UACR/HbA1c > 8%, high-normal UACR/HbA1c < 8% and high-normal UACR/HbA1c > 8% were 2.59 (p = 0.107), 6.15 (p = 0.001), and 16.96 (p < 0.001), respectively (). The impact of HbA1c > 8% was not statistically significant for microalbuminuria development in patients with low-normal UACR. However, a HbA1c level of >8.0% correlates significantly with the risk of microalbuminuria development among patients with high-normal baseline albuminuria (adjusted HR = 2.89; p = 0.002, data not shown).
Figure 1. The result of Cox regression hazard model in microalbuminuria free probability between the various UACR and HbA1c subgroups. Adjusted for age, gender, diabetes duration, body mass index, blood pressure, cholesterol, and the use of angiotensin-converting enzyme inhibitors or angiotensin II receptor blockers. *CI: confidence interval; HR: hazard ratio.
In evaluating the impact of glycemic control, subjects in both of the low-normal and high-normal UACR subgroups were analyzed by stratifying the HbA1c levels into four subgroups, that is, <8%, 8–9%, 9–10%, and >10% (). The annual incidence microalbuminuria rate, in patients of low-normal and high-normal UACR subgroups, was found to correlate positively with the increase in HbA1c levels. Also, the high-normal UACR subgroup, but not the lower-normal UACR subgroup, had shown statistical differences in adjusted HRs for microalbuminuria development, according to the graduated deterioration of glycemic control (). Moreover, the baseline UACR had a consistent impact in patients with both high (>8%) or low (<8%) HbA1c levels ().
Table 3. The Cox regression model analysis and average annual incidence rate of microalbuminuria development in various UACR and HbA1c level subgroups.
Table 4. The Cox regression model analysis and average annual incidence rate of microalbuminuria development in various HbA1c and UACR level subgroups.
Discussion
There was no consensus among the microalbuminuria influencing factors shown in previous studies; however, a higher normal baseline albuminuria and glucose levels were found to be the most common factors associated with microalbuminuria development in diabetic patients.Citation7–9,Citation14–16 In this study, we determined the interrelationships between these two factors that were not previously shown. High-normal albuminuria level has a significant impact on microalbuminuria development among patients with any baseline levels of HbA1c. While glycemic control has a higher impact on subjects that already have a high-normal baseline albuminuria. Furthermore, this glycemic control effect was not observed for patients with low-normal albuminuria.
The traditional definition of normal albuminuria was defined by UACR below 30 mg/g or UAER below 20 μg/min. This range was chosen according to 95% of upper bound range of “normal” individuals.Citation17 Some studies have shown that diabetes patients with higher levels of normal albuminuria have higher risks of cardiovascular events.Citation17–19 Furthermore, the BErgamo NEphrologic Diabetes Complications Trial (BENEDICT) had shown that a high-normal albuminuria is the strongest predictor for the onset of microalbuminuria in patients with type 2 diabetes.Citation20,Citation21 Nevertheless, there was no consensus among the studies for a clearly defined optimal threshold of “high-normal” albuminuria in discriminating microalbuminuria development.Citation7–9,Citation14–16 Medical attention should be aroused for patients with higher normal albuminuria to prevent its ongoing kidney deterioration.
Glycemic control plays as vital role in diabetic microvascular complications. It was shown that for each 1% reduction in updated mean of HbA1c was associated with a 37% reduction in microvascular complication risks.Citation22 In patients with high cardiovascular risks, intensive glycemic control failed to be effective in preventing cardiovascular complications. However, the intensive glycemic control can still have certain benefits on prevention of diabetic nephropathy in these patients with high cardiovascular risks.Citation23,Citation24 The implementation of glycemic control may have different benefits affecting different stages of diabetic nephropathy. There was no randomized control trial proving that intensive glycemic control can benefit in slowing diabetic nephropathy progression during the late stages of diabetic nephropathy (macroalbuminuria stage or CKD stage 3–5) among type 2 diabetes.Citation25 The United Kingdom Prospective Diabetes Study (UKPDS) studyCitation10 had shown that glycemic control can have a significant 24% risk reduction, when used as the primary microalbuminuria prevention method for patients with normoalbuminuria. Nevertheless, there were studiesCitation7,Citation9 that did not reveal glucose control as a good indicator for predicting microalbuminuria development. Therefore, we believe that the interrelationships among the different factors may affect their prediction power.
In our study, we identified the baseline UACR is a strong predictor in determining microalbuminuria. The baseline UACR had demonstrated high impacts on subjects with both low and high HbA1c baseline levels. The HbA1c level exhibited impact on patients with high-normal baseline UACR. But the HbA1c level had shown no significance for patients with low-normal albuminuria. It is difficult to explain why subjects with high-normal UACR were more vulnerable to glycemic insults than those in low-normal UACR. Future studies are needed to further investigate the pathophysiological mechanism.
The microalbuminuria incidence rate in this study was 14.8% during the 6.82 years follow-up (averaged 2.17% per year). The annual incidence was similar to the results of the UKPDS study,Citation10 in which that 2% of normoalbuminuria patients developed microalbuminuria per year. However, the cumulative incidence in our study was far less than that of the other cohort studies.Citation8,Citation9,Citation15,Citation16 This disparity may arise from the fact that our study has a shorter follow-up duration, and also 80% of our hypertension subjects had received ACEI/ARB treatments.Citation26,Citation27 This study was limited by its retrospective entity as well as certain missing data such as smoking.
In conclusion, we had shown that both the baseline UACR and the glycohemoglobin levels are indicators for microalbuminuria development among type 2 diabetes patients. Glycemic control is especially important in slowing microalbuminuria progression among patients with high-normal UACR.
Declaration of interest
The authors report no conflicts of interest. The authors alone are responsible for the content and writing of the paper.
This research was supported by a grant (CMRPG380293) from the Chang Gung Memorial Hospital to Yu-Yao Huang.
Acknowledgements
We thank statisticians Y. Z. Lin, diabetes educator Q. P. Chen, and S.Y. Peng, C.C. Hung in laboratory medicine department for collecting and analyzing the data.
References
- Prevention CfDCa. National diabetes fact sheet: national estimates and general information on diabetes and prediabetes in the United States, 2011. Atlanta, GA: U.S; 2011
- Huang YY, Lin KD, Jiang YD, et al. Diabetes-related kidney, eye, and foot disease in Taiwan: an analysis of the nationwide data for 2000–2009. J Formos Med Assoc. 2012;111(11):637–644
- Yang WC, Hwang SJ, Chiang SS, Chen HF, Tsai ST. The impact of diabetes on economic costs in dialysis patients: experiences in Taiwan. Diabetes Res Clin Pract. 2001;54(Suppl 1):S47–S54
- Nichols GA, Vupputuri S, Lau H. Medical care costs associated with progression of diabetic nephropathy. Diabetes Care. 2011;34(11):2374–2378
- Mogensen CE, Christensen CK, Vittinghus E. The stages in diabetic renal disease. With emphasis on the stage of incipient diabetic nephropathy. Diabetes. 1983;32(Suppl 2):64–78
- Nelson RG, Bennett PH, Beck GJ, et al. Development and progression of renal disease in Pima Indians with non-insulin-dependent diabetes mellitus. Diabetic Renal Disease Study Group. N Engl J Med. 1996;335(22):1636–1642
- Rachmani R, Levi Z, Lidar M, et al. Considerations about the threshold value of microalbuminuria in patients with diabetes mellitus: lessons from an 8-year follow-up study of 599 patients. Diabetes Res Clin Pract. 2000;49(2–3):187–194
- Murussi M, Baglio P, Gross JL, Silveiro SP. Risk factors for microalbuminuria and macroalbuminuria in type 2 diabetic patients: a 9-year follow-up study. Diabetes Care. 2002;25(6):1101–1103
- Murussi M, Campagnolo N, Beck MO, Gross JL, Silveiro SP. High-normal levels of albuminuria predict the development of micro- and macroalbuminuria and increased mortality in Brazilian Type 2 diabetic patients: an 8-year follow-up study. Diabet Med. 2007;24(10):1136–1142
- Adler AI, Stevens RJ, Manley SE, et al. Development and progression of nephropathy in type 2 diabetes: the United Kingdom Prospective Diabetes Study (UKPDS 64). Kidney Int. 2003;63(1):225–232
- Hsu CC, Chang HY, Huang MC, et al. HbA1c variability is associated with microalbuminuria development in type 2 diabetes: a 7-year prospective cohort study. Diabetologia. 2012;55(12):3163–3172
- Hsu CC, Chang HY, Huang MC, et al. Association between insulin resistance and development of microalbuminuria in type 2 diabetes: a prospective cohort study. Diabetes Care. 2011;34(4):982–987
- American Diabetes A. Standards of medical care in diabetes. Diabetes Care. 2004;27(Suppl 1):S15–35
- John L, Rao PS, Kanagasabapathy AS. Rate of progression of albuminuria in type II diabetes. Five-year prospective study from south India. Diabetes Care. 1994;17(8):888–890
- Gall MA, Hougaard P, Borch-Johnsen K, Parving HH. Risk factors for development of incipient and overt diabetic nephropathy in patients with non-insulin dependent diabetes mellitus: prospective, observational study. BMJ. 1997;314(7083):783–788
- Forsblom CM, Groop PH, Ekstrand A, et al. Predictors of progression from normoalbuminuria to microalbuminuria in NIDDM. Diabetes Care. 1998;21(11):1932–1938
- Forman JP, Brenner BM. ‘Hypertension' and ‘microalbuminuria': the bell tolls for thee. Kidney Int. 2006;69(1):22–28
- Wachtell K, Ibsen H, Olsen MH, et al. Albuminuria and cardiovascular risk in hypertensive patients with left ventricular hypertrophy: the LIFE study. Ann Intern Med. 2003;139(11):901–906
- Gerstein HC, Mann JF, Yi Q, et al. Albuminuria and risk of cardiovascular events, death, and heart failure in diabetic and nondiabetic individuals. JAMA. 2001;286(4):421–426
- Ruggenenti P, Fassi A, Ilieva AP, et al. Preventing microalbuminuria in type 2 diabetes. N Engl J Med. 2004;351(19):1941–1951
- Ruggenenti P, Remuzzi G. Time to abandon microalbuminuria? Kidney Int. 2006;70(7):1214–1222
- Stratton IM, Adler AI, Neil HA, et al. Association of glycaemia with macrovascular and microvascular complications of type 2 diabetes (UKPDS 35): prospective observational study. BMJ. 2000;321(7258):405–412
- , Action to Control Cardiovascular Risk in Diabetes Study GroupGerstein HC, Miller ME, et al. Effects of intensive glucose lowering in type 2 diabetes. N Engl J Med. 2008;358(24):2545–2559
- Group AC, Patel A, MacMahon S, et al. Intensive blood glucose control and vascular outcomes in patients with type 2 diabetes. N Engl J Med. 2008;358(24):2560–2572
- Jun M, Perkovic V, Cass A. Intensive glycemic control and renal outcome. Contrib Nephrol. 2011;170:196–208
- Bilous R, Chaturvedi N, Sjolie AK, et al. Effect of candesartan on microalbuminuria and albumin excretion rate in diabetes: three randomized trials. Ann Intern Med. 2009;151(1):11–20, W13–14
- Haller H, Ito S, Izzo JL Jr, et al. Olmesartan for the delay or prevention of microalbuminuria in type 2 diabetes. N Engl J Med. 2011;364(10):907–917