
Abstract
Background: Diabetic nephropathy (DN) is associated with a high risk of progression to End Stage Renal Disease (ESRD). While obesity has been identified as a factor in the decline of the glomerular filtration rate (GFR) in chronic kidney disease, its role in the progression of DN remains controversial. The objective of this work is to determine GFR decline in relation to BMI in type 2 diabetic (T2D) patients presenting a DN. Methods: A prospective 5-year study conducted in the Eastern region of Morocco. Three BMI groups were distinguished: normal weight, overweight and obese and within each group progressors (eGFR > 5 ml/min/1.73 m2/year) and non progressors (eGFR? 5 ml/min/1.73 m2/year). Results: Data on 292 patients were compiled. The progressors represented 25.8%, 23.1% and 32.3% of the normal weight, overweight and obese patient groups respectively (p = 0.29). ESRD was observed in 9.1%, 6.9% and 8.3% (p = 0.21) in normal weight, overweight and obese patients respectively. In multivariate analysis, low-baseline eGFR was identified as important predictor of progression of DN in each BMI group and in the entire cohort independently of BMI. Vascular co-morbidity events occurred in 9.1%, 16.9% and 19.8% (p = 0.04) in normal weight, overweight and obese patients respectively. Conclusion: Our results show that the decline of eGFR in the DN of T2D is not directly influenced by BMI and that the major risk factors contributing to this decline remain low-baseline eGFR and increased baseline albuminuria.
Introduction
Diabetes is the leading cause of chronic kidney disease (CKD) in the developed world and people with diabetes and CKD have greatly increased risk of progression to End Stage Renal Disease (ESRD) and cardiovascular mortality.Citation1–4 Decreased estimated glomerular filtration rate (eGFR) and increased urinary albumin excretion (UAE) predict these major complications of DT2.Citation5–9 GFR is characterized by an extremely variable decline ranging from 2 to 20 ml/min/year.Citation3,Citation4 Several factors play a capital role in the progression of diabetic nephropathy (DN) to ESRD but arterial hypertension and proteinuria remain the two major risk factors.Citation10,Citation11
Body mass index (BMI) is one of the factors that have been widely studied in recent years but its exact role in the decline of GFR in DN is still unclear. Mounting evidence has emerged suggesting that obesity by itself, independent of its association with diabetes mellitus and hypertension, has a pivotal role in renal injuries.Citation12–15 and is an independent risk factor for progression to ESRD.Citation16–18 Data concerning the exact role of BMI in the decline of GFR in type 2 diabetes (T2D) are still incompletely studied, and the following set of questions may be raised. Does BMI really influence the rate of eGFR decline in DN? Does BMI modify the contribution of each classical risk factor in the decline of eGFR in DN? Finally, what is the situation with regard to eGFR decline in a developing country where unfavorable socioeconomic conditions certainly modify the profile of progression of DN in T2D? On the one hand, the lack of specialized medical structures and on the other hand, residence in a rural milieu, low income, lack of medical coverage as well as the high rate of illiteracy and ignorance among patients seriously hinder optimal medical management of these patients. Very few published studies concern the developing countries.Citation19 We assume that the rate and factors of GFR decline in T2D vary according to patients' BMI. To determine the nature of this link, we analyzed the decline of GFR in relation to BMI using a prospective cohort of T2D patients with DN in a developing country.
Materials and methods
Study design and study population
This is a prospective study conducted from September 2006 to September 2012 at the Reference Center for Chronic Diseases in Oujda, Morocco (Eastern Morocco, North Africa). The Ethics Committee of Morocco's Mohammed V University in Rabat approved the study protocol (University Mohammed V Souissi, Rabat). Verbal informed consent was required from all participants.
All patients were regularly followed in nephrology consultation. The patients included in the study were T2D patients with DN. Those T2D patients who were pregnant, who had a single kidney, or a pathology other than diabetes capable of altering renal function (renal lithiases, Polycystic Kidney Disease, prior long-standing arterial hypertension, a neoplasm, long-term use of nephrotoxic medications), End Stage Renal Disease on admission and follow-up of less than 24 months were excluded from the study. Patients with type 1 diabetes were excluded from this study.
Diabetes was defined as fasting glucose of at least 7 mmol/L, non-fasting glucose of at least 11.1 mmol/L or glycated hemoglobin (HbA1C) of at least 6.5% or use of glucose lowering drugs. T2D was retained based on a combination of biological and clinical parameters (hyperglycemia, age, excess weight, heredity). DN was defined as the presence of micro-albuminuria (albumin excretion rate =30–300 mg/d) or macro-albuminuria (albumin excretion rate > 300 mg/d) based on 24-hour urine collection and/or impaired renal function defined as GFR estimated by the Modification of Diet in Renal Diseases (MDRD) formula ≤ 60 ml/minute/1.73m2 and in evolution for at least three monthsCitation20,Citation21 and independent of any other pathology that might explain this renal impairment.
Covariates
Various data including socio-demographic (age, gender), clinical (weight, height, blood pressure and vascular comorbidity) and biochemical parameters (serum creatinine, Hb A1C, hemoglobin, cholesterol, triglycerides and urinary albumin excretion rate) were collected at admission and were performed for each patient every six months.
We calculated eGFR with the abbreviated MDRD Study equation. We used the calibrated Jaffe method and not the isotope dilution mass spectrometry because it is expensive and not available in our country and we reduced the creatinine concentrations by 5% as previously reported.Citation22
To determine micro-albuminuria, we used conventional immunoturbidimetric assay and we considered an albumin excretion rate (AER) to be positive when it was positive in two out of three specimens independently of any concomitant urinary infection. We defined hypertension as systolic blood pressure of at least 140 mmHg, diastolic blood pressure of at least 90 mmHg or use of antihypertensive drugs. Body mass index (BMI) was calculated by dividing body weight (kg) by the height squared (kg/m2). The study population was divided into normal weight (BMI = 18.5–24.99 kg/m2), overweight (BMI = 25–29.99 kg/m2) and obese (BMI ≥ 30 kg/m2). Within each BMI group we distinguished two groups of patients by the presence or not of rapid progression according to the 2013 Kidney Disease: Improving Global Outcomes (KDIGO) Guidelines.Citation23 The progressors group was defined as rapid progression. Rapid progression was defined as sustained decline in eGFR of more than 5 ml/min/1.73 m2/year. The non-progressors group was defined as non-rapid progression. Non-rapid progression was defined as sustained decline in eGFR of less than or equal 5 ml/min/1.73 m2/year. The rate of eGFR decline (mL/min/1.73 m2/year) for each patient was determined by: (Last eGFR – Baseline eGFR)/follow-up period in years. ESRD was defined by eGFR <15 ml/min/1.73 m2 and/or initiation of dialysis.
Patients were considered for the presence or absence of vascular co-morbidities such as ischemic heart disease (history of angina, myocardial infarction, heart failure and/or coronary revascularization) and/or peripheral vascular disease (amputation and/or gangrene of the lower limbs) and/or cerebrovascular disease (history of stroke or transient ischemic attack).
Statistical analysis
Data were analyzed using the Statistical Package for Social Sciences version 13.0 (SPSS, Inc., Chicago, IL). Quantitative variables were expressed as mean ± standard deviation or as median and interquartile range following their distribution. Qualitative variables were expressed as frequency and percentage. Comparison of quantitative variables between two groups was performed by analysis of Student's t-test if the variable showed symmetrical distribution or by Mann–Whitney Test if the variable showed asymmetrical distribution. Comparison of qualitative variables between two groups was performed using Chi square test or Fisher's Exact test. Associations between eGFR and covariates of interest were investigated using generalized estimating equations, using an autoregressive correlation matrix, for univariate and multivariate regression analysis.Citation24 Variables with p values ≤ 0.20 in the univariate analysis were tested in the multivariate analysis. Forward stepwise variable inclusion was used to reach the final parsimoniously reduced model. All analyses were done with 95% confidence intervals, all p values were two-sided and p < 0.05 was considered statistically significant.
Results
Among the 673 T2D patients regularly followed in nephrology consultation, only 292 patients (43.3%) met the inclusion criteria. On admission, 22.6%, 44.5% and 32.9% of the patients had normal weight, overweight and obesity respectively. Morbid obesity was found in 4.1% of cases. The progressors represented 25.8%, 23.1% and 32.3% of the normal weight, overweight and obese patient groups respectively. In , we report the clinical and biological parameters of all the patients and comparison of parameters between the three groups of patients at baseline visit and at the end of follow-up.
Table 1. Comparison of clinical and biological parameters between the three groups of patients who had DT2 with diabetic nephropathy at baseline visit and at the end of the follow-up (n = 292).
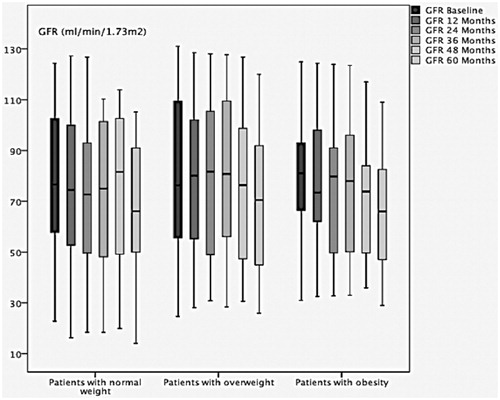
Among non-progressors, the difference was statistically significant concerning the comparison of baseline eGFR and the eGFR in evolution within each BMI group. In the normal weight group, the median baseline eGFR versus the eGFR in evolution at 12 ; 24 ; 36 ; 48 and 60 months was 86 [61,107] and 86 [58,111] (p < 0.001) ; 84 [59,97] (p < 0.001); 77 [55,101] (p < 0.001); 79 [39,102] (p = 0.03) and 69 44,90 (p = 0.002) respectively. In the overweight group, the median baseline eGFR versus the eGFR in evolution at 12; 24; 36; 48 and 60 months was 59 [43,112] and 62 [46,107] (p = 0.003); 56 41,107 (p < 0.001); 84 [40,111] (p < 0.001); 83 [42,99] (p < 0.001) and 89 [42,97] (p = 0.001) respectively. In the obesity group, the median of the baseline eGFR versus the eGFR in evolution at 12; 24; 36 ; 48 and 60 months was 81 [55,103] and 73 [50,100] (p < 0.001); 79 [47,97] (p < 0.001); 74 [44,93] (p < 0.001); 67 [41,90] (p < 0.001) and 66 [43,88] (p = 0.003) respectively. reports the change over time in GFR in the non-progressors group within each BMI group.
Figure 1. Change in GFR over time in the non-progressors group with in each BMI group.
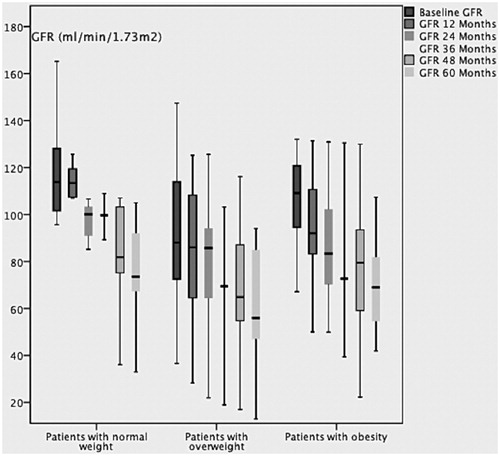
Among progressors, the difference was statistically significant concerning the comparison of baseline eGFR and the eGFR in evolution within each BMI group. In the group normal weight, the median baseline eGFR versus the eGFR in evolution at 12; 24; 36 ; 48 and 60 months was 95 [65,123] and 94 [50,113]; 85 [50,113]; 89 [40,105]; 81 [44,105] and 73 [61,105] respectively. In the group overweight, the median baseline eGFR versus the eGFR in evolution at 12; 24; 36; 48 and 60 months was 75 [53,110] and 78 [37,108]; 68 [39,94]; 57 [28,88]; 63 [40,84] and 56 [42,84] respectively. In the group obesity, the median of the baseline eGFR versus the eGFR in evolution at 12; 24; 36; 48 and 60 months was 107 81,116 and 90 76,108; 79 [76,99]; 74 [62,94]; 79 [55,92] and 69 [48,82] respectively. reports the change over time in GFR in the progressors group within each BMI group.
Figure 2. Change in GFR over time in the progressors group with in each BMI group.
The results of the study of risk factors for GFR decline among patients with normal weight, overweight, obesity and all patients using univariate analysis are reported in , , and respectively. The results of the study of risk factors for GFR decline among patients with normal weight, overweight, obesity and all patients using multivariate analysis are reported in .
Table 2. Univariate regression analysis (generalized estimating equations) of baseline variables and relationship with decline of eGFR in T2D patients with normal-weight (n = 66).
Table 3. Univariate regression analysis (generalized estimating equations) of baseline variables and relationship with decline of eGFR in TD2 patients with overweight (n = 130).
Table 4. Univariate regression analysis (generalized estimating equations) of baseline variables and relationship with decline of eGFR in T2D patients with obesity (n = 96).
Table 5. Univariate regression analysis (generalized estimating equations) of baseline variables and relationship with decline of eGFR in all T2D patients with diabetic nephropathy (n = 292).
Table 6. Multivariate regression analysis (generalized estimating equations) of baseline variables and relationship with decline of eGFR in patients with normal weight, overweight, obesity and all T2D patients with diabetic nephropathy.
Discussion
While high BMI has been identified as an important risk factor for the development of DT2Citation24,Citation25 its involvement in the progression of DN in DT2 remains a subject of controversy.
Is BMI really a factor of GFR decline in non-diabetic chronic renal disease? Several recent studies do not confirm this link. Brown et al. in a prospective study of 499 patients does not find BMI as a factor of GFR decline in univariate analysis.Citation26 Khedr et al. in a retrospective study of 214 diabetic and non-diabetic patients does not find BMI as a factor of GFR decline in multivariate analysis.Citation27 However, Othman et al. in a retrospective study of 125 non-diabetic patients identifies BMI as a factor of GFR decline in both uni-and multi-variate analysis.Citation28 Also, because obesity has been strongly associated with chronic renal disease,Citation16–18 we supposed that the rate of GFR decline in type 2 diabetics presenting diabetic nephropathy would vary by BMI. We expected to find that obese T2D patients would have a greater decline than non-obese T2D patients (normal weight or overweight).
Is BMI really a factor for GFR decline in diabetic nephropathy? Recent data are contradictory: Mohsen et al.; Ibrahim et al.; Viswanathan et al.; Pavkov et al. and Stengel et al. do not find a link between BMI and the progression of diabetic nephropathy in type 2 diabetes in their retrospective studies.Citation29–33 Alwakeel et al. in a retrospective study of 621 type 2 diabetics identify BMI as a factor for GFR decline in univariate analysis, but not in multivariate analysis.Citation34 Mohsen et al. demonstrated that there was no statistically significant difference in the rate of progression of CKD between obese and non-obese T2D patients.Citation29 Khedr et al. compared the rate of GFR decline between non-obese patients (diabetic or not) and obese patients (diabetic or not) and found no statistical significant difference.Citation27 However, in our study the difference between the three BMI groups was not statistically significant with regard to the percentage of cases showing rapid progression and BMI is not a factor for the risk of DN progression in T2D.
In the non-progressors group, we observed a statistically significant variation of GFR over time. Thus, GFR continued to decline even among the non-progressors, but at a lower rate than among the progressors. This occurred irrespective of the BMI group.
We compared our results to those reported by the Alwakeel study,Citation34 the only study published and conducted in an Arab country, even though Morocco and Saudi Arabia differ considerably in socioeconomic level. We noticed that the average decline of eGFR reported by Alwakeel was 3.3mL/min/1.73m2 and that BMI was not retained as a factor in the progression of DN. However, their patient profile differed from ours since 80% of their patients were obese and 92% had hypertension. The limit of this study is that GFR was evaluated using the Cockcroft–Gault equation in a highly obese population, which overestimates GFR.
This rapid decline of GFR in the DN of DT2 is accompanied by an elevated incidence of ESRD. This incidence was 7.9% in our study versus 25.1%; 16.5% and 4.3% reported respectively by Pavkov et al.; Alwakeel et al. and Coll-de-Tuero et al.Citation32,Citation34,Citation35 However, these incidences are not really comparable because the inclusion criteria vary considerably from one study to another, which makes any objective comparison nearly impossible.
Does the incidence of ESRD vary by BMI in T2D? Very few data are available and when they are, they concern only two groups of patients (obese and non-obese). In our study, we did not find a statistically significant difference with respect to the incidence of ESRD between the three BMI groups studied. No difference was found with regard to the rate of GFR decline between the three BMI groups, we supposed that the risk factors for GFR decline could vary from one BMI group to another.
Babayev et al. observed in a large cohort of patients (including 40% who were diabetic) that BMI was not associated with either progression to ESRD or mortality, while race, lower eGFR, albuminuria, male sex and diabetes were factors of rapid progression towards ESRD.Citation36
What about the other risk factors studied? We found that advanced age, low-baseline GFR, increased baseline albuminuria and low-baseline hemoglobin were retained as risk factors for DN progression in univariate analysis and in the three BMI groups in all patients. However, neither arterial hypertension nor diabetic imbalance was retained in univariate analysis. This may be explained by the fact that the whole cohort had similar readings for HbGA1C and SBP and DBP at baseline visit. In fact, no statistically significant difference was found concerning these variables at baseline visit between the two groups, progressors and non-progressors within the three BMI groups. To emphasize, we found that low GFR at baseline visit was the main and common independent risk factor for rapid GFR decline in each BMI group and in the whole cohort which is independent of BMI in multivariate analysis.
Fox et al. in their important meta-analysis found that several major health outcomes, including ESRD and death, are increased in individuals with CKD, irrespective of the cause of their impaired kidney function. They concluded that, despite higher risks for mortality and ESRD in diabetes, the relative risk of these outcomes (estimated by eGFR and albumin creatinine ratio) are almost the same irrespective of the presence or absence of diabetes, emphasizing the importance of kidney disease as a predictor of clinical outcomes.Citation37
Increased baseline UAE rate, low use of renin-angiotensin system inhibitors and low-baseline hemoglobin were also identified in our study as powerful factors associated with the GFR decline, depending on the BMI group.
These observations raise the importance of eGFR and albuminuria, which remain powerful factors for the progression of kidney disease in T2D.
Cardiovascular risk is a determining prognostic element in T2D. Demonstration of a link between BMI and cardiovascular risk in T2D patients with CKD would be an important contribution. Several studies have not found a link between BMI, and risk and cardiovascular mortality.Citation36,Citation38 In our study, we saw statistically significant difference between the three BMI groups concerning the incidence of vascular comorbidity events occurring during follow-up. We noted that more cardiovascular events occurred in the obese and overweight groups than in the normal weight group. Consequently our results show that CKD does significantly modify the association between high BMI and risk of vascular comorbidity in T2D contrary to the findings of other studies.Citation39
In our study, less than 10% of patients had a GFR of <30ml /min/1.73 m2 at the first nephrology consultation. These results were satisfactory and did not indicate a delayed referral, despite the difficulties of our developing country context.
The present study had weaknesses and strengths
Strengths
This is the only study that deals with the progression of diabetic nephropathy in relation to the three BMI groups in a developing country, thus contributing to knowledge of the admission and evaluative profile of diabetic nephropathy in developing countries. Moreover, it focuses on DN and not CKD, unlike the majority of research that study CKD and not DN in T2D patients.
The main weaknesses of the study are two-fold: the techniques for measuring serum creatinine and albuminuria, which are not standardized, and the relatively small size of the study sample.
Conclusion
Our results show that GFR decline in the DN of T2D is not directly influenced by BMI and that the risk factors contributing to this decline vary between one BMI group and another, but low-baseline eGFR and high-baseline albuminuria remain important predictors of cardiovascular and kidney outcomes. This will probably lead us to take BMI group into consideration for the treatment of DN and thereby act on the whole set of independent risk factors involved in each BMI group. Other studies based on strict inclusion criteria are needed in order to confirm or contradict these hypotheses.
Declaration of interest
The authors declare that they have no competing interests. This study received no financial support.
Authors' contribution
HL contributed to the literature search, interpretation of results and writing of this article. RA performed the statistical analysis and participated in the design of the study.
All authors read and approved the final manuscript.
Acknowledgements
The authors thank all the patients and the nurses who participated in this study.
References
- Fox CS, Larson MG, Leip EP, Culleton B, Wilson PW, Levy D. Predictors of new-onset kidney disease in a community-based population. JAMA. 2004;291:844–850
- US Renal Data System. USRDS 2011 Annual Data Report: Atlas of Chronic Kidney Disease and End-Stage Renal Disease in the United States. Bethesda, MD: National Institutes of Health, National Institute of Diabetes and Digestive and Kidney Diseases; 2011
- US Renal Data System. USRDS 2003 Annual Data Report: Atlas of End Stage Renal Disease in the United States. Bethesda, MD: National Institute of Health, National Institute of Diabetes and Digestive and Kidney Diseases; 2003
- United States Renal Data System. USRDS 2009 Annual Data Report: Atlas of Chronic Kidney Disease and End Stage Renal Disease in the United States. Bethesda, MD: National Institute of Health, National Institute of Diabetes and Digestive and Kidney Diseases; 2009
- Matsushita K, van der Velde M, Astor BC, et al. Association of estimated glomerular filtration rate and albuminuria with all-cause and cardiovascular mortality in general population cohorts: a collaborative meta-analysis. Lancet. 2010;375:2073–2081
- van der Velde M, Matsushita K, Coresh J, et al. Lower estimated glomerular filtration rate and higher albuminuria are associated with all-cause and cardiovascular mortality. A collaborative meta-analysis of high-risk population cohorts. Kidney Int. 2011;79:1341–1352
- Gansevoort RT, Matsushita K, van der Velde M, et al. Lower estimated GFR and higher albuminuria are associated with adverse kidney outcomes in both general and high-risk populations. A collaborative meta-analysis of general and high-risk population cohorts. Kidney Int. 2011;80:93–104
- Astor BC, Matsushita K, Gansevoort RT, et al. Lower estimated glomerular filtration rate and higher albuminuria are associated with mortality and end-stage renal disease. A collaborative meta-analysis of kidney disease population cohorts. Kidney Int. 2011;79:1331–1340
- Tonelli M, Muntner P, Lloyd A, et al. Using proteinuria and estimated glomerular filtration rate to classify risk in patients with chronic kidney disease:a cohort study. Ann Intern Med. 2011;154:12–21
- Pavlok ME, Knowler WC, Hanson RL, Benett PH, Nelson RG. Predictive power of sequential measures of albuminuria for progression to ESRD or Death in Pima Indians with type 2 diabetes. Am J Kidney Dis. 2008;51:759–766
- Imai E, Horio M, Yamagatha K, et al. Slower decline of glomerular filtration rate in the Japanese general population:a longitudinal 10 years follow up study. Hypertens Res. 2008;31:433–441
- Praga M. Obesity—a neglected culprit in renal disease. Nephrol Dial Transplant. 2002;17:1157–1159
- Hall JE, Henegar JR, Dwyer TM, et al. Is obesity a major cause of chronic kidney disease? Adv Ren Replace Ther. 2004;11:41–54
- Ejerblad E, Fored CM, Lindblad P, Fryzek J, McLaughlin JK, Nyren O. Obesity and risk for chronic renal failure. J Am Soc Nephrol. 2006;17:1695–1702
- Cignarelli M, Lamacchia O. Obesity and kidney disease. Nutr Metab Cardiovasc Dis. 2007;17:757–762
- Hsu CY, McCulloch CE, Iribarren C, Darbinian J, Go AS. Body mass index and risk for end-stage renal disease. Ann Intern Med. 2006;144:21–28
- Iseki K, Ikemiya Y, Kinjo K, et al. Body mass index and the risk of development of end-stage renal disease in a screened cohort. Kidney Int. 2004;65:1870–1876
- Hsu CY, Iribarren C, McCulloch CE, Darbinian J, Go AS. Risk factors for end-stage renal disease: 25-year follow-up. Arch Intern Med. 2009;169(4):342–350
- Ibrahim A, Arogundade FA, Sanusi AA, Ikem R, Akintomide AO, Akinsola AA. Which factors actually influence the development and progression of overt nephropathy in Nigerian diabetics? Cent Afr J Med. 2009;55(5-8):28–34
- KDOQI. Clinical practice guidelines and clinical practice recommendations for diabetes and chronic kidney disease: 2012 update. Am J Kidney Dis. 2013;61(6):1049
- Levey AS, Coresh J, Balk E, Kausz AT, Levin A, Eknoyan G; National Kidney Foundation. National Kidney Foundation practice quinines for chronic kidney disease: evaluation, classification, and stratification. Ann Intern Med. 2003;139:137–147
- Levey AS, Coresh J, Greene T, et al. Expressing the modification of diet in renal disease study equation for estimating glomerular filtration rate with standardized serum creatinine values. Clin Chem. 2007;53:766–772
- Homish GG, Edwards EP, Eiden RD, Leonard KE. Analysing Family data: a GEE approach for substance use researchers. Addict Behav. 2010;35:558–563
- Meigs JB, Wilson PW, Fox CS, et al. Body mass index, metabolic syndrome, and risk of type 2 diabetes or cardio vascular disease. J Clin Endocrinol Metab. 2006;91:2906–2912
- Wannamethee SG, Shaper AG, Walker M. Overweight and obesity and weight change in middle aged men:impact on cardiovascular disease and diabetes. J Epidemiol Community Health. 2005;59:134–139
- Brown R, Mohsen A, Gren D, et al. Body mass index has no effect on rate of progression of chronic kidney disease in non diabetic subjects. Nephrol Dial Transplant. 2012;27:2776–2780
- Khedr A, Khedr E, House AA. Body Mass Index of progression of chronic kidney disease. J Renal Nutr. 2011;21(6):455–461
- Othman M, Kawar B, El Nahas AM. Influence of obesity on progression of non-diabetic chronic kidney disease: a retrospective cohort study. Nephron Clinical Practice. 2009;113:16–23
- Mohsen A, Brown R, Hoefield R, Kaira PA, O'Donoghue D, New DI. Body mass index has no effect on rate of progression of chronic kidney disease in subjects with type 2 diabetes mellitus. J Nephrol. 2012;25(3):384–393
- Ibrahim A, Arogundade FA, Sanusi AA, Ikem R, Akintomide AO, Akinsola AA. Which factors actually influence the development and progression of overt nephropathy in Nigerian diabetics? Cent Afr J Med. 2009;55:28–34
- Viswanathan V, Tilak P, S Kumpatla S. Risk Factors associated with the development of overt nephropathy in type 2 diabetes patients: a 12 years observational study. Indian J Med Res. 2012;136:46–53
- Pavkov ME, Knowler WC, Lemley KV, Mason CC, Myers BD, Nelson RG. Early renal function decline in type 2 diabetes. Clin J Am Soc Nephrol. 2012;7:78–84
- Stengel B, Tarver-Carr ME, Powe NR, Eberhardt MS, Brancatif FL. Lifestyle factors, obesity and the risk of chronic kidney disease. Epidemiology. 2003;14(4):479–487
- Alwakeel JS, Isnani AC, Alsuwaida A, et al. Factors affecting the progression of diabetic nephropathy and its complications: a single-Center experience in Saudi Arabia. Ann Saudi Med. 2011;31(3):236–242
- Coll-de-Tuero G, Mata-Cases M, Rodriguez-Poncelas A, et al. Chronic kidney disease in the type 2 diabetic patients:prevalence and associated variables in a random sample of 2642 patients of a Mediterranean area. BMC Nephrol. 2012;13:87
- Babayev R, Whaley-Connell A, Kshirsagar A, et al. on behalf of the KEEP Investigators. Association of Race and Body Mass Index with ESRD and Mortality in CKD Stages 3–4: results from the Kidney Early Evaluation Program (KEEP). Am J Kidney Dis. 2013;61(3):404–412
- Fox CS, Matsushita K, Woodward M, et al. for the Chronic Kidney Disease Prognosis Consortium. Associations of kidney disease measures with mortality and end-stage renal disease in individuals with and without diabetes: a meta-analysis. Lancet. 2012;380:1662–1673
- Brancati FL, Whittle JC, Whelton PK, Seidler AJ, Klag MJ. The excess incidence of diabetic end-stage renal disease among blacks. A population-based study of potential explanatory factors. JAMA. 1992;268:3079–3084
- Bansal N, Vittinghoff E, Plantinga L, Hsu CY. Does chronic kidney disease modify the association between body mass index and cardiovascular disease risk factors? J Nephrol. 2012;25(3):317–324