
Abstract
Background: The response to erythropoiesis-stimulating agents (ESA) in patients with chronic kidney disease (CKD) is variable. The body mass index (BMI) variations can modify the response to ESA. The objective was to assess the effect of body composition on the response to ESA in dialysis patients. Methods: This is an observational cross-sectional study. Prevalent hemodialysis and peritoneal dialysis (PD) patients were selected. In the same day, a single blood test, a body composition analysis using bioimpedance spectroscopy and anthropometric measurements were performed. We collected ESA doses. We analyzed erythropoietin resistance index (ERI). The ERI was calculated dividing the weekly weight-adjusted (kg) dose of ESA (IU) by the hemoglobin level (g/dL). Results: The study was comprised of 218 patients (58% men; age 65 (16) years old; 80% hemodialysis, 20% PD). There was an inverse correlation between ERI and BMI (p = 0.01), fat tissue index (FTI) (p = 0.01) and prealbumin (p = 0.04). We found an independent association between higher ERI levels and lower FTI and prealbumin values. Conclusion: Response to ESA is influenced by body composition. Fat tissue favors the body’s response to ESA.
Introduction
The response to erythropoiesis-stimulating agents (ESA) in patients with chronic kidney disease (CKD) is variable and can be modified in several circumstances.Citation1–4 The erythropoietin resistance index (ERI) is considered to be a helpful parameter in assessing the body’s response to ESA. The sensitivity of the ERI enables the prompt detection of primary variations.Citation5 The most commonly cited and studied cause of ERI alteration is inflammation and malnutrition, disregarding iron deficiency. ERI has been considered a good marker for predicting mortality in dialysis patients.Citation1
The body mass index (BMI) has shown to be a factor in the modification of body response to ESA.Citation1 However, whether or not this factor is solely or partially responsible for ESA alterations need to be studied.
Spectroscopic bioimpedance (BIS) is a simple and noninvasive technique based on the resistance of the tissue to the flow of an alternating current ranging from 5 kHz to 1000 kHz in frequency.Citation6–9 It has been validated using reference methods. Therefore, it is a useful and reliable tool in assessing the body composition and hydration state.Citation10–12
The objective of the present study was to assess the effect of body composition on the response to ESA, which is measured by means of the ERI in dialysis patients.
Materials and methods
Study population
This is a cross-sectional observational study. Prevalent hemodialysis and peritoneal dialysis (PD) patients were selected. Patients with amputations, pacemaker holders, and those with implantable defibrillators or metallic prothesis were excluded as these factors may have an impact upon the interpretation of the bioimpedance results. We excluded also suspected or confirmed active bleeding, active malignancy, hospital admission or severe inflammatory disease in the 4 weeks prior to the start of the study. We included patients receiving conventional hemodialysis (60%) and on-line hemodiafiltration (40%). Dialyzer used was FX 1000 (FMC®). All procedures were in accord with the Declaration of Helsinki and its revisions.
Analyzed parameters
In the same day, a single blood test, a body composition analysis and anthropometric measurements were performed; furthermore, the ESA doses were also noted. In hemodialysis patients, blood tests were taken before starting hemodialysis. The blood test included anemia parameters (hemoglobin (Hb) (g/dL), hematocrit (%), ferritin (µg/L), transferring saturation (TS) (%)) and inflammation parameters: albumin (g/dL), prealbumin (mg/dL), fibrinogen (mg/dL), erythrocyte sedimentation rate (ESR) (mm) and C-reactive protein (CRP) (mg/dL). Albumin and pre-albumin were measured using a colorimetric test with an autoanalyzer Roche-Hitachi®. The ERI was calculated dividing the weekly weight-adjusted (kg) dose of ESA (IU) by the hemoglobin level (g/dL). For those patients receiving darbepoetin, a conversion scale was applied (1 μg = 200 IU) to transform the dose into the International Units (IU). The ERI values were categorized into distinct quartiles. Patients were stratified into two groups according to their ERI. ERI values were considered high when in the upper quartile range because median ERI was lower than ERI described in the literature. We collected also echocardiographic parameters to estimate left ventricular ejection fraction (LVEF) and left ventricular mass index (LVMI).
Measurement of body composition
Body composition was calculated using bioimpedance spectroscopy (BIS, BCM®, FMC®). In the case of hemodialysis patients, measurements were taken just before starting the dialysis process, then once again after a 10-min period in the supine position, on the contralateral arm to that with the arteriovenous fistula. In the case of PD patients, the measurements were taken with empty peritoneum. The fat tissue index (FTI) and lean tissue index (FTI and LTI, kg/m2), were calculated. They are defined respectively as fat tissue and lean tissue that a patient has (kg) adjusted for its body surface (m2).
Statistical analysis
The Kolmogorov–Smirnov test was performed to assess if the values followed a normal distribution. Continous variables were expressed as mean and standard deviation. Variables which did not follow a normal distribution were expressed as median and interquartilic range (25 percentile–75 percentile). Categorical variables were expressed as percentages.
Continuous data comparison was performed by univariate Student's t test analysis for independent samples. A Pearson correlation study was performed to analyze the grade of association between BMI and FTI. A Spearman correlation study was performed to analyze the grade of association between ERI and the rest of the parameters.
A binary logistic regression analysis was used to assess the association of independent variables. p-Values lower than 0.05 were considered statistically significant. Data were processed using the PASW® v. 18.0. (Chicago, IL).
Results
A total of 218 patients were studied (176 in hemodialysis, 42 in PD), with a mean age of 65 (16). Fifty-eight percent of the patients were male and 42% female. Diabetes percentage was 21%. ACEI/ARB was 8%.
The mean hemoglobin value was 11.9 (1.4) g/dL. A hundred and eighty-two patients (83.5%) received treatment with ESA (45.5% darbepoetin and 38% erythropoietin), with a mean hemoglobin value of 11.7 (1.3) g/dL. The mean weekly dose was 5975 (793) IU for epoetin and 23 (28) µg for darbepoetin. Thirty-six patients (16.5%) did not need ESA, with a mean hemoglobin value of 12.8 (1.3) g/dL (p = 0.001 when compared with ESA-treated group).
The ERI median was 3.8 (1.5–7.2) IU/week/kg/g/dL. The mean transferring saturation was 35 (10)%. Patients receiving treatment with intravenous iron were 62%. To perform ERI comparative study, only the ESA treated group was analyzed.
The baseline characteristics of the study population are represented in .
Table 1. Descriptive characteristics for the study population.
There is a direct linear correlation between the BMI and the FTI, represented in . In , the linear correlation between ERI and the rest of the parameters is represented. This association was not significant in PD patients. An inverse correlation was observed in BMI and ERI as shown in . We did not find correlation between FTI and inflammatory markers. Patients in the ERI upper quartile (>10.1 IU/week/kg/Hb) () were compared with patients in the other quartiles. Patients with higher ERI values were younger, had lower BMI, lower FTI, and lower prealbumin values. We did not find differences in diabetes. In the multivariate binary logistic regression analysis, the independent association between patients with higher ERI levels and those with lower FTI and prealbumin values was confirmed. We also found that patients with higher ERI levels were receiving hemodialysis treatment ().
Figure 1. Correlation between body mass index and fat tissue index. Y = 0.65x + 18.5. R Pearson = 0782. p = 0.001.
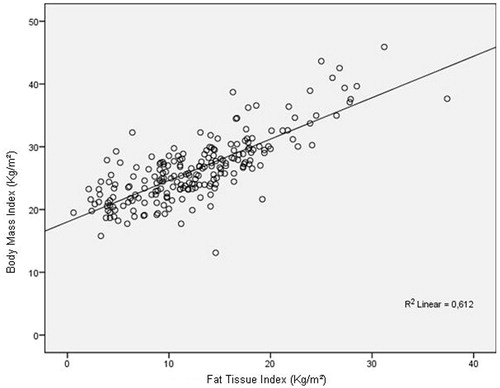
Figure 2. Correlation between body mass index and erythropoietin resistance index. Y = −0.3x + 13.3. R Spearman = −0.161. p = 0.03.
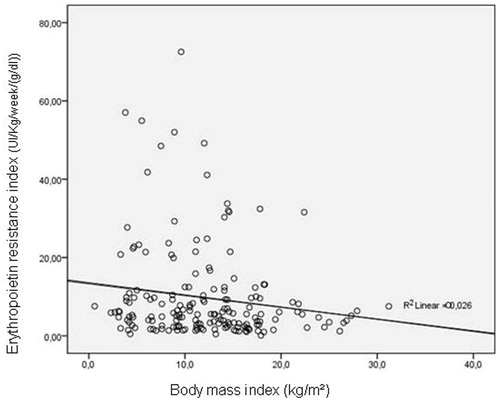
Table 2. Correlation (Rho Spearman test) between ERI and the other variables in patients receiving ESA (N = 182).
Table 3. Univariate association between patients with ERI < 10.1 and > 10.1 (IU/week/kg/Hb concentration [g/dL]) in those receiving ESA (N = 182).
Table 4. Multivariate binary logistic regression analysis among patients with ERI > > 10.1 (IU/week/kg/Hb).
Discussion
The present study demonstrates the effect of body composition on ESA response in patients with CKD receiving dialysis treatment, as previously described in others studies.Citation13 More specifically, it demonstrates a direct correlation between the FTI and the response to treatment with ESA, especially in HD patients. In PD this association could not be demonstrated probably due to the small sample size and low grade of inflammation. However, no association between ERI and LTI has been observed in this study.Citation1 It is therefore, indirectly assumed that the protective effects of the BMI on ERI may be due to a higher percentage of fat tissue.
The research data also demonstrate a close correlation between the FTI and the BMI. These results reiterate those of previous research such as the DOPPS study, in which fat tissues exhibits a protective effect on dialysis patients, as a signal of appropriate nutritional status.Citation14–17 More precisely, low fat tissue shows a malnutrition state. It is widely known that nutritional state influences the long term survival of patientsCitation18–20 and those with more fat tissue are less likely to suffer from malnutrition.Citation1 Even uremic toxin production rate may be relatively higher in patients with low body weight as compared to their heavier counterparts.Citation21 The purpose of this study is not to demonstrate that patients with a high proportion of lean tissue have an associated inflammatory state, but rather that the rate of patients on dialysis with a high proportion of lean tissue tends to be low.
In our study, the prevalence of dialysis patients who did not need treatment with ESA was 16%. As was reported in our previous study, this situation of a clinically unstable state without inflammation and its association with certain factors such as the production of endogenous erythropoietin by liver and renal cysts and time in dialysis, is not uncommon.Citation22
However, although the data demonstrate an association between fat tissue and ESA, a causal explanation for this demonstration cannot be offered. We suggest an association between the hydration state and fat tissue. As fat tissue presents a lower percentage of water, it is possible that a decreased distribution volume of hemoglobin in patients with a higher percentage of fat may influence the ESA response.Citation23 Higher uremic toxin production rate in patients with low body weight could result in increased inhibitory effect of erythropoiesis.Citation21 An alternative hypothesis is that the fat tissue may autonomously modulate the response to ESA via autocrine regulation. Leptin (higher in overweight patients) has shown to stimulate erythropoiesis.Citation24 Leptin (higher in overweight patients) stimulates erythropoiesis. Further studies should be conducted to explain the causal relationship.
In this research scenario, the found association between ERI and the inflammatory state is less relevant than that reported previously.Citation1–3,Citation14–16 Selection bias must also be considered in the context of the research, as the inflammation percentage data in this study was much lower than in previous studies.Citation1 In order to analyze stable patients, we had excluded patients with active malignancy, hospital admission or severe inflammatory disease in the 4 weeks prior to the study. Endotoxemia may be another important cause of ERI in hemodialysis patients. Due to our percentage of patients receiving hemodialysis on line is high (about 70%), our water treatment is continuously analyzed. Afsar et al. found a relationship between ERI and HD duration.Citation25 We could not find any kind of association because all our patients are receiving 12 h per week.
Prealbumin was the only factor significantly lower in patients with higher ERI. Thus, the ERI median was very low compared to other published data.Citation1 An ERI ranging between 5 and 15 is considered to be acceptable while an ERI over 15 is considered high.Citation1 The research population in this study presented with a lower ERI compared to this reference range, with a median of 5.5 IU/kg/week/g/dL, being the upper quartile over 10.1 IU/kg/week/g/dL. However, the data generated provide a greater degree of validity with regards to the correlation with the FTI, as even in the absence of an inflammatory state, the body composition modifies the ESA response independently.
Our study has several limitations; the most important is that our sample size had a low inflammation percentage data, and low ERI levels, maybe influenced by a selection bias. We could not affirm that patients with high ERI levels keep the present strong association with FTI. The second one is that we cannot explain the causal association between fat tissue and ESA, and further exploratory studies are required to examine if this association is due to the adipocyte itself, or the low percentage of water in fat tissue. The third one is that we have included patients of hemodialysis and PD, even if they might not have a different composition, recommended target hemoglobin levels may be different. The fourth one is that ESA drugs are different (epoetin and darbepoetin).
Conclusions
The response to ESA is influenced by body composition, and fat tissue shows a protective role in this regard. These relevant findings have to be confirmed in further and bigger studies.
Declaration of interest
The authors declare no conflicts of interests. The authors alone are responsible for the content and writing of this article.
References
- López-Gómez JM, Portolés JM, Aljama P. Factors that condition the response to erythropoietin in patients on hemodialysis and their relation to mortality. Kidney Int Suppl. 2008;111:S75–S81
- Agarwal R, Davis JL, Smith L. Serum albumin is strongly associated with erythropoietin sensitivity in hemodialysis patients. Clin J Am Soc Nephrol. 2008;3:98–104
- Horl WH, Jacobs C, Macdougall IC. European best practice guidelines 14–16: inadequate response to epoetin. Nephrol Dial Transplant. 2000;15:43–50
- Besarab A, Amin N, Ahsan M, et al. Optimization of epoetin therapy with intravenous iron therapy in hemodialysis patients. J Am Soc Nephrol. 2000;11:530–538
- Kaysen GA, Müller HG, Ding J, Chertow GM. Challenging the validity of the EPO index. Am J Kidney Dis. 2006;47:166.e1–166.e13
- Chazot C, Wabel P, Chamney P, Moissl U, Wieskotten S, Wizemann V. Importance of normohydration for the long-term survival of hemodialysis patients. Nephrol Dial Transplant. 2012;27:2404–2410
- Wizemann V, Rode C, Wabel P. Whole-body spectroscopy (BCM) in the assessment of normovolemia in hemodialysis patients. Contrib Nephrol. 2008;161:115–118
- Machek P, Jirka T, Moissl U, Chamney P, Wabel P. Guided optimization of fluid status in hemodialysis patients. Nephrol Dial Transplant. 2010;25:538–544
- Earthman C, Traughber D, Dobratz J, Howell W. Bioimpedance spectroscopy for clinical assessment of fluid distribution and body cell mass. Nutr Clin Pract. 2007;22:389–405
- Wabel P, Chamney P, Moissl U, Jirka T. Importance of whole body bioimpedance spectroscopy for the managment of the fluid balance. Blood Purif. 2009;27:75–80
- Kotanko P, Nathan W, Levin W, Zhun F. Current state of bioimpedance technologies in dialysis. Nephrol Dial Transplant. 2008;23:808–812
- Basile C, Vernaglione L, Di Iorio B, et al. Development and validation of bioimpedance analysis prediction equations for dry weight in hemodialysis patients. Clin J Am Soc Nephrol. 2007;2:675–680
- Kotanko P, Thijssen S, Levin NW. Association between erythropoietin responsiveness and body composition in dialysis patients. Blood Purif. 2008;26:82–89
- Leavey SF, McCullough K, Hecking E, Goodkin D, Port FK, Young EW. Body mass index and mortality in ‘healthier' as compared with ‘sicker' hemodialysis patients: results from the Dialysis Outcomes and Practice Patterns Study (DOPPS). Nephrol Dial Transplant. 2001;16:2386–2394
- Ricks J, Molnar MZ, Kovesdy CP, et al. Racial and ethnic differences in the association of body mass index and survival in maintenance hemodialysis patients. Am J Kidney Dis. 2011;7:122–131
- Molnar MZ, Streja E, Kovesdy CP, et al. Associations of body mass index and weight loss with mortality in transplant-waitlisted maintenance hemodialysis patients. Am J Transplant. 2011;11:725–736
- Streja E, Kovesdy CP, Molnar MZ, et al. Role of nutritional status and inflammation in higher survival of african american and Hispanic hemodialysis patients. Am J Kidney Dis. 2011;57:883–893
- Campbell KL, MacLaughlin HL. Unintentional weight loss is an independent predictor of mortality in a hemodialysis population. J Ren Nutr. 2010;20:414–418
- Jahromi SR, Hosseini S, Razeghi E, Meysamie A, Sadrzadeh H. Malnutrition predicting factors in hemodialysis patients. Saudi J Kidney Dis Transpl. 2010;21:846–851
- Kovesdy CP, Shinaberger CS, Kalantar-Zadeh K. Epidemiology of dietary nutrient intake in ESRD. Semin Dial. 2010;23:353–358
- Sarkar SR, Kuhlmann MK, Kotanko P, et al. Metabolic consequences of body size and body composition in hemodialysis patients. Kidney Int. 2006;70:1832–1839
- Verdalles U, Abad S, Vega A, et al. Factors related to the absence of anemia in hemodialysis patients. Blood Purif. 2011;32:69–74
- Chamney PW, Wabel P, Moissl UM, et al. A whole-body model to distinguish excess fluid from the hydration of major body tissues. Am J Clin Nutr. 2007;85:80–89
- Afsar S, Saglam M, Yuceturk C, Azca E. The relationship between red cell distribution width with erythropoietin resistance in iron replete hemodialysis patients. Eur J Inter Med. 2013;24:25–29
- Axelsson J, Qureshi AR, Heimbürger O, et al. Body fat mass and serum leptin levels influence epoetin sensitivity in patients with ESRD. Am J Kid Dis. 2005;46:628–634