
Abstract
Background: Endothelin-1 (ET-1) is potent vasoconstrictor peptide which is able to contribute to the functional and structural renal changes. The aim of this study was to investigate the relationship between plasma concentration of ET-1 and indices of renal function in patients with diabetic nephropathy. Methods: We measured plasma ET-1 levels in 99 patients with type 2 diabetes, divided into two groups according to the values of their glomerular filtration rate (GFR): group I (GFR ≥ 60 mL/min/1.73 m2; n = 50), group II (GFR ≥ 60 mL/min/1.73 m2, n = 49), and the control group (n = 30) with clinically healthy subjects who were matched by age and sex. GFR and effective renal plasma flow (ERPF) were measured by the radioisotopic clearance. Other renal function parameters, such as serum concentrations of cystatin C, urea, creatinine, uric acid, 24-h albuminuria and proteinuria were additionally measured. Results: There were significant differences in plasma concentration of ET-1 among groups I, II and the control group (1.45 vs. 2.40 vs. 0.80 pg/mL, p < 0.001). The correlation between ET-1 and mGFR (r = −0.52, p < 0.001), ERPF (r = −0.42, p < 0.001), albuminuria and proteinuria (r = 0.36, p < 0.001; r = 0.48, p < 0.001) and cystatin C (r = 0.42, p < 0.001) was significant. In multiple regression analyses, only plasma concentration of ET-1 (p < 0.001) and duration of hypertension (p < 0.05) were independently and significantly associated with mGFR. Conclusion: A higher plasma concentration of ET-1 is independently associated with a decreased value of GFR in patients with diabetic nephropathy.
Introduction
Diabetic nephropathy (DN) is one of the most serious microvascular complications of diabetes, recognized today as the leading cause of end-stage renal diseases and it approximately affects 30–40% of type 2 diabetic patients.Citation1,Citation2 During the past two decades, numerous research papers have lightened a few new paths explaining the development and progression of DN. Systemic hypertension, as well as intraglomerular hypertension, and the activation of vasoactive systems including renin-angiotensin system and endothelin system are well known hemodynamic factors that contribute to the development of DN. On the other hand, an elevated glucose level leads to increased oxidative stress and the activation of alternative metabolic pathways followed by the formation of polyols and the advanced glycation end products.Citation3–5 Combining the pathological mechanisms mentioned above results in an increased permeability of renal capillaries to plasma proteins and enhanced extracellular matrix (EM) accumulation, which consequently leads to proteinuria, glomerulosclerosis and tubulointerstitial fibrosis.Citation6
While the pathophysiology of diabetic nephropathy is complex, endothelin-1 (ET-1), a potent vasoconstrictor with proliferative, profibrotic and proinflammatory properties, may contribute to many aspects of diabetic microvascular diseases.Citation7 A scientist Paul Michel Vanhoutte was the first to report endothelial, cell-derived vasoconstriction in 1981, which was later identified as the endothelin peptide by Yanagisawa et al. in 1988.Citation8,Citation9 Endothelins are a group of endogenous peptides with a similar structure which have a powerful and long-lasting vasoconstrictive effect. The endothelin family, which is widely distributed in various cells and tissues, along with the ET-1 consists of two other members: endothelin 2 and endothelin 3, both with very similar structure. Endothelin receptor A and endothelin receptor B, two subtypes of ET receptor, have been shown to mediate ET-1 action.Citation10,Citation11
Hyperglycemia and impaired metabolic control may enhance vascular production of ET-1 in diabetes, which leads to glomerular damage by increasing vasoconstriction, mesangial cell proliferation and glomerular permeability.Citation12 Increased plasma concentration of ET-1 in patients with diabetes has been reported,Citation13,Citation14 and a significant correlation has also been observed between plasma ET-1 levels and diabetic complicationsCitation15,Citation16 but the relationship between ET-1 and indices of renal function is conflictive. It is known that patients with advanced chronic kidney disease or on dialysis have higher plasma concentrations of ET-1.Citation17–20 A small number of clinical studies have examined the relationship of plasma ET-1 to GFR across different stages of renal impairment. Therefore, the aim of this study was to evaluate the correlation between serum concentrations of ET-1 and renal functional parameters (glomerular filtration rate and effective renal plasma flow) in patients with diabetic nephropathy.
Materials and methods
This cross sectional study was done at the Clinical Center of Vojvodina (CCV), Novi Sad, Serbia, from June 2012 to July 2013. The study was conducted according to the principles of the Helsinki Declaration and it was approved by the Ethics Committee of CCV. Informed consent for participating in the study was obtained from all the participants prior to their inclusion in the study.
Study group
A total of 99 outpatients with type 2 diabetes who were secondary insulin-dependent, treated at the Clinic of Endocrinology, Diabetes and Metabolic Disorders, CCV were included in the study. The control group was formed from 30 healthy subjects matched by age and sex. Diabetic patients were divided into two groups according to their values of measured GFR (mL/min/1.73 m2): the first group (GFR ≥ 60 mL/min/1.73 m2) was formed from 50 diabetic patients (20 male/30 female) and the second group (GFR < 60 mL/min/1.73 m2) consisted of 49 patients (24 male/25 female).
All subjects were physically examined, their height and weight were obtained and their body mass index was calculated. Laboratory evaluation was performed in the morning, after 12-hour fasting and a 30-min resting period. Their blood samples and 24-hour urine samples were taken on the same day, and GFR and ERPF were also measured for all subjects. Blood samples were taken just before carrying out the isotopic clearance method. All respondents were previously informed on how to collect their 24-hour urine samples both orally and in writing. Analyses were performed immediately after blood sampling, except for ET-1 (the samples were kept frozen at −70 °C no longer than one month before the determination of ET-1).
The basic criterion for inclusion of patients in the study was the presence of diabetic nephropathy based on relevant parameters (persistent urinary albumin excretion (UAE) >30 mg/24 h or/and decreased value of GFR). The excluding factors were if the level of measured GFR was less than 15 mL/min/1.73 m2, any cardiovascular event (AMI, percutaneous coronary angioplasty or revascularization, stroke and peripheral arterial disease) during the 6 months preceding the enrollment; any malignancy, presence of liver disease, or any acute inflammatory or infectious process.
Assessment of renal function
GFR measurement
Assessment of GFR (by using a single-spaced model)Citation20 was determined by the isotopic clearance of 99mTc-labeled diethylene triamine pentaacetic acid (99mTc-DTPA), using a single injection at a dose of 37 MBq, in two blood samples, taken after 180 and 240 min.
Normal GFR values were calculated using regression equations by Schernthaner et al.Citation21 as follows:
For women: GFR = 144.1 − (0.99 × years of age)
For men: GFR = 160.5 − (1.16 × years of age)
The GFR values were expressed as mL/min/1.73 m2 and variations in GFR values compared to reference values (expected values for the sex and age) as mL/min and percentage.
ERPF measurement
Effective renal plasma flow was determined by the isotopic clearance of 131I-labeled orthoiodo hippuric acid (hippuran) in two blood samples, collected after 20 and 30 min using the Blaufox method.Citation22 Normal ERPF values were calculated using regression equations by Schernthaner et al.Citation21 as follows:
For women: ERPF = 673.3 − (2.92 × years of age)
For men: ERPF = 854.2 − (5.4 × years of age)
The ERPF values were expressed as mL/min/1.73 m2 and variations in ERPF values compared to reference values (expected values for the sex and age) as mL/min and percentage.
24-h Proteinuria and albuminuria
Proteinuria was determined by using a pyrogallol red biochemical analyzer ADVIA 1800 and Siemens commercial kits (Siemens Healthcare Diagnostics, Tarrytown, NY) with a reference range of <150 mg/24 h. Albuminuria was determined using the immunometric assay sandwich method with the use of commercial NycoCard tests (Oslo, Norway) on the NycoCard reader, Norway, with a reference range of <30 mg/24h. Microalbuminuria was defined as UAE between 30 and 299 mg/24 h and macroalbuminuria was defined as UAE ≥300 mg/24 h.
Serum concentration of cystatin C was determined by the immunoturbidimetric method using a Dyazime commercial kit on the biochemical analyzer Olympus AU400 (Tokyo, Japan). The reference range for cystatin C was from 0.5 to 1.03 mg/L. Serum concentration of creatinine, urea and uric acid was determined by standard biochemical methods, on the same analyzer.
ET-1 measurements
To measure plasma concentration of ET-1, venous blood was drawn and stored in a refrigerated tube containing EDTA. The samples were centrifuged and stored for subsequent blind analyses performed simultaneously for all samples. ET-1 measurements were taken by indirect enzyme linked immunosorbent assay (R&D Systems, Minneapolis, MN) on the biochemical analyzer RAYTO (Shenzhen, Guangdong, China). The antibody specific to ET-1 was pre-coated on a microplate. Standards, samples, control and conjugates were pipetted into the wells. Any ET-1 present in the sample is sandwiched by the immobilized antibody and enzyme linked antibody specific to ET-1. Then the washing substrate is added for color development. This process is stopped by adding sulphuric acid and the color is measured spectrophotometrically. The absorbance is inversely proportional to the concentration of ET-1 in the sample. The results were expressed as pg/mL.
Furthermore, in all respondents serum concentration of glucose was measured by the glucose oxidase method with a reference range: 4.0–5.9 mmol/L and glycated hemoglobin A1c (HbA1c) by the immuno-inhibitory test (Beckman-Coulter, Kildare, Ireland) with reference range: 4.7–6.0%.
Statistical analysis
The distribution of numeric variables was tested using the Kolmogorov-Smirnov test.Citation23 The data were presented as mean ± standard deviation (SD) or median and interquartile range for continuous variables. Categorical data were summarized as numbers and percentages. Independent-samples one-way analysis of variance parametric test, and Kruskal–Wallis H non-parametric tests were used for the comparison of continuous variables and a chi-square analysis was used for categorical variables. Pearson’s and Spearman’s coefficient of linear correlation was used to study the correlation between the variables. Multiple regression analysis was performed to estimate the independent contribution of plasma ET-1 concentration to GFR. We included variables that met statistical significance in univariate analysis, plasma concentration of ET-1, albuminuria, proteinuria and the duration of HT. A statistical analysis was performed using SPSS version 12.0 (StatSosft inc., Tulsa, OK) for Windows. A difference was considered significant if the p value was less than 0.05.
Results
The main characteristics of the study subjects are shown in .
Table 1. Clinical and laboratory characteristics of the study population.
Duration of diabetes, duration of insulin therapy, metabolic regulation of diabetes (fasting glucose and HbA1c), the presence of hypertension (HT) and the use of ACE inhibitors, as well as the value of body mass index, were similar in both groups of diabetic patients with a different degree of reduction in mGFR. Diabetic patients in group II had a significantly longer duration of HT [8.5 (120) vs. 11 (1–38) years, p < 0.05).
Renal function parameters of the study subjects are shown in .
Table 2. Renal function parameters of diabetic patients with mGFR > 60 mL/min/1.73 (I group), mGFR < 60 mL/min (II group), and the control group (CG).
Diabetic patients in group II with a greater degree of reduction mGFR had a significantly lower level of ERPF compared to group I and the control group (257 ± 64 vs. 428 ± 37 vs. 513 ± 51 mL/min/1.73 m2, p < 0.001) and a significantly higher serum concentration of creatinine (124 ± 59 vs. 79 ± 9.6 vs. 71 ± 7.6 µmol/L, p < 0.001), urea (9 ± 2.5 vs. 6 ± 1.1 vs. 5.6 ± 1.6 mmol/L, p < 0.001), uric acid (348 ± 78 vs. 295 ± 78 vs. 273 ± 58 µmol/L, p < 0.001), cystatin C (1.5 ± 0.4 vs. 1 ± 0.1 vs. 0.8 ± 0.1 mg/L, p < 0.001), as well as albuminuria (60 vs. 19 vs. 9 mg/24 h, p < 0.001) and proteinuria (310 vs. 123 vs. 67 mg/24 h, p < 0.001) compared to group I and the control group.
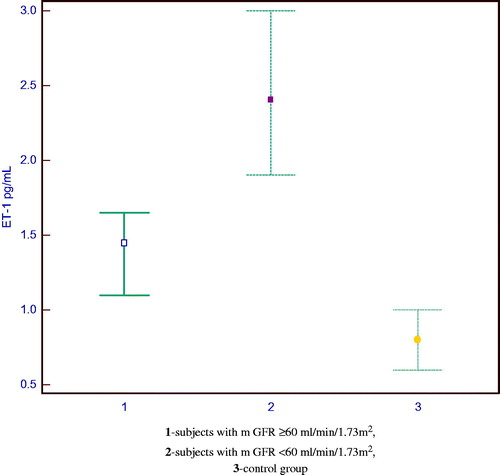
A higher plasma concentration of ET-1 was measured in diabetic patients than in control subjects. A significant difference in the median value of ET-1 was registered between the groups (p < 0.001). Plasma concentration of ET-1 was significantly lower in the control subjects than in group I (0.80 vs. 1.45 pg/mL) and group II (0.80 vs. 2.40 pg/mL). Significantly higher plasma concentrations of ET-1 were noted in diabetic patients with a higher degree of reduction in mGFR compared to diabetic patients with a lower degree of reduction in mGFR (1.45 vs. 2.40 pg/mL, p < 0.001).
shows the distribution of the ET-1 values in the examined groups.
Figure 1. The values of the plasma endothelin-1 in the subjects groups.
In the group of patients with diabetic nephropathy there was a statistically significant correlation between the plasma concentration of ET-1 and the measured values of GFR and ERPF (r = −0.52; p < 0.001; r = −0.42; p < 0.001). Diabetic patients with a higher plasma concentration of ET-1 had higher degree of reduction in mGFR and ERPF. Cystatin C (r = 0.42, p < 0.001), albuminuria (r = 0.36, p < 0.001) and proteinuria (r = 0.48, p < 0.001) showed a direct correlation with the plasma concentration of ET-1. Multiple regression analyses were performed to estimate the independent contribution of plasma ET-1 concentration to mGFR among the variables albuminuria, proteinuria and the duration of HT. In this model (F = 44.174, R2 = 0.609) only the plasma concentration of ET-1 (p < 0.001) and the duration of HT (p < 0.05) remained independently and significantly associated with mGFR.
Discussion
Diabetes is not only an endocrine but also a vascular disease. Endothelial dysfunction, defined as an imbalance of endothelium-derived vasoconstrictor and vasodilator substances, is a common denominator in the pathogenesis and progression of microvascular complications.Citation7,Citation24 ET-1 is a potent vasoconstrictor with proliferative, profibrotic and proinflammatory properties, with high expression in the renal vasculature and parenchyma. Therefore, ET-1 except being a marker of endothelial dysfunction in diabetic patients, when elevated is also potentially harmful to renal function which can further contribute to the progression of DN.Citation25
In this study, we measured the plasma concentration of ET-1 in patients with diabetic nephropathy and a different degree of GFR reduction, as well as in the control group of healthy subjects. The results of our study showed that the plasma concentration of ET-1 is significantly higher in the group of diabetic patients than in the controls. The evidence of an increased activity of ET-1 in diabetic patients is derived from a number of experimental and clinical studies.Citation26–29 A higher plasma concentration of ET-1 in patients with diabetes than in healthy population can partially be explained by a stimulated production of ET-1 caused by hyperglycemia and hyperinsulinemia. In an experimental study by Hargrove et al.Citation30 it was observed that hyperglycemia increases transcriptional activity of ET-1 gene, leading to an increase in the glomerular level of ET-1 mRNA and protein in diabetic rats. These findings support the direct effect of glucose on the activity of the gene for ET-1. On the other hand, insulin increases the expression of a renal ET which is considered to be the evidence of an important pathophysiological role of endothelin system in the development of DN.Citation31,Citation32
The results of our study are concordant with the significant influence of plasma ET-1 on hemodynamic and renal function status in diabetic patients, with a significant correlation between plasma concentration of ET-1 and mGFR, as well as plasma concentration of ET-1 and ERPF. In support of these results some authors emphasize that the vasoconstrictor effect of ET-1 is greater than that of angiotensin II, while the renal blood vessels are 10 times more sensitive to the action of ET-1 compared to the rest of the systemic vasculature. After an in vivo administration, ET-1 increases systemic blood pressure as a result of both increased resistance in the afferent and efferent renal arterioles and the mesangial contraction and proliferation. As a result, GFR and ERPF decrease.Citation33 Experimental studies performed on the kidneys of rats and rabbits have demonstrated that intrarenal infusion of ET-1 leads to a decrease in ERPF and an increase in resistance in the afferent and efferent arterioles of the same intensity as the decrease in GFR.Citation34,Citation35
A small number of clinical studies concerning the relationship between ET-1 and renal function parameters in patients with different stages of renal insufficiency, indicated a significant correlation of GFR with the fractional excretion of ET-1 in relation to the plasma level of ET-1. This result was expected considering the high endogenous production of ET in renal disease.Citation36 The studies on endothelin receptor antagonists have shown that renal hemodynamic and microcirculation are under the influence of both endogenous and exogenous ET-1.Citation37 On the other hand, in some studies there was no significant relationship between plasma concentration of ET-1 and GFR.Citation38 These results can partially be explained by the fact that the diabetic patients included in the studies had no significant difference in the GFR level.
The results of our study showed a significant correlation between the plasma concentration of ET-1 and the severity of albuminuria and proteinuria. Some studies showed a positive correlation between the plasma concentration of ET-1 and UAE in normotensive diabetic patients with microalbuminuria.Citation39 There are studies confirming this correlation among patients with macroalbuminuria.Citation40 Morigi et al.Citation41 explained how ET-1 may cause glomerular damage in their experimental in vitro study, where they observed that podocytes are subjected to phenotypic changes under the influence of dedifferentiation or autocrine and paracrine effects of ET-1, which contributes to the damage of the glomerular filtration membranes.Citation41 There is strong evidence that ET-1 plays a central role in the pathogenesis of proteinuria and glomerulosclerosis. This process is mediated through the ETA receptor activation, which is confirmed by clinical studies with the ETA receptor antagonists leading to proteinuria reduction.Citation42
In conclusion, the results we obtained demonstrated that a higher plasma concentration of ET-1 is independently associated with the levels of GFR in patients with diabetic nephropathy.
Declaration of interest
The work of Velibor Čabarkapa was supported by the Ministry of Science and Education of the Republic of Serbia on the basis of contract No III46005.
References
- Parchwani DN, Upadhyah AA. Diabetic nephropathy: Progression and pathophysiology. Int J Med Sci Public Health. 2012;1(2):59–70
- Van Dijk PC, Jager KJ, Stengel B, Grönhagen-Riska C, Feest TG, Briggs JD. Renal replacement therapy for diabetic end-stage renal disease: Data from 10 registries in Europe (1991–2000). Kidney Int. 2005;67:1489–1499
- Cooper M. Interaction of metabolic and hemodynamic factors in mediating experimental diabetic nephropathy. Diabetologia. 2001;44:1957–1972
- Dronavalli S, Duka I, Bakris GL. The pathogenesis of diabetic nephropathy. Nat Clin Pract Endocrinol Metab. 2008;4:444–452
- Lee GS. Retarding the progression of diabetic nephropathy in type 2 diabetes mellitus: Focus on hypertension and proteinuria. Ann Acad Med Singap. 2005;34:24–30
- Wolf G. New insights into the pathophysiology of diabetic nephropathy: From hemodynamics to molecular pathology. Eur J Clin Invest. 2004;34:785–796
- Ergul A. Endothelin-1 and diabetic complications: Focus on the vasculature. Pharmacol Res. 2011;63:477–482
- Barton M. The discovery of endothelium-dependent contraction: The legacy of Paul M. Vanhoutte. Pharmacol Res. 2011;63:455–462
- Yanagisawa M, Kurihara H, Kimura S, et al. A novel potent vasoconstrictor peptide produced by vascular endothelial cells. Nature. 1988;332:411–415
- Barton M, Kohan DE, (eds). Endothelin in renal physiology and disease. Contrib Nephrol. Basel: Karger; 2011:139–148
- Kohan DE, Rossi NF, Inscho EW, Pollock DM. Regulation of blood pressure and salt homeostasis by endothelin. Physiol Rev. 2011;91:1–77
- Kohan DE. Endothelin, hypertension and chronic kidney disease: New insights. Curr Opin Nephrol Hypertens. 2010;19:134–139
- Schneider JG, Tilly N, Hierl T, et al. Elevated plasma endothelin-1 levels in diabetes mellitus. Am J Hypertens. 2002;15(11):967–972
- Kakizawa H, Itoh M, Itoh Y, et al. The relationship between glycemic control and plasma vascular endothelial growth factor and endothelin-1 concentration in diabetic patients. Metabolism. 2004;53(5):550–555
- Ak G, Buyukberber S, Sevinc A, et al. The relation between plasma endothelin-1 levels and metabolic control, risk factors, treatment modalities, and diabetic microangiopathy in patients with type 2 diabetes mellitus. J Diabet Complications. 2001;15:150–157
- Zanatta CM, Veronese FV, Loreto Mda S, et al. Endothelin-1 and endothelin a receptor immunoreactivity is increased in patients with diabetic nephropathy. Renal Failure. 2012;34(3):308–315
- Liakopoulos V, Wurth P, Mertens PR, et al. Endothelin-1 plasma levels in hemodialysis treatment - the influence of type 2 diabetes. Renal Failure. 2005;27(5):515–522
- Ottosson-Seeberger A, Ahlborg G, Hemsén A, Lundberg JM, Alvestrand A. Hemodynamic effects of endothelin-1 and big endothelin-1 in chronic hemodialysis patients. J Am Soc Nephrol. 1999;10(5):1037–1044
- Koyama H, Tabata T, Nishzawa Y, Inoue T, Morii H, Yamaji T. Plasma endothelin levels in patients with uraemia. Lancet. 1989;1:991–992
- Fleming JS, Zivanovic MA, Blake GM, Burniston M, Cosgriff PS. Guidelines for the measurement of glomerular filtration rate using plasma sampling. Nucl Med Commun. 2004;8:759–769
- Schernthaner G, Erd W, Ludwig H, Sinzinger H, Höfer R. Study of age and sex dependance in renal clearances with radioisotopes. Aktuelle Gerontol. 1976;6(3):139–145
- Blaufox M, Frohmuller H, Campbell J, Utz D, Orvis A, Owen CA. Simplified method of estimating renal function with iodohippurate 131I. J Surg Res. 1963;3:l22–125
- Simundic AM. Practical recommendations for statistical analysis and data presentation in Biochemia Medica Journal. Biochem Med. 2012;22:15–23
- Djindjic B, Rankovic G, Živic M, Savic T, Spasic M, Bubanj M. Gender difference in hipolipemic and anti-inflammatory effects of statins in diabetics with coronary artery disease. Vojnosanitet. 2009;66(12):966–972
- Lam HC. Role of endothelin in diabetic vascular complications. Endocrine. 2001;14(3):277–284
- Drakopoulos A, Goumenos DS, Vlachojannis JG, Tsakas S. Endothelin receptors in the kidney of patients with proteinuric and non-proteinuric nephropathies. Renal Failure. 2006;28:461–467
- Mishra R, Emancipator SN, Kern TS, Simonson MS. Association between endothelin-1 and collagen deposition in db/db diabetic mouse kidneys. Biochem Biophys Res Commun. 2006;339:65–70
- Seligman BG, Biolo A, Biolo A, Polancyk CA, Gross JL, Clausell N. Increased plasma levels of endothelin 1 and von Wilenbrand factor in patients with type 2 diabetes and dyslipidemia. Diabetes Care. 2000;23:1395–1400
- Lee YJ, Shin SJ, Tsai JH. Increased urinary endothelin-1-like immunoreactivity excretion in NIDDM patients with albuminuria. Diabetes Care. 1994;17(4):263–266
- Hargrove GM, Dufresne J, Whiteside C, Muruve DA, Wong NC. Diabetes mellitus increases endothelin-1 gene transcription in rat kidney. Kidney Int. 2000;58:1534–1545
- Jauregui A, Mintz DH, Mundel P, Fornoni A. Role of altered insulin signaling pathways in the pathogenesis of podocyte malfunction and microalbuminuria. Curr Opin Nephrol Hypertens. 2009;18:539–545
- Potenza MA, Addabbo F, Montagnani MM. Vascular actions of insulin with implications for endothelial dysfunction. Am J Physiol Endocrinol Metab. 2009;297(3):568–577
- Macías-Cervantes MH, Kornhauser C, Pérez-Luque EL, Garay-Sevilla ME, Rivera-Cisneros AE. Urinary levels of endothelin-1 in type 2 diabetes mellitus patients: A non-defined marker of early renal damage. Rev Mex Patol Clin. 2008;55:42–47
- Denton KM, Shweta A, Finklestein L, Floerr RL, Evans RG. Effect of endothelin-1 on regional kidney blood flow and renal arteriole caliber in rabbits. Clinic Exp Pharmacol Physiol. 2004;31:494–501
- Dhaun N, Webb DJ. The road from AKI to CKD: The role of endothelin. Kidney Int. 2013;84:637–638
- Dhaun N, Ferro CJ, Davenport AP, Haynes WG, Goddard J, Webb DJ. Hemodynamic and renal effects of endothelin receptor antagonism in patients with chronic kidney disease. Nephrol Dial Transplant. 2007;22:3228–3234
- Saeed A, Dibona GF, Guron G. Effects of endothelin receptor antagonists on renal hemodynamics in angiotensin II-infused rats on high NaCl intake. Kidney Blood Press Res. 2012;36:258–267
- Zanatta CM, Gerchman F, Burttet L, et al. Endothelin-1 levels and albuminuria in patients with type 2 diabetes mellitus. Diabetes Res Clin Pract. 2008;80:299–303
- Bruno CM, Meli S, Marcinno M, Ierna D, Sciacca C, Neri S. Plasma endothelin-1 levels and albumin excretion rate in normotensive, microalbuminuric type 2 diabetic patients. J Biol Regul Homeost Agents. 2002;16:114–117
- Vermes I, Spooren PF, Kalsbeek-Batenburg EM, Haanen C. In addition to von Willebrand factor and urinary albumin excretion, plasma endothelin is an indicator of endothelial dysfunction in diabetes mellitus. Diabetologia. 1993;36:472–473
- Morigi M, Buelli S, Angioletti S, et al. In response to protein load podocytes reorganize cytoskeleton and modulate endothelin-1 gene: Implication for permselective dysfunction of chronic nephropathies. Am J Pathol. 2005;166:1309–1320
- Goddard J, Johnston NR, Hand MF, et al. Endothelin-A receptor antagonism reduces blood pressure and increases renal blood flow in hypertensive patients with chronic renal failure: A comparison of selective and combined endothelin receptor blockade. Circulation. 2004;109:1186–1193