
Abstract
The objective of our study is to investigate the effect of triptolide on expression of thrombospondin-1 and transforming growth factor β1 in renal tubular cells. Human renal tubular epithelial cells were stimulated by different concentrations of triptolide (0.1, 1, and 10 μg/L) in the presence of angiotensin-II (10−7 mol/L). Real Time PCR was used to detect the mRNA expression of thrombospondin-1 and transforming growth factor β1. Western blot analysis was used to detect the protein expression. ELISA was used to detect the level of total and active transforming growth factor β1. The mRNA expression of thrombospondin-1 (3.66 ± 0.48 vs. 1.33 ± 0.26, p < 0.05) and transforming growth factor β1 (3.58 ± 0.59 vs. 1.26 ± 0.28, p < 0.05) were up-regulated obviously when stimulated by angiotensin-II. And the protein expression of thrombospondin-1 (0.5126 ± 0.0936 vs. 0.1025 ± 0.0761, p < 0.01) and transforming growth factor β1 (0.5948 ± 0.0736 vs. 0.1318 ± 0.0614, p < 0.01) were also up-regulated simultaneously when stimulated by angiotensin-II. The expression of thrombospondin-1 and transforming growth factor β1 induced by angiotensin-II were down-regulated markedly with 1 μg/L and 10 μg/L of triptolide in mRNA and protein levels (p < 0.05, p < 0.01). And triptolide (1 and 10 μg/L) could reduce the expression of total and active transforming growth factor β1 (p < 0.05, p < 0.01). In conclusion, triptolide can inhibit the expression of thrombospondin-1 and transforming growth factor β1 in mRNA and protein levels and down-regulate the levels of total and active transforming growth factor β1.
Introduction
Renal tubulointerstitial fibrosis is the final pathological consequence in the progress of many chronic renal diseases,Citation1 also one of the fundamental pathological changes causing end-stage renal disease (ESRD). Most of the advanced renal disease, no matter primary disease comes from glomerular, renal tubular or renal vessel, has renal tubulointerstitial fibrosis, and renal tubulointerstitial fibrosis indicates a bad prognosis. So, the conjunct pathway that kinds of chronic renal disease progress in ESRD is renal tubulointerstitial fibrosis. These facts indicate that studying the mechanism of renal tubulointerstitial fibrosis deeply and selecting the appropriate drugs incipiently to intervene its occurrence and development can delay the deterioration and progression of renal function. It has a significant effect on improving patients’ prognosis. Many studies have revealed that one of the most significant stages of renal tubulointerstitial fibrosis is the excessive activation of transforming growth factor β1 (TGF-β1).Citation2 Studies have identified that thrombospondin-1 (TSP1) is the key factor in activation of TGF-β1, active TGF-β1 induced by TSP1 plays important roles in the occurrence and development of many fibrotic diseases.Citation3,Citation4 As one of the main effective composition in Tri pterygium wilfordii, triptolide has various pharmacological action of immunosuppression, restraining inflammation, resisting tumor, antifertility and so on. Animal experiments and clinical trials have revealed that triptolide had an inhibitive effect on fibrosis in lungs, liver and myocardium, and also had a favorable effect in delaying renal failure.Citation5,Citation6 In order to reveal the mechanism of triptolide on prevention and treatment of renal tubulointerstitial fibrosis, based on culturing of human renal tubular epithelial cells (HTEC/HK-2) in vitro, our study investigated the effect of triptolide on expression of TSP1 and TGF-β1 in renal tubular cells when in the presence of angiotensin-II (AngII) so that provided with theoretical basis for clinical application of triptolide.
Materials and methods
Main materials
HK-2 was purchased from Peking Union Medical College. Standard triptolide (purity >99%, Fujian Institute of Pharmaceutical Research) was dissolved freshly by dimethyl sulfoxide (DMSO), and diluted with Dulbecco’s modified Eagle’s medium/F12 (DMEM/F12) to needed concentration of laboratory so that the terminal dilutions of DMSO in culture medium were less than 1%. The other experiment reagents and its manufactures/venders were showed as follows. Standard AngII (Sigma-Aldrich, St. Louis, MO); Fetal bovine serum (Sijiqing, Zhejiang, China); Culture medium DMEM/F12 and trypsin (Gibco, Carlsbad, CA); Mouse-anti-human TSP1 Monoclonal Antibody (R&D, Minneapolis, MN); Rabbit-anti-human TGF-β1 Polyclonal Antibody (Santacruz, Dallas, TX); Mouse-anti-human β-actin Monoclonal Antibody (R&D, Minneapolis, MN); Column RNA Purification Kit (Sangon Biotech, Shanghai, China); Two Step Fluorescence Amplification Kit and Fluorescence Reverse Transcriptase Kit (Takara, Dalian, China); Human TGF-β1 Immunoassay Kit (Sangon Biotech, Shanghai, China); HRP-labeled Goat Anti-Mouse and Goat Anti-Rabbit Antibodies (KPL, Gaithersburg, MD).
Screening triptolide concentration using MTT assay
The HK-2 cells were cultured in culture bottle containing DMEM/F12 medium and 10% fetal bovine serum at 37 °C in 5% CO2 atmosphere. HK-2 cells in logarithmic growth phase were adjusted to cell suspensions at 5 × 10⁵ cells/mL. 80 μL of cell suspensions was added in each well of 96-well microplate and cultured for 4 h at 37 °C in 5% CO2 atmosphere. After cells attachment, 20 μL of triptolide with its different concentrations or solvent control was added (terminal concentration was 160–165 μg/mL) and continued to culture for 48 h. And then, 20 μL of MTT solution at 2.5 mg/mL was added into each well. After shaking for 3–5 min using micro-oscillator, continued to culture for 4 h and the MTT solution was removed, 150 μL of DMSO was then added. After shaking for 10 min using micro-oscillator, measured absorbance (A) value at a wavelength of 570 nm with enzyme-labelling measuring instrument. We measured 6 wells parallelly for every concentration to obtain average of A value and calculated cell growth inhibition rate based on following formulas: survival rate/% = Aexperiment/Acontrol ×100%, inhibition rate/% = 100% − survival rate. Inhibitory concentration 50 (IC50) was calculated through curve fitting analysis using Origin5.0 software (Northampton, MA).
Cells culture, cell viability detection and grouping
The HK-2 cells, whose density were adjusted to 1 × 10⁶, were cultured in DMEM/F12 containing 10% fetal bovine serum at 37 °C in 5% CO2 incubator. After one day, 10% fetal bovine serum was changed to 1% fetal bovine serum and cultured for 24 h to make cells synchronize. Cell viability detection was determined by trypan blue exclusion test and our experiment had a survival cell rate of over 95%. Cells were randomly assigned to five groups according to the following methods: blank control group, AngII group (terminal concentration was 10−7 mol/L), triptolide with low concentration group (0.1 µg/L triptolide + 10−7 mol/L AngII), triptolide with middle concentration group (1 µg/L triptolide + 10−7 mol/L AngII) and triptolide with high concentration group (10 µg/L triptolide + 10−7 mol/L AngII). Triptolide was added 1 h early than AngII. The cells were continued to culture for 24 h, and were collected for testing of all indexes. There were 3 parallel wells in each group and 3 repeated independent trials.
Real Time PCR
RNA purification and PCR amplification were performed according to manufacturer’s kit instructions. Total RNA was extracted from the HK-2 cells using Column RNA Purification Kit. The RNA was reverse-transcribed into cDNA by the reverse transcriptase Primescript™ RTase (Takara, Dalian, China) according to 20 µL reaction system. Then, using resultant cDNA as template, real time PCR amplification for getting target genes (TSP1, TGF-β1, GAPDH) was performed by SYBR® Premix Ex Taq™ (Takara, Dalian, China) according to 25 µL reaction system. All the primers were synthesized by Takara Biotechnology Co., Ltd. (Dalian, China). Primer sequences were as following: TSP1 (66 bp): the forward primer was 5′-GGCCACTGCAGCTGATGCGATGCGTAA-3′ and the reverse primer was 5′-GGAGACAACGACTGGCTTCTGGAC-3′; TGF-β1 (130 bp): the forward primer was 5′-GCAGTGTGTTACCCCTGCTGTCA-3′ and the reverse primer was 5′-AGCGACTGGCCAGAGTGGTTA-3′; GAPDH (143 bp): the forward primer was 5′-TGGGTGTGAACCACGAGAA-3′ and the reverse primer was 5′-GGCATGGACTGTGGTCATGA-3′. Reaction conditions of reverse transcription were 37 °C for 15 min followed by 85 °C for 5 s. Reaction conditions of Real Time PCR were 95 °C for 10 s for once followed by 40 cycles of 95 °C for 5 s and 40 cycles of 60∼61 °C for 30 s. Comparisons and analyses of obtained threshold cycle (Ct) between groups used Folds = 2−ΔΔCt.Citation7
Western blot
After extracted total proteins of the cells and measured its concentrations, 50 µg supernatants of each sample were taken to sodium dodecyl sulfate-polyacrylamide gel electrophoresis (SDS-PAGE) (for TSP1 with 6%, for TGF-β1 with 12%) and then were electro transferred to polyvinylidene difluoride (PVDF) membrane by Semi-dry Transfer. All the membranes were incubated overnight at 4 °C with I antibody (1:400 dilution of TSP1 Polyclonal Antibody and TGF-β1 Polyclonal Antibody) and 1: 10,000 β-actin monoclonal antibody. And then incubated for 1 h at room temperature with α antibody (all were 1: 3000 dilution of HRP-labeled Goat Anti-Mouse or Goat Anti-Rabbit Antibodies). The graphs were developed using the chemiluminescence methods. Gray scale value of every special band obtained from scanned image was analyzed using the Image J software. Using β-actin as the internal reference, we expressed the relative protein contents by Gray scale value ratio of target protein and internal reference.
ELISA detection
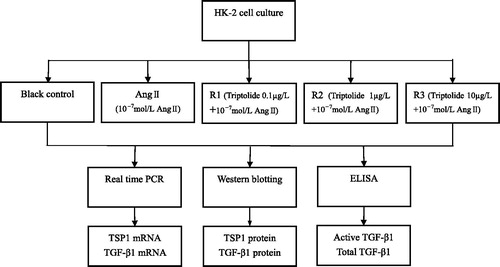
The levels of active and total TGF-β1 in cell supernatants were determined using instruction of Human TGF-β1 Immunoassay Kit. Detection samples of total TGF-β1 needed to handle with 1 mol/L hydrochloric acid previously, while active TGF-β1 did not need. Test flow chart is showed in .
Figure 1. Test flow chart.
Statistical analysis
Statistical analyses were performed using SPSS 10.0 software (Chicago, IL). Data of index were expressed by if it accorded with normal distribution. Comparison between two groups whose data accorded with normal distribution was performed using student’s t test. Comparison of mean between more groups was performed using one-way analysis of variance if the data accorded with normal distribution and met homogeneity of variance. Difference between groups was examined by the Student–Newman–Keuls test (SNK). Size of test was α = 0.05, and p < 0.05 was considered statistically significant.
Results
Inhibiting effect of triptolide on HK-2 cells
Triptolide could inhibit proliferation of HK-2 cells, and IC50 was 88.56 µmol/L. Our experiment saw that cells had no significant change when triptolide concentration was 0.01–0.1 µg/L, while cells shrank significantly and dead cells increased obviously when triptolide concentration was 100 µg/L.
Effects of AngII on expression of TSP1 and TGF-β1 in HK-2 cells
Results of Real Time PCR indicated that AngII (10−7 mol/L) could up-regulate the expression of TSP1 mRNA obviously in HK-2 cells (3.66 ± 0.48 vs. 1.33 ± 0.26, tTSP1 = 2.966, p < 0.05) when compared with blank control group, and with the increased expression of TGF-β1 mRNA (3.58 ± 0.59 vs. 1.26 ± 0.28, tTGF-β1 = 2.874, p < 0.05).
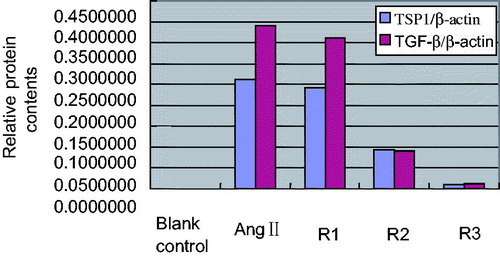
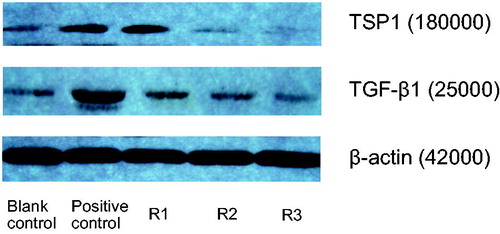
Results of Western Blot revealed that AngII (10−7 mol/L) also could up-regulate the expression of TSP1 protein (0.5126 ± 0.0936 vs. 0.1025 ± 0.0761, tTSP1 = 3.833, p < 0.01), and with the increased expression of TGF-β1 protein (0.5948 ± 0.0736 vs. 0.1318 ± 0.0614, tTGF-β1 =3.795, p < 0.01). The results are shown in and .
Figure 2. Effects of triptolide on expression of TSP1 and TGF-β mRNA in AngII-induced HK-2 cells (Real Time PCR). Note: Blank control (no any drugs were added); positive control (10−7 mol/L AngII only); R1: triptolide 0.1 µg/L + 10−7 mol/L AngII; R2: triptolide 1 µg/L + 10−7 mol/L AngII; R3: triptolide 10 µg/L + 10−7 mol/L AngII.
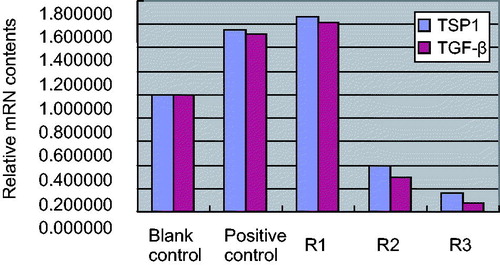
Figure 3. Effects of triptolide on expression of TSP1 and TGF-β protein in AngII-induced HK-2 cells. Note: Blank control (no any drugs were added); positive control (10−7 mol/L AngII only); R1: triptolide 0.1 µg/L + 10−7 mol/L AngII; R2: triptolide 1 µg/L + 10−7 mol/L AngII; R3: triptolide 10 µg/L + 10−7 mol/L AngII.
Effects of triptolide on expression of TSP1 and TGF-β1 in AngII-induced HK-2 cells
Compared with positive control AngII (10−7 mol/L), low concentration triptolide had no obvious effect on expression of TSP1 mRNA and TGF-β1 mRNA in HK-2 cells (qTSP1 = 2.73, qTGF-β1 = 2.95, p > 0.05 for both); middle concentration triptolide inhibited expression of TSP1 mRNA and TGF-β1 mRNA in AngII-induced HK-2 cells (qTSP1 = 4.35, qTGF-β1 = 4.38, p < 0.05 for both); high concentration triptolide inhibited expression of TSP1 mRNA and TGF-β1 mRNA in AngII-induced HK-2 cells obviously (qTSP1 = 6.33, qTGF-β1 = 6.89, p < 0.01 for both). The results are shown in and
At the same time, in comparison with positive control AngII (10−7 mol/L), low-concentration triptolide also had no obvious effect on expression of TSP1 and TGF-β1 protein in HK-2 cells (qTSP1 = 2.26, qTGF-β1 = 2.39, p > 0.05 for both); middle concentration triptolide inhibited expression of TSP1 and TGF-β1 protein in AngII-induced HK-2 cells (qTSP1 = 4.15, qTGF-β1 = 4.41, p < 0.05 for both); high concentration triptolide inhibited expression of TSP1 and TGF-β1 protein in AngII-induced HK-2 cells obviously (qTSP1 = 6.35, qTGF-β1 = 6.91, p < 0.01 for both). The results are shown in and .
Figure 4. Effects of triptolide on expression of TSP1 and TGF-β protein in AngII-induced HK-2 cells. Note: Blank control (no any drugs were added); positive control (10−7 mol/L AngII only); R1: triptolide 0.1 µg/L + 10−7 mol/L AngII; R2: triptolide 1 µg/L + 10−7 mol/L AngII; R3: triptolide 10 µg/L + 10−7 mol/L AngII.
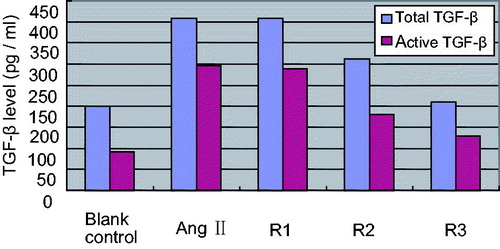
Effects of triptolide on expression of active TGF-β1 in HK-2 cells
Compared with blank control, total and active TGF-β1 in supernatant of cultured HK-2 cells were increased remarkably when induced by AngII (ttotal = 2.890, tactive = 2.785, p < 0.05). In comparison with positive control, the level of total and active TGF-β1 in low concentration triptolide group did not show obvious variation (qtotal = 1.04, qactive = 1.12, p > 0.05); the levels of total and active TGF-β1 in middle concentration triptolide group were both decreased (qtotal =4.12, qactive = 4.45, p < 0.05); the levels of total and active TGF-β1 in high concentration triptolide group were both decreased obviously (qtotal = 6.33, qactive = 6.48, p < 0.01). The results are shown in .
Figure 5. Effects of different concentration triptolide on levels of total and active TGF-β. Note: Blank control (no any drugs were added); positive control (10−7 mol/L AngII only); R1: triptolide 0.1 µg/L + 10−7 mol/L AngII; R2: triptolide 1 µg/L + 10−7 mol/L AngII; R3: triptolide 10 µg/L + 10−7 mol/L AngII.
Discussion
Renal tubulointerstitial fibrosis is the final pathological consequence in the progress of chronic renal diseases and is the significant determining factor of its prognosis. Studies in recent years have indicated that renal tubular epithelial cells play a crucial role in progressive tubulointerstitial fibrosis. They were not only the passive victims but also the active participants of renal tubulointerstitial fibrosis.Citation8 In certain pathological conditions, they might be the important source of inflammatory factor, growth factor and chemokine in renal tissue. Existed studies have revealed that renal tubular epithelial cells participate in the damage of kidney by expressing MCP-1, RANTES, MIP-1, TGF-β1 and connective tissue growth factor and so on. Many elements, such as AngII and high glucose, could induce renal tubular epithelial cells to express these damage factors. Moreover, some factors, such as AngII, could promote renal tubulointerstitial fibrosis based on inducing renal tubular epithelial-myofibroblast transdifferentiation. Studies have found that TSP1 and TGF-β1 play a major role in the pathological progress of renal tubulointerstitial fibrosis. As the key activating factor of TGF-β1 upstream, TSP1 dissociates the noncovalent binding of TGF-β1-LAP by contact reaction with latency associated peptide (LAP) of TGF-β1 so that makes TGF-β1 active and performs its pathological function.Citation2,Citation3 As the key medium of growth, differentiation and immunoreactions of cells in body, excessive activation of TGF-β1 is closely related to renal tubulointerstitial fibrosis. TGF-β1 neutralizing antibody could distinctly improve renal pathology in experimental animal, relieve renal inflammatory response and inhibit renal tubulointerstitial fibrosis. As a consequence, searching for drugs to inhibit release of the inflammatory factor, growth factor and others is a key to prevent renal tubulointerstitial fibrosis.
Triptolide is the main effective composition of Tri pterygium wilfordii. Modern chemical and pharmacological studies had revealed that triptolide had various pharmacological action of immunosuppression, restraining inflammation, resisting tumor, antifertility and so on. Animal experiments and clinical trials have exposited that triptolide had an inhibitive effect on fibrosis in lungs, liver and myocardium. In recent years, plentiful domestic and international researches about triptolide made its pharmacological action understand constantly and range of clinical application expand gradually. In order to reveal the mechanism of triptolide on prevention and treatment of renal tubulointerstitial fibrosis, based on culturing of HTEC in vitro, our study investigated the influence of triptolide on expression of TSP1 and TGF-β1 in AngII-handled HK-2 cells.
Our study found that TSP1 in the renal tubular epithelial cells expressed properly under normal condition, AngII could increase expression of TSP and TGF-β1 in HK-2 cells in the mRNA and protein levels. Results of ELISA also revealed that AngII could up-regulate the level of total and active TGF-β1 obviously in supernatant of cultured HK-2 cells. Our previous study manifested that expression peak time of TSP1 was prior to expression peak time of TGF-β1. This indicates that TSP1 may play an important role at early stage of disease and the above effect is beneficial for body to mobilize TGF-β1 precursor complex to activate quickly in pathologic condition. Under physiological condition, TGF-β1 is the non-active precursor complex. Only when non-active TGF-β transits to active status, TGF-β can combine with its receptor and then activate TGF-β signal transduction pathway to trigger downstream effect. Active TGF-β1 is the major form to play its pathologic role. TSP1 is the key activating factor of TGF-β1 upstream. Through contact reaction with LAP of TGF-β1, it dissociates the noncovalent binding of TGF-β1-LAP and makes TGF-β1 active and performs its pathological function. TGF-β1 exists in the form of non-active precursor complex originally. Under the specific pathological or physiological conditions, TGF-β transition from non-active status to active status is one of the crucial factors to determine the level of active TGF-β1 in particular organs and tissues.Citation9,Citation10 Our study demonstrated that the expression of TGF-β1 mRNA and protein increased simultaneously when the TSP’s up-regulated. That AngII can up-regulate the expression of TGF-β1 may be connected with activating TSP1-TGF-β1 pathway.
Intervention trial of triptolide demonstrated that triptolide could inhibit proliferation of HK-2 cells. Middle and high concentration triptolide (1 μg/L and 10 μg/L) not only inhibited the expression of TSP1 and TGF-β1 in mRNA and protein level in AngII-induced HK-2 cells, but also reduced the expression of total and active TGF-β1 in AngII-induced HK-2 cells. Recent studies found that TGF-β1 activation induced by TSP1 participated in occurrence and development of many fibrotic diseases, active TGF-β1 was the major form to play its physiopathologic role.Citation11,Citation12 In the rat studies of diabetes and remnant kidney model, TSP1 peptide inhibitor (GGWSHW peptide) could decrease the expression of active TGF-β1 evidently, reduced the sediment of matrix protein in renal tissue and improved renal fibrosis.Citation13,Citation14 Similar presentation was found in TSP1 gene knockout mice and TGF-β1 gene knockout mice.Citation15,Citation16 Therefore, intervening the generation of TSP1 may be the important target to prevent and treat renal tubulointerstitial lesions. This study suggested that triptolide could suppress TSP1-TGF-β1 pathway by inhibiting the expression of upstream factor TSP1 in mRNA and protein level so that down-regulate active TGF-β1 level on one side, and hit the target of preventing and treating renal fibrosis by inhibiting the expression of TGF-β1 mRNA and protein directly on the other.
Declaration of interest
The study did not accept any funding. There are no conflict of interest in our study.
References
- Eddy AA. Molecular basis of renal fibrosis. Pediatr Nephrol. 2000;15(3–4):290–301
- Kliem V, Johnson RJ, Alpers CE, et al. Mechanisms involved in the pathogenesis of tubulointerstitial fibrosis in 5/6-nephrectomized rats. Kidney Int. 2001;49(3):666–678
- McGregor B, Colon S, Mutin M, et al. Thrombospondin in human glomerulopathies: A marker of inflammation and early fibrosis. Am J Pathol. 1994;144(6):1281–1287
- Johnsen SA, Subramaniam M, Spelsberg TC, et al. TGF beta inducible early gene enhances TGF beta/Smad-dependent transcriptional responses. Oncogene. 2002;21(37):5783–5790
- Liu MX, Dong J, Yang YJ, et al. Progress in research on triptolide. China J Chin Materia Medica. 2005;30(3):170–174
- Niu YL, He Y, Chen AP, et al. The effect of triptolide on pulmonary fibrosis Rats. J Clin Internal Med. 2007;23:121–123
- Essential Subject in Life Sciences Forum. Real time quantitative PCR protocol for detection of gene expression. Trends Life Sc. 2003;1(4):117–225
- Jinde K, Nikolic-Paterson DJ, Huang XR, et al. Tubule cells in progressive tubulointerstitial fibrosis in human glomerulonephritis. Am J Kidney Dis. 2001;38(4):761–769
- Weigert C, Sauer U, Brodbeck K, et al. AP-1 proteins mediate hyperglycemia induced activation of the human TGF-β1 promoter in mesangial cells. J Am Soc Nephrol. 2000;11(11):2007–2016
- Poczatek MH, Hugo C, Darley-Usmar V, et al. Glucose sitimulation of transforming growth factor-beta bioactivity in mesangial cells is mediated by thrombospondin-1. Am J Pathol. 2000;157(4):1353–1363
- Snolewski P, Halika HD, et al. Thrombospondin-1 is a major activator of TGF-β1 in pancreatutis fibrosis. Immunol Meth. 2000;228:112–132
- Davoli MA, Tan JR. Thrombospondin-1, transforming growth factor-b, lung fibrosis. J Biol Chem. 2000;276:117–132
- Hugo C, Kang DH, Johnson RJ. Sustained expression of Thrombospondin-1 is associated with the development of glomerular and tubulointerstitial fibrosis in the remnant kidney model. Nephron. 2002;90(4):460–470
- Kliem V, Johnson RJ, Alpers CE, et al. Mechanisms involved in the pathogenesis of tubulointerstitial fibrosis in 5/6-nephrectomized rats. Kidney Int. 2002;49(3):666–678
- Nakagawa T, Lan HY, Glushakova O, et al. Role of ERK1/2 and p38 mitogen-activated protein kinases in the regulation of thrombospondin-1 by TGF-beta1 in rat proximal tubular cells and mouse fibroblasts. J Am Soc Nephrol. 2005;16(4):899–904
- Wahab NA, Schaefer L, Weston BS, et al. Glomerular expression of thrombospondin-1, transforming growth factor beta and connective tissue growth factor at different stages of diabetic nephropathy and their interdependent roles in mesangial response to diabetic stimuli. Diabetologia. 2005;48(12):2650–2560