
Abstract
Diabetic nephropathy is one of the most common chronic complications of diabetes with poor efficacy of clinical treatment. This study investigated the protective effects of leflunomide, a new immunosuppressant, on tubulointerstitial lesions in a rat model of diabetic nephropathy. Diabetes was induced with streptozotocin (STZ, 50 mg/kg) by intraperitoneal injection in male Wistar rats. Two weeks after STZ injection, diabetic rats were treated daily for 8 weeks with low (5 mg/kg) and high dose (10 mg/kg) of leflunomide, and benazepril hydrochloride (4 mg/kg) as a positive control. In diabetic rats, the 24-h urine volume, urine protein and microalbumin, blood creatinine and urea nitrogen significantly increased, which were attenuated by leflunomide treatment in a dose-dependent manner (all p < 0.05). The increase of kidney weight/body weight and the histopathological findings of tubulointerstitial lesion in diabetic rats were mitigated by leflunomide treatment. Immunohistochemistry study and real-time polymerase chain reaction results demonstrated that osteopontin (OPN), transforming growth factor beta 1 (TGF-β1), α-smooth muscle actin and CD68 expression in the renal tubulointerstitial region were significantly increased in the diabetic rats, while these increases were inhibited by leflunomide treatment. These findings suggest that leflunomide protects the kidney injury of diabetic rats might through its inhibition of OPN/TGF-β1 mediated extracellular matrix deposition and tubulointerstitial fibrosis, as well as its inhibition on tubular epithelial-myofibroblast transdifferentiation.
Introduction
Diabetic nephropathy (DN) is one of the most common chronic complications of diabetes, and the main reason of causing end stage renal disease.Citation1 Multiple pathological mechanisms might be involved in the pathogenesis and development of DN including inflammation, disorders of immune response and cytokines, lipid metabolism, renin–angiotensin system, high sugar and non-enzymatic protein glycation which lead to the formation of so-called advanced glycation end products.Citation2–4 The complexity of the mechanisms involved in the pathogenesis of DN leads to the poor efficacy of the treatment with insulin combined with angiotensin-converting enzyme inhibitor or angiotensin receptor blocker.Citation5,Citation6 To better understanding of the mechanisms and pathological changes is critical for clinical treatment of this disease.
Leflunomide (brand names: Arabloc, Arava, Lunava, Repso) is a new immunosuppressant, which has been widely used in recent years for treatment of various kidney diseases, including nephrotic syndrome and IgA nephropathy.Citation7–9 However, it is not clear the effects of leflunomide in the treatment of DN and the mechanisms involved. In this study, we investigated the protective effects of leflunomide on tubulointerstitial lesions in a rat model of DN and the involved mechanisms by determining its effects on renal expression of osteopontin (OPN), transforming growth factor beta 1 (TGF-β1), CD68, and α-smooth muscle actin (α-SMA) at both protein and mRNA levels.
Materials and methods
Animal use
Male Wistar rats (weighing 180–200 g) were obtained from Shandong University School of Medicine Laboratory Animal Center and all the animal study protocols were approved by the Institutional Animal Research and Ethics Committee of Shandong University. Rats were allowed to acclimate to controlled temperature (22 ± 2 °C) and light (12-h light/dark cycle) with ad libitum access to food and water, through the experimental period.
Experiment protocol
Rats were anesthetized with 125 mg/kg thiopentone, and the right kidney was removed as previously described.Citation10 Two weeks later, these animals were intraperitoneally injected with streptozotocin (STZ, 50 mg/kg, Sigma, St. Louis, MO) or vehicle (0.1 mol/L citrate buffer, pH 4.5), respectively, to generate diabetic model.Citation10 Blood samples of the rats were collected from the tail vein 72 h after STZ administration for blood glucose (BG) measurement. The rats with blood BG level >11.1 mmol/L were considered as diabetes mellitus (DM) rats.
Two weeks after STZ injection, diabetic rats were randomly divided into four groups receiving vehicle (group DM-V), low dose (5 mg/kg) of leflunomide (group LEF-low), high dose (10 mg/kg) of leflunomide (group LEF-high), and benazepril hydrochloride (4 mg/kg, Sigma, St. Louis, MO) as a positive control (group Ben). There were eight rats in each group. All of these drugs were freshly prepared and were intragastrically administered daily, with the volume of 10 mL/kg, for 8 weeks. Body weight (BW) and BG was measured once a week. Subcutaneous injection of insulin (1–2 units) was administered to the diabetic rats with BG >23 mmol/L to avoid the development of ketosis.
Specimen collection
At 4 and 8 weeks of leflunomide treatment, all the rats were put in individual metabolic cages for the collection of 24-h urine. After the measurement of the total volume of 24-h urine, 5 mL of urine was kept in −20 °C freezer for further measurements of urine protein and microalbumin. On the day before animal sacrifice, rats were fasted for 12 h and blood samples were collected and the serum was immediately separated for creatinine and urea nitrogen assay. For animal sacrifice and tissue collection, rats were anesthetized with sodium pentobarbital (50 mg/kg), and the left kidney was removed, washed with cold-ice saline, weighed and dissected into two parts. One part was fixed in 10% paraformaldehyde for histology and immunohistochemical study. The second part was frozen in liquid nitrogen and stored at −80 °C for polymerase chain reaction (PCR) assay. Renal hypertrophy index was determined by left kidney weight/body weight (KW/BW, mg/g).
Morphologic analysis and immunohistochemistry study
Paraformaldehyde-fixed and paraffin-embedded kidney sections were deparaffinized and stained with hematoxylin & eosin (HE). For immunohistochemistry study, the slides were exposed to 3% hydrogen peroxide to block endogenous peroxidase activity, and subjected to antigen retrieval via immersion in citric acid (pH 6.0, 0.01 mol/L) at 95 °C for 15 min, followed by slow cooling to 60 °C. After treatment with the blocking serum, tissue sections were incubated with antibodies (all the primary antibodies were from ABCAM, Cambridge, MA) against CD68 (1:200, ab955), α-SMA (1:100, ab5694), TGF-β1 (10 µg/mL, ab64715), or OPN (1:200, ab8448) overnight at 4 °C, rinsed with PBS, and incubated with biotinylated secondary IgG (Vector Laboratories, Burlingame, CA) at 37 °C for 1 h. Antibody binding was detected with the Vectastain ABC Elite avidin/biotin/peroxidase kit (Vector Laboratories) for 30 min at room temperature, followed by incubation with the peroxidase substrate solution, diaminobenzidine. The tissue sections were counterstained with hematoxylin, dehydrated, mounted, and observed under a Leica DM4000B microscope (Bannockburn, IL) with a ×400 objective. The pictures were taken from 10 random fields and quantified using ImageJ software (NIH, Bethesda, MD).
Real-time quantitative PCR
Real-time quantitative PCR (RT-qPCR) was used to measure mRNA levels in the tissues. Total RNA was extracted from frozen kidney using TRIzol reagent, and processed according to the manufacturer’s recommendations. Complementary first strand DNA was synthesized from oligo (dT)-primed total RNA, using the Omniscript RT kit (Qiagen Inc., Valencia, CA). Relative quantification of mRNA levels by RT-qPCR was performed using a SYBR Green PCR kit (Qiagen Inc., Valencia, CA). Amplification and detection were performed with the ABI7500 Sequence Detection System (Applied Biosystems, Foster City, CA). RT-qPCR was carried out in duplicate; a no-template control was included in each run to check for contamination. Sequence-specific oligonucleotide primers were designed according to published GenBank sequences (). The relative target mRNA levels in each sample were normalized to internal control, glyceraldehyde 3-phosphate dehydrogenase (GAPDH).
Table 1. Primer sequences for quantitative real-time PCR.
Statistical analysis
All the results are reported as mean ± SEM. For all the endpoints, one-way ANOVA was used to determine the significance of differences among groups. Significance of interactions between groups was determined using Tukey post hoc tests. Differences for all the tests were considered significant at p < 0.05. Analyzes were performed using GraphPad Prism, version 6 (GraphPad, San Diego, CA).
Results
Body weight and kidney weight
After 4 and 8 weeks of leflunomide treatment, the BW of the control rats was significantly higher than other groups (p < 0.05). However, at 8 weeks of the experiment, the BW of high dose of leflunomide-treated rats was higher than vehicle-treated DM rats, while it was still less than control animals (p < 0.05) ().
Figure 1. Body weight and kidney weight of rats from various groups. DM, diabetes mellitus group; V, vehicle; Ben, benazepril; LEF, leflunomide. Values are mean ± SEM; n = 8; *p < 0.05 versus control, #p < 0.05 versus vehicle-treated DM rats.
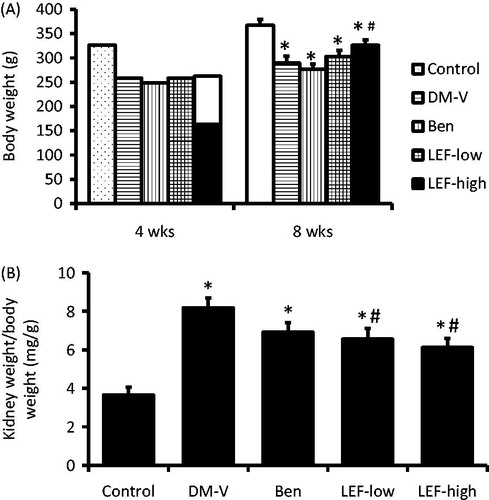
At the end of the experiment, the KW/BW was significantly increased in DM rats, which was attenuated by both low and high doses of leflunomide treatment. KW tended to decrease in benazepril versus vehicle-treated rats, but this difference did not reach statistical significance ().
General biochemical parameters of urine
After 4 and 8 weeks of the treatments, the 24-h urine volume, 24-h urine protein and microalbumin significantly increased in vehicle-treated DM rats (p < 0.05). As expected, all these parameters, except the 24-h urine volume, were decreased by the benazepril treatment. The 24-h urine volume tended to decrease in benazepril-treated rats, but this decrease did not reach statistical significance. Interestingly, the increases of these parameters in DM rats were also inhibited by LEF treatment for both 4 and 8 weeks in a dose-dependent manner ().
Table 2. The urine 24-h volume, 24-h urine protein and microalbumin.
Blood creatinine and urea nitrogen
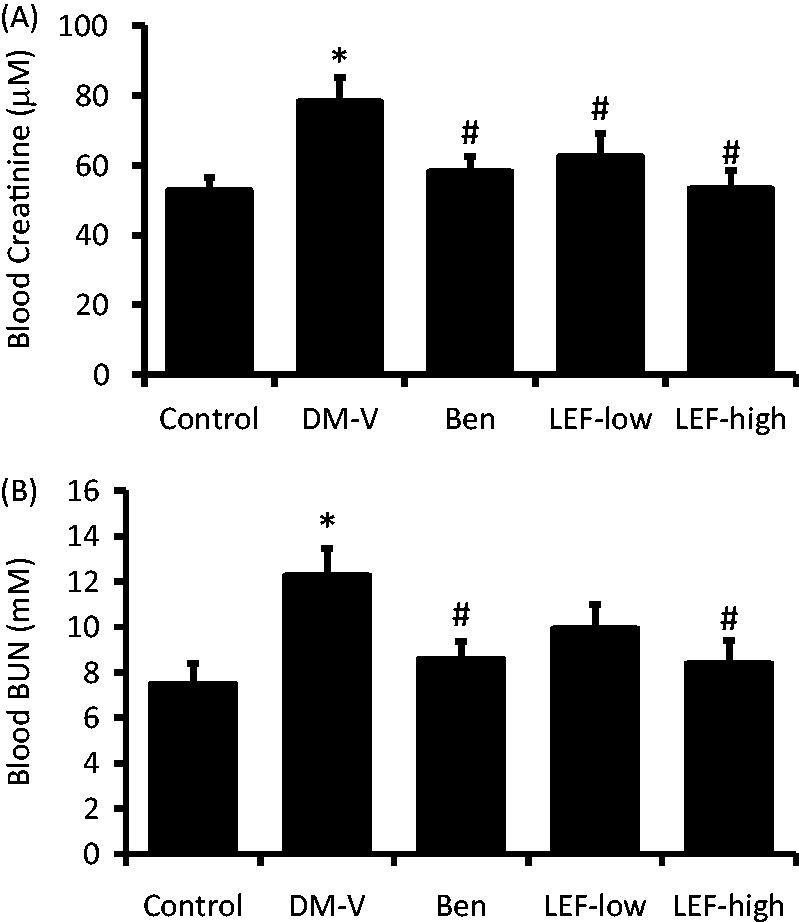
At the end of the study, blood creatinine and urea nitrogen (BUN) was analyzed. As shown in , compared with control rats, both blood creatinine and BUN increased in DM rats, which was inhibited by benazepril treatment. High dose of LEF decreased blood creatinine and BUN levels, while low dose of LEF significantly decreased blood creatinine and tended to decrease BUN compared with vehicle-treated DM rats ().
Figure 2. Blood creatinine and urea nitrogen (BUN) of rats from various groups. DM, diabetes mellitus group; V, vehicle; Ben, benazepril; LEF, leflunomide. Values are mean ± SEM; n = 8; *p < 0.05 versus control, #p < 0.05 versus vehicle-treated DM rats.
Pathological findings in the kidney
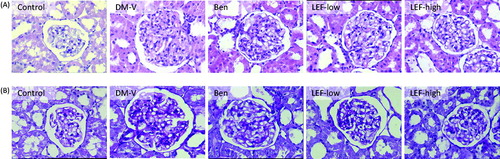
shows the results of histological study. The normal kidney of the non-diabetic rats revealed normal glomerulus surrounded by the Bowman’s capsule, proximal and distal convoluted tubules without any pathological changes. The kidneys of vehicle-treated diabetic rats showed glomerular hypertrophy, thickening of the basement membrane, mesangial cells proliferation and widened mesangial regions. Mild glomerular sclerosis has also been observed in the diabetic kidneys. Some tubular cells showed hypertrophy, vacuolar degeneration, and luminal narrowing. PAS staining showed that in DM rats, pink staining of mesangial regions was significantly expanded, suggesting glomerular basement membrane thickening and the increased extracellular matrix. All these changes were significantly attenuated by the treatments with benazepril and LEF.
Figure 3. Representative hematoxylin & eosin staining (A) and PAS staining (B) in the kidney of rats from various groups. DM, diabetes mellitus group; V, vehicle; Ben, benazepril; LEF, leflunomide; Magnification = 400×.
α-SMA and CD68 expression in the kidney
Immunohistochemistry study showed very less staining of α-SMA and CD68 in the renal tubulointerstitial region of normal control rats. However, in the DM rats, these expressions were significantly increased in the kidney. Interestingly, these increases were attenuated by the treatments of either benazepril or LEF ( and ).
Figure 4. Renal α-SMA expression in diabetic rats treated with vehicle, benazepril or leflunomide for 8 weeks. (A) Representative images showing α-SMA staining in the kidney (Magnification = 400X). (B) α-SMA staining intensity quantified using ImageJ. (C) Renal α-SMA mRNA levels determined by real-time PCR. DM, diabetes mellitus group; V, vehicle; Ben, benazepril; LEF, leflunomide. Values are mean ± SEM; n = 8; *p < 0.05 versus control, #p < 0.05 versus vehicle-treated DM rats.
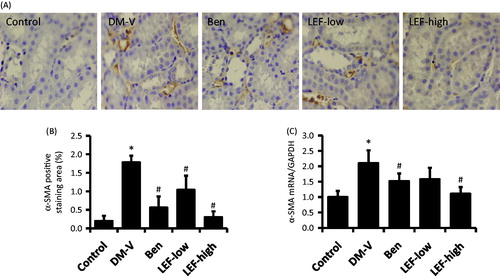
Figure 5. Renal CD68 expression in diabetic rats treated with vehicle, benazepril or leflunomide for 8 weeks. (A) Representative images showing CD68 staining in the kidney (Magnification = 400X). (B) CD68 staining intensity quantified using ImageJ. (C) Renal CD68 mRNA levels determined by real-time PCR. DM, diabetes mellitus group; V, vehicle; Ben, benazepril; LEF, leflunomide. Values are mean ± SEM; n = 8; *p < 0.05 versus control, #p < 0.05 versus vehicle-treated DM rats.
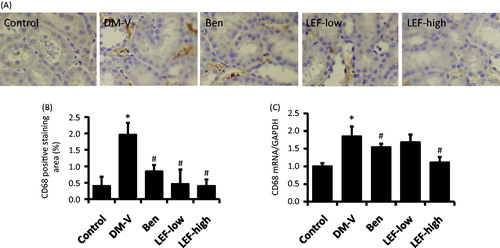
Consistent with the immunohistochemistry findings, real-time PCR results revealed that the renal mRNA levels of α-SMA and CD68 significantly increased in the DM versus control rats, which were attenuated by benazepril and LEF treatments ( and ).
TGF-β1 and OPN expression in the kidney
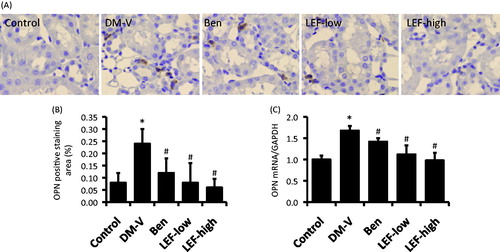
There was very less TGF-β1 and OPN expression in the renal tubulointerstitial region of normal control rats determined by immunohistochemistry study, while they were significantly increased in the DM rats ( and ). Both immunohistochemistry study and real-time PCR showed that the increases of renal tubulointerstitial expression of TGF-β1 and OPN were inhibited by either benazepril or LEF treatment ( and ).
Figure 6. Renal TGF-β1 expression in diabetic rats treated with vehicle, benazepril or leflunomide for 8 weeks. (A) Representative images showing TGF-β1 staining in the kidney (Magnification = 400X). (B) TGF-β1 staining intensity quantified using ImageJ. (C) Renal TGF-β1 mRNA levels determined by real-time PCR. DM, diabetes mellitus group; V, vehicle; Ben, benazepril; LEF, leflunomide. Values are mean ± SEM; *p < 0.05 versus control, #p < 0.05 versus vehicle-treated DM rats.
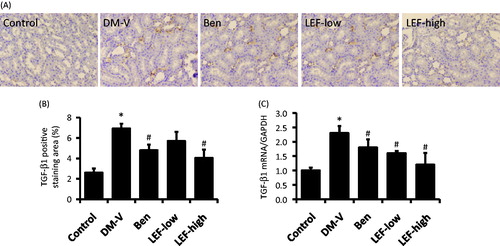
Figure 7. Renal OPN expression in diabetic rats treated with vehicle, benazepril or leflunomide for 8 weeks. (A) Representative images showing OPN staining in the kidney (Magnification = 400X). (B) OPN staining intensity quantified using ImageJ. (C) Renal OPN mRNA levels determined by real-time PCR. DM, diabetes mellitus group; V, vehicle; Ben, benazepril; LEF, leflunomide. Values are mean ± SEM; * p < 0.05 versus control, #p < 0.05 versus vehicle-treated DM rats.
Discussion
Diabetic nephropathy is the major microvascular complications of diabetes, and the most common cause of end-stage renal disease. It has been previously believed that the development of DN is due to the focal segmental glomerulosclerosis and extracellular matrixc and interstitial cell proliferation.Citation1–4 However, recent pathological studies of DN based on renal biopsy have shown that in addition to glomerular lesions, tubulointerstitial lesions also exist in DN.Citation3,Citation11,Citation12 It has been reported that tubular proteinuria occurs even in the early stage of DN with normal urine protein excretion rate, suggesting tubulointerstitial damage might happen earlier than the glomerular damage.Citation13 Renal tubular epithelial-myofibroblast transdifferentiation plays a very important role in the development of tubular lesion and tubulointerstitial fibrosis.Citation14,Citation15
In the diabetic kidney, the extensive infiltration of monocytes/macrophages can cause the accumulation of extracellular matrix, thickening of the glomerular basement membrane, and the subsequent development of interstitial fibrosis and glomerular sclerosis.Citation16 Studies have shown that diffuse glomerulosclerosis is associated with macrophages infiltration. During this procedure, OPN has been demonstrated to promote macrophage localization and the release of growth factors, such as transforming growth factor-β1 (TGF-β1), resulting in extracellular matrix deposition, and tubulointerstitial fibrosis which is an indicator of poor prognosis of the kidney disease.Citation17 The results from the present study suggest that the inhibition of OPN/TGF-β1 pathway might mediate the protective effects of LEF in the kidney injury of diabetic rats.
OPN is a non-collagenous, sialic acid-rich, and glycosylated phosphoprotein, which is a member of the extracellular matrix (ECM) protein, pro-inflammatory cytokines, chemokines and growth factors. In the kidney, OPN is mainly distributed in the medullary descending thin limb, distal tubule and collecting duct. Studies with 229 patients of type 2 diabetes found that blood OPN level significantly increased, which was positively related to the development of DN.Citation18 In OPN knockout mice, monocyte/macrophage infiltration is significantly reduced, and the tubular interstitial fibrosis is dramatically inhibited.Citation19 The mechanisms of OPN-induced renal fibrosis include:Citation18–22 first, as a powerful macrophage chemokine, OPN promotes macrophage gathering in the renal interstitial region and binds to OPN receptors on the cell surface of macrophages, which induces the release of TGF-β1, platelet-derived growth factor (PDGF), IL-1, and other cytokines. It can also increase the secretion of type I and III collagen, fibronectin, chondroitin sulfate and other extracellular matrix components, resulting in the proliferation of tubule cells, the phenotype transformation of tubule cells and interstitial cells, which finally leads to tubulointerstitial fibrosis and renal dysfunction. Second, as a profibrogenic cytokine, OPN promotes the migration, adhesion and proliferation of fibroblasts. It interacts with collagen, fibronectin and proteoglycans to form stable complexes and increase the synthesis and transformation of ECM components, and thereby induce fibrosis.
TGF-β1 is a cytokine with multiple biological activities. It inhibits ECM degradation by up-regulation of proteinase inhibitors, such as tissue inhibitor of metalloproteinases (TIMPs) or plasminogen activator inhibitor-1 (PAI-1). TGF-β1 is considered one of the most potent factors inducing glomerulosclerosis in the DN.Citation23,Citation24 Clinical study showed that serum and urinary TGF-β1 was an important biochemical markers in DN patients.Citation25 It plays important role in the development of renal interstitial fibrosis mainly through the classical TGF-β1/Smads pathway-mediated renal tubular epithelial cell transdifferentiation.Citation23,Citation24,Citation26
Tubular epithelial-myofibroblast transdifferentiation (TEMT) also plays important role in the pathogenesis of tubular lesson and tubulointerstitial fibrosis.Citation14,Citation15 Myofibroblast is an active cell with the characteristics of fibroblasts and muscle cells. α-SMA is the major structural protein and a specific marker of myofibroblast, which is considered an important indicator of renal tubular epithelial cell transformation and renal interstitial fibrosis.Citation27–29 Therefore, TEMT is mainly characterized with the loss of adhesion characteristics in tubular epithelial cells, i.e., the loss of epithelial adhesion molecules and the loss of a polarity in tubular cells, and the increased expression of the markers of myofibroblast, such as α-SMA. As a marker of renal TEMT, the level of α-SMA expression in the cell is positively correlated with the degree of renal tubulointerstitial fibrosis and renal dysfunction.Citation27–29 In this study, diabetic rats showed kidney failure associated with the increases of renal expression of α-SMA and CD68, a macrophage marker, while these changes were inhibited by LEF treatment. These results suggest that LEF protects kidney in diabetic rats might be also through its inhibition of TEMT and the accumulation of macrophage.
In summary, leflunomide is an isoxazole immunomodulatory agent which inhibits dihydroorotate dehydrogenase and has antiproliferative activity. The findings from this study suggest that leflunomide protects the kidney injury of diabetic rats might through its inhibition of OPN/TGF-β1 mediated extracellular matrix deposition and tubulointerstitial fibrosis, as well as its inhibition on tubular epithelial-myofibroblast transdifferentiation.
Declaration of interest
The authors report no conflicts of interest. The authors alone are responsible for the content and writing of the article.
References
- Chan GC, Tang SC. Diabetic nephropathy: Landmark clinical trials and tribulations. Nephrol Dial Transplant. 2015. [Epub ahead of print]. doi:10.1093/ndt/gfu411
- Donate-Correa J, Martín-Núñez E, Muros-de-Fuentes M, et al. Inflammatory cytokines in diabetic nephropathy. J Diabetes Res. 2015;2015:948417
- Maezawa Y, Takemoto M, Yokote K. Cell biology of diabetic nephropathy: Roles of endothelial cells, tubulointerstitial cells and podocytes. J Diabetes Investig. 2015;6:3–15
- Currie G, McKay G, Delles C. Biomarkers in diabetic nephropathy: Present and future. World J Diabetes. 2014;5:763–776
- Ahmad J. Management of diabetic nephropathy: Recent progress and future perspective. Diabetes Metab Syndr. 2015. [Epub ahead of print]. doi: 10.1016/j.dsx.2015.02.008
- Lloyd A, Komenda P. Optimizing care for Canadians with diabetic nephropathy in 2015. Can J Diabetes. 2015;39:221–8
- Jin H, Piao SG, Jin JZ, et al. Synergistic effects of leflunomide and benazepril in streptozotocin-induced diabetic nephropathy. Nephron Exp Nephrol. 2014;126:148–156
- Russo PA, Wiese MD, Smith MD, et al. Leflunomide for inflammatory arthritis in end-stage renal disease on peritoneal dialysis: A pharmacokinetic and pharmacogenetic study. Ann Pharmacother. 2013;47:e15
- Chon WJ, Josephson MA. Leflunomide in renal transplantation. Expert Rev Clin Immunol. 2011;7:273–281
- Wang J, Liu H, Li N, et al. The protective effect of fucoidan in rats with streptozotocin-induced diabetic nephropathy. Mar Drugs. 2014;12:3292–3306
- Tonolo G, Cherchi S. Tubulointerstitial disease in diabetic nephropathy. Int J Nephrol Renovasc Dis. 2014;7:107–115
- Nosadini R, Tonolo G. Role of oxidized low density lipoproteins and free fatty acids in the pathogenesis of glomerulopathy and tubulointerstitial lesions in type 2 diabetes. Nutr Metab Cardiovasc Dis. 2011;21:79–85
- Nielsen SE, Sugaya T, Tarnow L, et al. Tubular and glomerular injury in diabetes and the impact of ACE inhibition. Diabetes Care. 2009;32:1684–1688
- Peng T, Wang J, Zhen J, et al. Effect of benazepril on the transdifferentiation of renal tubular epithelial cells from diabetic rats. Biomed Rep. 2014;2:490–494
- Duan SB, Liu GL, Wang YH, Zhang JJ. Epithelial-to-mesenchymal transdifferentiation of renal tubular epithelial cell mediated by oxidative stress and intervention effect of probucol in diabetic nephropathy rats. Ren Fail. 2012;34:1244–1251
- Awad AS, Kinsey GR, Khutsishvili K, et al. Monocyte/macrophage chemokine receptor CCR2 mediates diabetic renal injury. Am J Physiol Renal Physiol. 2011;301:F1358–F1366
- Nicholas SB, Liu J, Kim J, et al. Critical role for osteopontin in diabetic nephropathy. Kidney Int. 2010;77:588–600
- Yamaguchi H, Igarashi M, Hirata A, et al. Progression of diabetic nephropathy enhances the plasma osteopontin level in type 2 diabetic patients. Endocr J. 2004;51:499–504
- Persy VP, Verhulst A, Ysebaert DK, et al. Reduced postischemic macrophage infiltration and interstitial fibrosis in osteopontin knockout mice. Kidney Int. 2003;63:543–553
- Yano R, Golbar HM, Izawa T, et al. Participation of bone morphogenetic protein (BMP)-6 and osteopontin in cisplatin (CDDP)-induced rat renal fibrosis. Exp Toxicol Pathol. 2015;67:99–107
- Kashiwagi E, Tonomura Y, Kondo C, et al. Involvement of neutrophil gelatinase-associated lipocalin and osteopontin in renal tubular regeneration and interstitial fibrosis after cisplatin-induced renal failure. Exp Toxicol Pathol. 2014;66:301–311
- Irita J, Okura T, Jotoku M, et al. Osteopontin deficiency protects against aldosterone-induced inflammation, oxidative stress, and interstitial fibrosis in the kidney. Am J Physiol Renal Physiol. 2011;301:F833–F844
- Lan HY. Transforming growth factor-β/Smad signalling in diabetic nephropathy. Clin Exp Pharmacol Physiol. 2012;39:731–738
- Li L, Yin Q, Tang X, et al. C3a receptor antagonist ameliorates inflammatory and fibrotic signals in type 2 diabetic nephropathy by suppressing the activation of TGF-β/smad3 and IKBα pathway. PLoS One. 2014;9:e113639
- Shaker OG, Sadik NA. Transforming growth factor beta 1 and monocyte chemoattractant protein-1 as prognostic markers of diabetic nephropathy. Hum Exp Toxicol. 2013;32:1089–1096
- Wang JY, Gao YB, Zhang N, et al. miR-21 overexpression enhances TGF-β1-induced epithelial-to-mesenchymal transition by target smad7 and aggravates renal damage in diabetic nephropathy. Mol Cell Endocrinol. 2014;392:163–172
- Ina K, Kitamura H, Tatsukawa S, Fujikura Y. Significance of α-SMA in myofibroblasts emerging in renal tubulointerstitial fibrosis. Histol Histopathol. 2011;26:855–866
- Badid C, Desmouliere A, Babici D, et al. Interstitial expression of alpha-SMA: An early marker of chronic renal allograft dysfunction. Nephrol Dial Transplant. 2002;17:1993–1998
- Sawashima K, Mizuno S, Mizuno-Horikawa Y, et al. Expression of alpha-smooth muscle actin and fibronectin in tubulointerstitial lesions of cats with chronic renal failure. Am J Vet Res. 2000;61:1080–1086