
Abstract
Diabetic nephropathy (DN) is one of the most common chronic complications of diabetes, which is associated with an increased oxidative stress induced by hyperglycemia and alterations in DJ-1/NF-E2-related factor-2 (Nrf2) pathway. In the present study, we investigated the role and the proper time nodes of DJ-1/Nrf2 pathway in the pathogenesis of DN. Diabetes mellitus (DM) model of rats was induced by intraperitoneal injection of streptozotocin (STZ) on male Sprague–Dawley (SD) rats. Then, the diabetic rats were divided into 4, 8 and 12 weeks groups. As early at 4 weeks of diabetes, renal histologic evaluation score, cystatin C (Cys C), β2-microglobulin (β2-MG) and malondialdehyde (MDA) levels were increased, and total antioxidative capacity (T-AOC) level was decreased as compared with that in the control group. The protein expressions of DJ-1, NF-E2-related factor-2 (Nrf2) and heme oxygenase-1 (HO-1) were upregulated compared with the control group from 4 weeks and further increased with the progression of DM. The protein expressions of DJ-1, Nrf2 and HO-1 in renal tissues have good line correlations with renal histologic evaluation score, respectively. Taken together, these results suggested that the activation of DJ-1/Nrf2 pathway was involved in the pathogenesis of diabetic nephropathy in rats.
Introduction
Diabetes mellitus (DM) has become a worldwide epidemic disease affecting both developing and developed countries. Among the diabetic complications, diabetic nephropathy (DN), which is characterized by glomerular hypertrophy, basement membrane thickening, mesangial dilation and glomerular sclerosis and interstitial fibrosis in the terminal stage, is the major cause of morbidity and mortality in patients with diabetes.Citation1,Citation2 Although various research efforts over the past decades on DN, the mechanism is still obscure and pharmacologic therapies remain ineffective and controversial.
Recent researchers have found that many mediators involved in the pathogens of DN. Among them, oxidative stress is central to the development of DN, consisting of severe alterations observed in subcellular renal structures associated with a significant functional failure.Citation3,Citation4 Currently, evidence is emerging that DJ-1 is a multifunctional protein that has potent antioxidant properties and protects kidney against oxidative stress-induced cell injury.Citation5,Citation6 Interestingly, the content of DJ-1 in glomerular mesangial cells induced by high glucose is relative to time nodes.Citation7
Studies demonstrated that DJ-1 protein is required for the stabilization of NF-E2-related factor-2 (Nrf2) and subsequent production of Nrf2-regulated enzymes.Citation8,Citation9 The increase of DJ-1 can inhibit oxidative stress and protect the aging vasculature.Citation10 And Nrf2 plays a central role in the protective effect against oxidative and apoptosis damage in DN.Citation11,Citation12 Hence, it was of interest to investigate the role and the proper time nodes of DJ-1/Nrf2 pathway in the pathogenesis of DN in rats.
Materials and methods
Materials
Male Sprague–Dawley (SD) rats weighing 250–300 g were purchased from Wuhan University (Wuhan, China). The experimental protocol used in this study was reviewed and approved by the Animal Care and Use Committee of Wuhan University and in accordance with the Guide for the Care and Use of Laboratory Animals by the National Institutes of Health (NIH Publication No. 80-23). Streptozotocin (STZ) was purchased from Sigma (St Louis, MO). Antibody for DJ-1 was purchased from Cell Signaling Technology (No. 5933, Beverly, MA). Antibody for Nrf2 and HO-1 were purchased from Santa Cruz Biotechnology, Inc. (No. sc-722 and sc-10789, Santa Cruz, CA). All other chemicals were obtained from commercial sources and were of the highest grade available.
Induction of diabetes
Experimental diabetes was induced in the animals by a single intraperitoneal administration of STZ dissolved in 0.1 mol/L citrate buffer (pH 4.5) at a dose of 65 mg/kg. Normal rats received an equal volume of citrate buffer. Three days post-STZ injection, tail vein blood glucose samples were collected and measured with OneTouch glucometer (Johnson & Johnson, NJ). The rats were considered diabetic and used for the study only if their glucose levels were greater than 15 mmol/L.Citation13
Experimental protocol
Rats were randomly assigned into one of four experimental groups (n = 8 per group) as follows: (1) control, vehicle-treated STZ-diabetic rats (sham group); (2) 4DM group that killed after 4 weeks of STZ induction; (3) 8DM group that killed after 8 weeks of STZ induction; (4) 12DM group that killed after 12 weeks of STZ induction.
Renal histopathological assessment
The left kidney was cut into sections and fixed in 4% formaldehyde. After embedding in paraffin, 4-μm sections were stained with hematoxylin and eosin for light microscopy (original magnification ×200, Olympus BX50; Olympus Optical, Tokyo, Japan).
Histologic assessment of tubular necrosis was determined semiquantitatively using a method modified from McWhinnie et al.Citation14 Scores were as follows: 0 = normal histology; 1 = tubular cell swelling, brush border loss, nuclear condensation, with up to one-third of the tubular profile showing nuclear loss; 2 = same as for score 1, but greater than one-third and less than two-thirds of the tubular profile showing nuclear loss; and 3 = greater than two-thirds of the tubular profile showing nuclear loss.
Measurement of serum cys C and β2-MG levels
Blood samples were collected at the end of reperfusion and centrifuged at 3000 rpm, for 10 min at 4 °C. Serum was separated and stored at −20 °C. Cys C and β2-MG are two important indexes and play an important role in renal functional injury. Cys C and β2-MG levels were measured using enzyme-linked immunosorbent assay (ELISA) kits (Elabscience Biotechnology Co., Ltd, Wuhan, China) according to the manufacturer’s instructions.
Renal tissues T-AOC and MDA assays
The renal tissues were harvested and immediately homogenized on ice in 5 volumes of normal saline. The homogenates were centrifuged at 1200 g for 10 min. The T-AOC and MDA levels were measured using total antioxidant capacity and malonaldehyde (T-AOC and MDA) assay kits (Nanjing Jiancheng Bioengineering Institute, Nanjing, China) according to the manufacturer’s instructions.
Renal DJ-1 and Nrf2 immunohistochemical assays
Paraffin-embedded renal sections were stained using the streptavidin–biotin complex (SP × 400) immunohistochemistry technique for DJ-1, Nrf2 and HO-1 detection. Brown staining in the cytoplasm and/or nucleus was considered an indicator of positive expression. Results were evaluated semiquantitatively with Image-Pro® plus version 6.0 software according to optical density values of positive expression.
Western blot analysis
Cytoplasmic and nuclear proteins were extracted from frozen renal tissues with a nuclear extraction kit (Beyotime Institute of Biotechnology, Jiangsu, China) according to the manufacturer's instructions. An equal amount of protein was loaded onto 12% SDS-PAGE at 100 V for 3 h. After electrophoresis, proteins were transferred onto polyvinylidene difluoride (PVDF) membranes at 200 mA for 2 h. The transferred membranes were incubated overnight at 4 °C with rabbit anti-mouse polyclonal antibodies for DJ-1, Nrf2 and HO-1 (each at 1:800 dilution) in Tris phosphate-buffered saline (TBS-T) containing 5% skim milk. After washing three times in TBS-T, membranes were incubated with anti-rabbit IgG conjugated to horseradish peroxidase at a dilution of 1:2000 in TBS-T containing 5% skim milk for 2 h at room temperature. The immunoreactive bands were visualized with enhanced chemiluminescence (ECL) and captured on X-ray film. Optical density of the bands was measured with BandScan imaging analysis system.
Statistical analysis
All analysis was performed using SPSS 17.0 (Chicago, IL). Mean ± SEM values were calculated to summarize all outcome measurements. One-way analysis of variance (ANOVA) and the Duncan’s multiple range method were used to compare significant differences among the groups. The level of significance was set at p < 0.05 for all statistical tests. Pearson correlation analysis and linear regression analysis were used to analyze the correlation.
Results
Body weight, kidney weight, fasting blood glucose and glycosylated hemoglobin content
At the end of the study, the body weight in 4 weeks diabetic rats were significantly decreased as compared to the normal rats and further decreased with the progression of DM. The change of kidney weight was not obvious in diabetic rats during the experimental period. The ratio of kidney weight to body weight in diabetic rats was significantly increased as compared to those in the normal rats. A significant increase in fasting blood glucose in diabetic rats was observed when compared to the control group. The value of HbA1c was markedly higher in diabetic rats than that in normal rats ().
Table 1. Effects of different time on body weight, kidney weight, fasting blood glucose and HbA1c levels in rats.
Renal histopathological assessment
In , histological examination of the kidneys through light microscope showed that glomerular hypertrophy and expansion of the mesangial area were induced by STZ. The renal tubule shows pathological changes, including edema, necrosis and vacuolization in 4DM group, and the pathological changes were much worse in 8DM and 12DM group than that in 4DM group.
Figure 1. Renal histologic evaluation in the various treatment groups (HE ×200). Values (mean ± SD) were obtained for each group of 8 animals. ap < 0.05 compared to the values of normal rats (sham). bp, cp < 0.05 compared to the values of diabetic rats after 4 weeks and 8 weeks (4DM, 8DM), respectively.
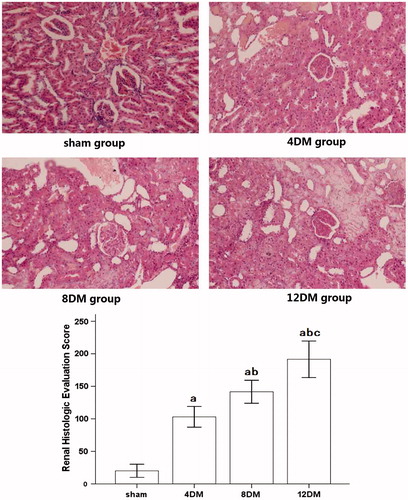
When compared with the renal histologic evaluation score measured from kidneys obtained from normal rats, 4DM group resulted in a significant increase in renal histologic evaluation score (p < 0.05). This increase was significantly aggrandized in 8DM and 12DM group (p < 0.05).
Serum cys C and β2-MG levels assessment
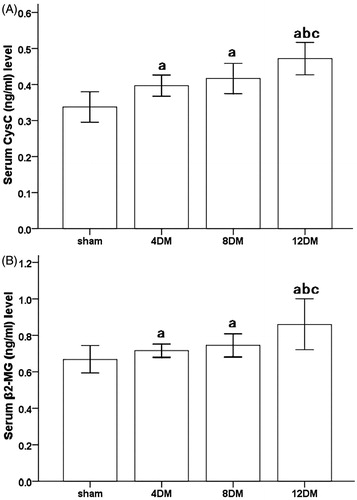
During the 4 and 8 weeks experimental period, diabetic rats showed increased levels of serum Cys C (ng/mL) and β2-MG (ng/mL) as compared to the normal rats (p < 0.05). In addition, the levels of Cys C and β2-MG in 12DM group were obviously higher than those in 4DM group (p < 0.05). But there was no significant difference of Cys C and β2-MG levels between 4DM and 8DM group. (p > 0.05) ().
Figure 2. Serum Cys C (A) and β2-MG (B) levels in the different treatment groups. Values (mean ± SD) were obtained for each group of eight animals. ap < 0.05 compared to the values of normal rats (sham). bp, cp < 0.05 compared to the values of diabetic rats after 4 weeks and 8 weeks (4DM, 8DM), respectively.
T-AOC and MDA levels in renal tissues
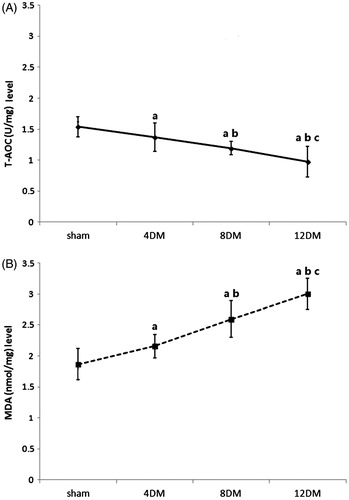
In 4DM group, the level of MDA (nmol/mg) was higher, and the level of T-AOC (U/mg) was lower than those in sham group (p < 0.05) (). In addition, the level of MDA was increased and the level of T-AOC was decreased with the progression of DM (p < 0.05) ().
Figure 3. Renal tissues T-AOC (A) and MDA (B) levels in the different treatment groups. Values (mean ± SD) were obtained for each group of eight animals. ap < 0.05 compared to the values of normal rats (sham). bp, cp < 0.05 compared to the values of diabetic rats after 4 weeks and 8 weeks (4DM, 8DM), respectively.
Correlation analysis between T-AOC and MDA levels with renal histologic evaluation score
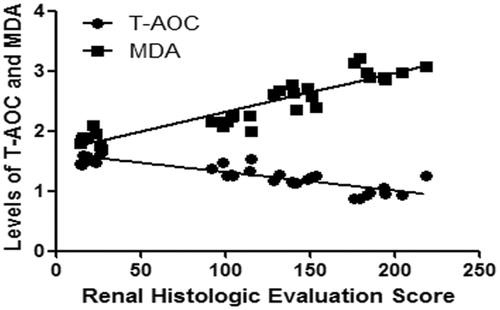
The levels of T-AOC and MDA in renal tissues had good line correlations with renal histologic evaluation score, respectively (p < 0.01) (). The R2 value between T-AOC level with renal histologic evaluation score was 0.7394. The R2 value between MDA level with renal histologic evaluation score was 0.8435.
Figure 4. Correlation analysis between T-AOC and MDA levels with renal histologic evaluation score.
DJ-1, Nrf2 and HO-1 proteins expression in renal tissues by immunohistochemical analysis
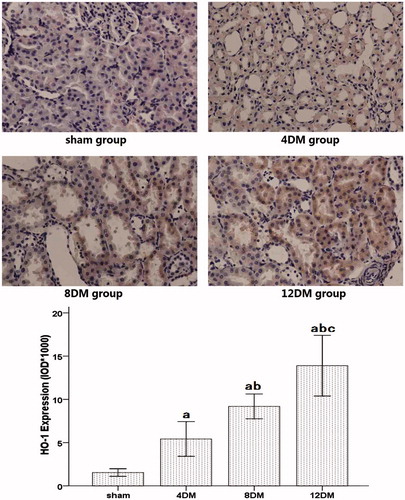
Analysis of the expression of DJ-1 and HO-1 in the sham group showed sparse brown immunostaining in the cytoplasm while there was significant, positive expression of DJ-1 and HO-1, as indicated by dense brown staining in the cytoplasm in the DM groups (). Compared with the sham group, the positive staining for DJ-1 and HO-1 proteins expression increased significantly in the 4DM group (p < 0.01). And the positive staining for DJ-1 and HO-1 proteins expression was much higher in the 8 and 12DM group than those in the 4DM group (p < 0.01) ( and ).
Figure 5. Expression of DJ-1 in renal tissues assessed by immunohistochemistry (SP ×400). Values (mean ± SD) were obtained for each group of eight animals. ap < 0.05 compared to the values of normal rats (sham). bp, cp < 0.05 compared to the values of diabetic rats after 4 weeks and 8 weeks (4DM, 8DM), respectively.
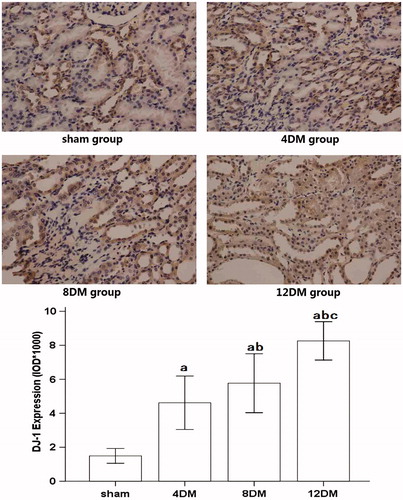
Figure 6. Expression of HO-1 in renal tissues assessed by immunohistochemistry (SP ×400). Values (mean ± SD) were obtained for each group of eight animals. ap < 0.05 compared to the values of normal rats (sham). bp, cp < 0.05 compared to the values of diabetic rats after 4 weeks and 8 weeks (4DM, 8DM), respectively.
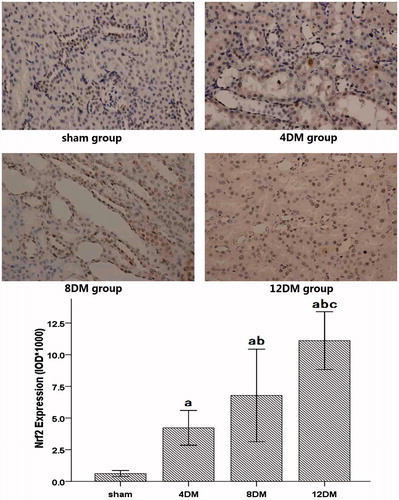
The expression of Nrf2 in the sham group showed light brown immunostaining in the cytoplasm and no staining in the nucleus. The significantly positive expression of Nrf2, as indicated by strong brown staining in the cytoplasm and nucleus was observed in the DM groups. Compared with the sham group, the positive staining for Nrf2 protein expression increased significantly in the 4DM group (p < 0.01). It is much higher in the 8 and 12DM group than those in the 4DM group (p < 0.01) ().
Figure 7. Expression of Nrf2 in renal tissues assessed by immunohistochemistry (SP ×400). Values (mean ± SD) were obtained for each group of eight animals. ap < 0.05 compared to the values of normal rats (sham). bp, cp < 0.05 compared to the values of diabetic rats after 4 weeks and 8 weeks (4DM, 8DM), respectively.
DJ-1, Nrf2 and HO-1 proteins expression in renal tissues by western blot analysis
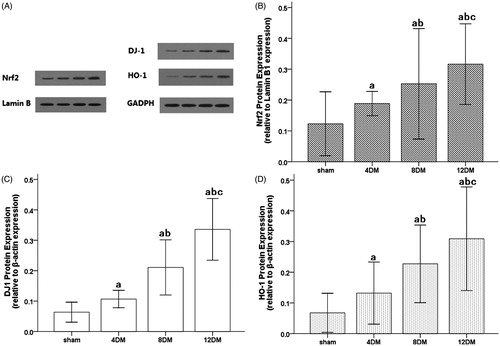
Western blot analysis showed that the protein expressions of DJ-1, Nrf2 and HO-1 were weak in the kidneys of the sham group. In contrast, significant increases in protein expressions for DJ-1, Nrf2 and HO-1 were found in the 4DM group (p < 0.01) and increased with the progression of DM (p < 0.01) ().
Figure 8. Expressions of DJ-1, Nrf2 and HO-1 in renal tissues as assessed by Western blot. A, Western blot analysis for the presence of DJ-1 and HO-1 in cytoplasmic proteins and Nrf2 in nuclear proteins. β-actin and Lamin B1 were used as the protein loading controls for DJ-1, HO-1 and Nrf2, respectively. B, C, D, DJ-1, HO-1 and Nrf2 protein contents were detected by densitometry. Values (mean ± SD) were obtained for each group of eight animals. ap < 0.05 compared to the values of normal rats (sham). bp, cp < 0.05 compared to the values of diabetic rats after 4 weeks and 8 weeks (4DM, 8DM), respectively.
Correlation analysis between DJ-1, Nrf2 and HO-1 expression with renal histologic evaluation score
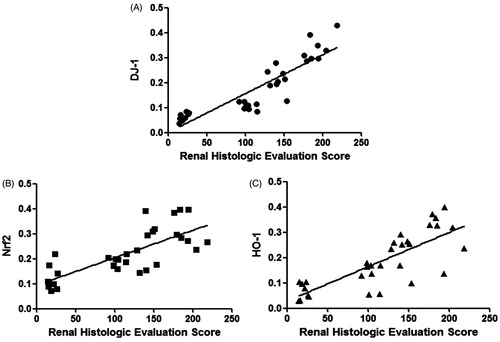
Expressions of DJ-1, Nrf2 and HO-1 in renal tissues had good line correlations with renal histologic evaluation score respectively (all p < 0.01) (). The R2 value between expressions of DJ-1 with renal histologic evaluation score was 0.7957. The R2 value between expressions of Nrf2 with renal histologic evaluation score was 0.5664. The R2 value between Expressions of HO-1 with renal histologic evaluation score was 0.6309.
Figure 9. Correlation analysis between DJ-1 (A), Nrf2 (B) and HO-1 (C) expression with renal histologic evaluation score.
Discussion
Diabetic nephropathy (DN) is a significant cause of chronic kidney disease and end-stage renal failure globally. Patients with diabetes and chronic kidney disease (CKD) have an increased risk of all-cause mortality, cardiovascular mortality and kidney failure. DN is characterized by glomerular enlargement, early albuminuria and progressive glomerulosclerosis.Citation1,Citation2,Citation15 It was reported that the increased levels of Cys C and β2-MG in diabetes may be early indicators of incipient DN. Even minimal glomerular damage will result in a significant increase in serum Cys C and β2-MG levels, causing disease progression.Citation16 Some papers indicated that the great majority of diabetic patients had a significant increase in serum Cys C and β2-MG. The serum levels of both Cys C and β2-MG increased significantly in early stage of DN. This suggests that Cys C and β2-MG may contribute synergistically to the occurrence and progression of DN in patients with diabetes.Citation17,Citation18 In the present study, the increase in Cys C and β2-MG levels induced by hyperglycemia was more pronounced in 4 weeks following the induction of diabetes. In addition, the kidneys in diabetic rats in 4 weeks showed glomerular hypertrophy and renal tubular edema by light microscope, and the renal histologic evaluation score was increased too. All these results demonstrated that the diabetic renal injury model presenting renal hypertrophy, renal tubular and glomerular damage was successfully created following 4 weeks induction of diabetes and became worse and worse with the progress of DM.
Oxidative stress is becoming increasingly recognized as an important causative factor of DN. Hyperglycemia-induced DN pathogenic mechanisms require intermediate oxidative steps that involve specific phospholipid and glycolipid species.Citation3 Recent studies have shown that excessive production of reactive oxygen species (ROS) is an important mechanism underlying the pathogenesis of diabetes-associated macrovascular and microvascular complications including diabetic nephropathy. The decrease in antioxidant capacity and increase in oxidative stress product break down the dynamic balance between antioxidation and oxidation in vivo.Citation19,Citation20 T-AOC is an important marker of oxidation, which mainly reflects nonenzymatic but includes the activity of a minority of small molecular enzymatic systems. MDA is a naturally occurring product of lipid peroxidation and prostaglandin biosynthesis that is mutagenic and carcinogenic. Some papers indicated that the significant increase in MDA levels and decrease in T-AOC levels in early stage of nephropathy in patients with T2D.Citation21,Citation22 Our results also demonstrated that increase in MDA levels and decrease in T-AOC levels in the renal tissues from 4 weeks DM. The levels of T-AOC and MDA in renal tissues have good line correlations with renal histologic evaluation score, respectively. These findings show that a decreased antioxidant activity already exists in diabetes at an early stage of DN and that antioxidant capacity weakens in parallel with the severity of kidney in diabetic rats.
The pathogenesis of diabetic nephropathy is multifactorial and the precise mechanisms are unclear. Hyperglycemia-mediated dysregulation of various pathways either enhances the intensity of oxidative stress or these pathways are affected by oxidative stress. Thus, oxidative stress has been considered as a central mediator in progression of nephropathy in patients with diabetes.Citation23 Activation of DJ-1/Nrf2 has been established to play an important endogenous protective role in oxidative stress.Citation9 Disruption of DJ-1 decreased Nrf2 protein stability, whereas over expression of DJ-1 restored protein stability by decreasing ubiquitination of Nrf2. DJ-1 protein is required for the stabilization of Nrf2 and cell survival by a variety of substrates, including phase-2 enzymes such as HO-1.Citation8,Citation9,Citation24 HO-1 is considered a stress protein and is thus regarded as a sensitive and reliable indicator of cellular oxidative stress.Citation25 Some researches demonstrated that both DJ-1 and Nrf2 were endogenous protective proteins.Citation26 And oxidative stress would activate DJ-1 in the early time of DM, and then induce the downstream antioxidative proteins, that played a role of endogenous antioxidative function. In fact, some studies have shown that with the ascending of blood glucose, the content of DJ-1 was increased to inhibit the expression of ROS.Citation27,Citation28. In addition, the renal protective effects in diabetic rats might be enhanced by the activation of Nrf2.Citation29,Citation30 However, there is little evidence for the association with DN and DJ-1/Nrf2 pathway. Our results showed that there was significant increase in expression of DJ-1, Nrf2 and HO-1 following the 4 weeks induction of diabetes. And the longer time of diabetes mellitus, the higher expressions of DJ-1, Nrf2 and HO-1 were showed. What is more, to gain insight into the potential mechanisms responsible for renal damage in diabetic, we further evaluated the role of DJ-1/Nrf2 signaling pathway in the progression of DN, we found that expressions of DJ-1, Nrf2 and HO-1 in renal tissues have good line correlations with renal histologic evaluation score, respectively. All the above-mentioned data showed that high glucose led to oxidative stress injury and start endogenous protective mechanism, which caused a compensatory increase expression of DJ-1 protein in the early stage. However, DJ-1 could not maintain the compensation all the way. DJ-1 might exhaust in a later time, leading to more severe cell injury and oxidative stress. All the above-mentioned data were indicated that DJ-1/Nrf2-signaling pathway played an important role in the progression of DN.
In conclusion, this study indicated that hyperglycemia induced renal dysfunction was exacerbated in the progression of diabetes, which was involved in DJ-1/Nrf2-signaling pathway. This might provide a novel therapeutic strategy for the treatment of diabetic nephropathy.
Declaration of interest
The authors declare that they have no competing interests. This work was supported by the National Natural Science Foundation of China (NO. 81501648 and 81471844).
References
- Tzeng TF, Liou SS, Chang CJ, Liu IM. The ethanol extract of zingiber zerumbet attenuates streptozotocin-induced diabetic nephropathy in rats. Evid Based Complement Alternat Med. 2013;2013:340645.
- Kawachi H, Miyauchi N, Suzuki K, et al. Role of podocyte slit diaphragm as a filtration barrier. Nephrology (Carlton). 2006;11:274–281.
- Wang L, Wu CG, Fang CQ, et al. The protective effect of α-lipoic acid on mitochondria in the kidney of diabetic rats. Int J Clin Exp Med. 2013;6:90–97.
- Brownlee M. Biochemistry and molecular cell biology of diabetic complications. Nature. 2001;414:813–820.
- Cuevas S, Zhang Y, Yang Y, et al. Role of renal DJ-1 in the pathogenesis of hypertension associated with increased reactive oxygen species production. Hypertension. 2012;59:446–452.
- Sitaram RT, Cairney CJ, Grabowski P, et al. The PTEN regulator DJ-1 is associated with hTERT expression in clear cell renal cell carcinoma. Int J Cancer. 2009;125:783–790.
- Das F, Dey N, Venkatesan B, et al. High glucose upregulation of early-onset Parkinson's disease protein DJ-1 integrates the PRAS40/TORC1 axis to mesangial cell hypertrophy. Cell Signal. 2011;23:1311–1319.
- Gan L, Johnson DA, Johnson JA. Keap1-Nrf2 activation in the presence and absence of DJ-1. Eur J Neurosci. 2010;31:967–977.
- Clements CM, McNally RS, Conti BJ, et al. DJ-1, a cancer- and Parkinson's disease-associated protein, stabilizes the antioxidant transcriptional master regulator Nrf2. Proc Natl Acad Sci USA. 2006;103:15091–15096.
- Collins AR, Lyon CJ, Xia X, et al. Age-accelerated atherosclerosis correlates with failure to upregulate antioxidant genes. Circ Res. 2009. DOI: 10.1161/CIRCRESAHA.108.188771.
- Li B, Liu S, Miao L, Cai L. Prevention of diabetic complications by activation of Nrf2: Diabetic cardiomyopathy and nephropathy. Exp Diabetes Res. 2012;2012:216512.
- Cui W, Bai Y, Miao X, et al. Prevention of diabetic nephropathy by sulforaphane: Possible role of Nrf2 upregulation and activation. Oxid Med Cell Longev. 2012;2012:821936.
- Xia Z, Kuo KH, Nagareddy PR, et al. Nacetylcysteine attenuates PKCbeta2 overexpression and myocardial hypertrophy in streptozotocin-induced diabetic rats. Cardiovasc Res. 2007;73:770–782.
- McWhinnie DL, Thompson JF, Taylor HM, et al. Morphometric analysis of cellular infiltration assessed by monoclonal antibody labelling in sequential human renal allograft biopsies. Transplantation. 1986;42:352–358.
- Martínez-Castelao A, Navarro-González JF, Górriz JL, de Alvaro F. The concept and the epidemiology of diabetic nephropathy have changed in recent years. J Clin Med. 2015;4:1207–1216.
- Dabla PK. Renal function in diabetic nephropathy. World J Diabetes. 2010;1:48–56.
- Wang T, Wang Q, Wang Z, et al. Diagnostic value of the combined measurement of serum hcy, serum cys C, and urinary microalbumin in type 2 diabetes mellitus with early complicating diabetic nephropathy. ISRN Endocrinol. 2013;2013:407452.
- Wang J, Liu H, Li N, et al. The protective effect of fucoidan in rats with streptozotocin-induced diabetic nephropathy. Mar Drugs. 2014;12:3292–3306.
- Di Marco E, Jha JC, Sharma A, et al. Are reactive oxygen species still the basis for diabetic complications? Clin Sci (Lond). 2015;129:199–216.
- Pérez-Gallardo RV, Noriega-Cisneros R, Esquivel-Gutiérrez E, et al. Effects of diabetes on oxidative and nitrosative stress in kidney mitochondria from aged rats. J Bioenerg Biomembr. 2014;46:511–518.
- Shao N, Kuang HY, Wang N, et al. Relationship between oxidant/antioxidant markers and severity of microalbuminuria in the early stage of nephropathy in type 2 diabetic patients. J Diabetes Res. 2013;2013:232404.
- Bondor CI, Potra AR, Moldovan D, et al. Relationship of adiponectin to markers of oxidative stress in type 2 diabetic patients: Influence of incipient diabetes-associated kidney disease. Int Urol Nephrol. 2015;47:1173–1180.
- Pal PB, Sinha K, Sil PC. Mangiferin attenuates diabetic nephropathy by inhibiting oxidative stress mediated signaling cascade, TNFα related and mitochondrial dependent apoptotic pathways in streptozotocin-induced diabetic rats. PLoS One. 2014;9:e107220.
- Cuevas S, Villar VA, Jose PA, Armando I. Renal dopamine receptors, oxidative stress, and hypertension. Int J Mol Sci. 2013;14:17553–17572.
- Zarjou A, Agarwal A. Heme oxygenase-1 as a target for TGF-β in kidney disease. Semin Nephrol. 2012;32:277–286.
- Park Y, Kim H, Park L, et al. Effective delivery of endogenous antioxidants ameliorates diabetic nephropathy. PLoS One. 2015;10:e0130815.
- Chaudhari HN, Kim SW, Yun JW. Gender-dimorphic regulation of DJ1 and its interactions with metabolic proteins in streptozotocin-induced diabetic rats. J Cell Mol Med. 2015;19:996–1009.
- Jain D, Jain R, Eberhard D, et al. Age- and diet-dependent requirement of DJ-1 for glucose homeostasis in mice with implications for human type 2 diabetes. J Mol Cell Biol. 2012;4:221–230.
- Uruno A, Furusawa Y, Yagishita Y, et al. The Keap1-Nrf2 system prevents onset of diabetes mellitus. Mol Cell Biol. 2013;33:2996–3010.
- Abdo S, Zhang SL, Chan JS. Reactive oxygen species and nuclear factor erythroid 2-related factor 2 activation in diabetic nephropathy: A hidden target. J Diabetes Metab. 2015;6:10. 4172/2155-6156.1000547.