
Abstract
Background There is a paucity of literature available as to the relationship between different levels of each metabolic syndrome (MetS) component and decreased GFR. In the present study, we aimed to demonstrate whether MetS always plays a critical role in decreased GFR. Methods A cross-sectional study was conducted between February 2010 and September 2012, with 75,468 adults enrolled undergoing measurements of blood pressure as well as tests of blood and urine samples. Univariate and multivariable logistic regression analyses were performed to estimate the odds ratio (OR) with 95% confidence intervals (CI), and the chi-square test was used for categorical variables and described as a percentage. Results Of the 75,468 participants, 350 (0.5%) subjects met criteria for the decreased GFR, with a mean age of 48.79 ± 13.76 years. After adjustment for age, diastolic blood pressure and high-density lipoprotein were inversely related to decreased estimated glomerular filtration rate (eGFR) in multivariable analyses, with an OR (95% CI) of 0.57 (0.39–0.84) and 0.41 (0.24–0.72), respectively. The prevalence rate of CKD in critical group was 0.73% (154 of 21,127) and 0% (0 of 370) in noncritical group. In analysis stratified by the type of MetS components, the differences in noncritical group and the reference group were not statistically significant (χ2 = 1.349, p > 0.05). Conclusions MetS does not always play a critical role in decreased GFR, with different levels of individual components of MetS exerting idiosyncratic effects in decreased eGFR. In fact, patients with abnormal body mass index, high triglycerides, and elevated fasting plasma glucose would not have impact on decreased GFR.
Introduction
In the past decade, the prevalence of chronic kidney disease (CKD) has been increased. Despite the advances in the therapeutics, it remains a leading public health challenge worldwide.Citation1,Citation2 According to a recent statistics, there are approximately 26.3 million people inflicted with CKD in the United States.Citation3 Moreover, a national survey on CKD conducted by Zhang et al. in 2012 revealed the overall prevalence of CKD is 10.8% in China.Citation4 Therefore, it is vital to better understand the pathogenesis of CKD so as to formulate prophylactic strategies.Citation5
Metabolic syndrome (MetS), characterized by hypertriglyceridemia, abdominal obesity, depressed serum high-density lipoprotein cholesterol (HDL-C), diabetes mellitus, and hypertension, is commonly found in CKD sufferers.Citation6,Citation7 Substantial evidence confirmed that MetS and its contributors play a critical role in the progression of CKD.Citation6,Citation8–10 Most reports recognized an independent association between MetS and CKD.Citation11,Citation12 However, controversies still remain regarding the relationship between decreased estimated glomerular filtration rate (eGFR < 60 mL/min/1.732) and individual factors in MetS. Some researchers reported that obesity indicated by elevated body mass index (BMI) which can induce renal injuryCitation13 is an independent culprit in CKD,Citation14,Citation15 while others observed a U-shaped association between weight change categories and development of CKD.Citation16 In addition, few studies have focused on the relationship of CKD with different levels of individual factors in MetS. We speculated that some specific populations and different levels of different factors in MetS may idiosyncratically contribute to CKD, which still requires further explorations. Hence, we undertook this study to delineate the association between different levels of individual components of MetS and decreased GFR.
Subjects and methods
Study design and study population
About 75,468 urban residents scheduled for annual routine check-up were enrolled in Xuzhou Central Hospital between March 2010 and September 2012. The medical records of participants consisted of registration files (code, name, gender, age, address, and date), anthropometric measurements files [height, weight, systolic blood pressure (SBP), and diastolic blood pressure (DBP)], laboratory results (urine and blood samples), and medical history (dialysis or renal transplant, chronic diseases, cardiovascular diseases, and medication). Approval was obtained from the ethics committee of Xuzhou Medical College, with written informed consent provided by patients or their legally authorized representatives.
Exclusion criteria: (1) history of renal transplant or dialysis, (2) cardiovascular disease, (3) loss of related data [serum creatinine (SCr) and all parameters related to MetS], (4) undergoing medical treatment for diabetes, hypertension, or hyperlipidemia, and (5) intake of nephrotoxic drugs within the previous seven days.
Study measurements
Sociodemographic characteristics, anthropometric, and laboratory data were obtained from all participants, including age, gender, height, weight, and medical history. Measurements of blood pressure with a random zero sphygmomanometer were conducted in triplicate by professional nurses, 5 min after the participants were seated, with the mean measurement recorded. Blood samples were obtained for determination of lipids, glucose, and SCr after a 12-h overnight fasting. SCr was measured with Jaffe’s kinetic method and fasting plasma glucose (FPG) with a hexokinase enzyme reference method. BMI was calculated by weight (kg)/height (m2). Triglyceride (TG) levels were evaluated with enzymatic assay using commercial reagents. HDL-C was determined by immunoturbidimetry.
Diagnosis of metabolic syndrome
The MetS in our study was defined as the presence of at least three of the following abnormalities according to the Adult Treatment Panel Three Report (ATP III)Citation17: (1) elevated BP: BP > 130/85 mmHg and/or use of antihypertensive medications; (2) obesity: BMI ≥ 25 kg/m2; (3) low HDL cholesterol: HDL-C level < 1.0 mmol/L (40 mg/dL) in males or <1.30 mmol/L (50 mg/dL) in females; (4) hypertriglyceridemia: serum TG level ≥ 1.70 mmol/L (150 mg/dL); (5) hyperglycemia: serum glucose level ≥ 6.11 mmol/L (110 mg/dL) and/or use of insulin or oral hypoglycemic agents. Because of missing data on waist circumference, BMI was used in our definition as it (≥25 kg/m2) was substituted for the waist circumference measurement in accordance with the modified of the ATP III.Citation13
Definition of decreased GFR
The eGFR served as an indicator of renal functionality by the formula developed and validated in the Modification of Diet in Renal Disease study for Chinese patients as followsCitation18: eGFR (mL/min/1.73 m2) = 175 × (serum Cr)−1.234 × (age)−0.179 × 0.79 (if female). Decreased GFR was defined as an eGFR < 60 mL/min/1.73 m2. Serum Cr: serum creatinine (mg/dL), 1 mg/dL = 88.4 μmol/L.
Analytical methods
All statistical analyses were performed using the statistical package SPSS version 18.0. Baseline characteristics were compared between the participants with and without decreased eGFR. Continuous variables were presented as the mean ± SD and compared using a Student’s t-test. The chi-square test was used for categorical variables and described as a percentage. We used univariate logistic regression and multivariable logistic regression to determine the odds ratio (OR) of CKD as a function of MetS. Curve diagrams used for describing the decreased GFR were drawn according to all MetS components (SBP, DBP, TG, HDL-C, FPG, and BMI) and gender. Significance levels of two-tailed test were determined as p < 0.05.
Results
Characteristics of participants at baseline
Among the 118,906 persons, 37,431 participants were excluded because data on SCr levels were not available, 2849 were excluded because of cardiovascular disease, and 2317 were excluded because of the history of renal transplant or dialysis, the other 841 who below 18 years and participants with past history or taking medication were excluded. This exclusion left 75,468 participants that involved in the study, with mean age 48.79 ± 13.76 years and eligibility of 0.5% (350 subjects) for the decreased GFR (eGFR < 60 mL/min per 1.73m2).
The participants with decreased GFR had ages significantly older than those without (p < 0.05). There was no difference in the percentages of subjects with decreased GFR in both genders (p > 0.05). Five individual factors (SBP, DBP, HDL-C, FPG, and BMI) in MetS, except TG, had significant differences between the two groups (p < 0.05) as shown in .
Table 1. Demographic and clinical characteristics of study subjects by the presence of decreased GFR.
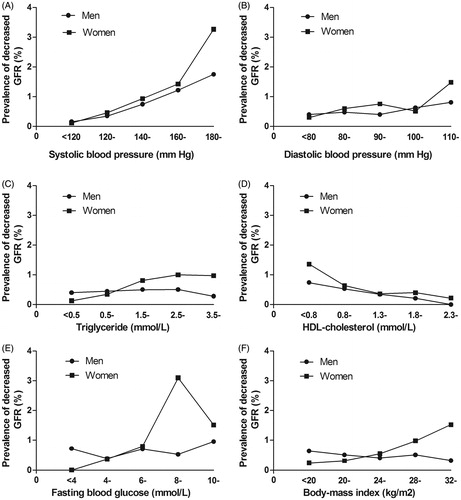
The prevalence of decreased GFR increased with the elevated SBP (), and decreased trends were evident in the HDL-C (). Reversed trends in TG () and BMI () were shown in both gender groups. The relation between DBP, FPG (), and decreased GFR performs unsteadily (). The association of decreased GFR with the quintile of MetS components parameters is linearly dependent (p < 0.01). The Cochran–Armitage trend chi-square test between decreased GFR and SBP, DBP, TG, HDL, FPG, and BMI were 194.611, 15.867, 9.600, 10.589, 62.385, and 13.262, respectively.
Figure 1. Prevalence of decreased GFR by different levels of each MetS component and gender. Decreased GFR was defined as an estimated glomerular filtration rate <60 mL/min per 1.73 m2 according to the Modification of Diet in Renal Disease (MDRD) formula. MetS is defined as having three or more of the following five risk factors including: hypertension, diabetes, depressed serum high-density lipoprotein cholesterol (HDL-C), hypertriglyceridemia, and obesity. GFR, glomerular filtration rate.
Univariate association between decreased GFR and correlative risk factors
In the univariate logistic regression analysis (), neither gender nor FPG was positively associated with decreased GFR (p > 0.05). Conversely, the link between age, SBP, DBP, TG, HDL-C, BMI, and decreased GFR stands out starkly (p < 0.05). In addition, demonstrates a positive correlation in which an escalated elevation of the prevalence of decreased GFR was coupled with the SBP and DBP (p < 0.05).
Table 2. Uni- and multivariable association between decreased GFR and correlative risk factors.
Multivariable association between decreased GFR and correlative risk factors
further displays the results of multivariable analyses of the correlation between decreased GFR and individual risk factors. The same was true of the univariate analysis, in which gender and FPG were not correlated with decreased GFR (p > 0.05), while there was no correlation between TG and decreased GFR (p > 0.05) in multivariable analysis. Herein, the correlation of decreased GFR with DBP and BMI was changed from negative to positive (p < 0.05). What merits careful attention was the U-shaped association of DBP with the pathogenesis of CKD as well as the BMI. The stable risk factors were elevated SBP, decreased HDL-C, and the aging (p < 0.05).
The association between noncritical and critical metabolic syndrome components and decreased GFR
We used the term noncritical group to designate the group of TG, FPG and the group of obesity, BP, and HDL designated critical group. The reference group was the patients without MetS. The prevalence rate of CKD in critical group was 0.73% (154 of 21,127) and 0% (0 of 370) in noncritical group. In analysis stratified by the type of MetS components, the differences between noncritical group and the reference group were not statistically significant (χ2 = 1.349, p > 0.05). However, there did have a significant association between critical group and the group without MetS (χ2 = 43.789, p < 0.000).
Discussion
Inconsistency still remains regarding the interpretation of the association between MetS and CKD, with some studies demonstrating that MetS was an independent risk factor for the development of CKD, regardless of age, gender, and other potential confounders.Citation3,Citation13 Our results support the notion that MetS is not always the independent contributor of decreased GFR. Some of the factors in MetS are irrelevant, even some are protective. For example, MetS patients with elevated FPG, high TG and abnormal BMI would not do harm to renal function.
Our findings were parallel to substantial epidemiological studiesCitation19–21 that older age, elevated SBP, low HDL-C levels were identified as risk factors, and the prevalence of decreased GFR increased with the sustained elevation of SBP but decreased gradually with increasing HDL-C level. No significant difference was identified between gender, FPG, and CKD, although some of the evidence pointed out that the female exerts a positive effect on both hazard of renal failure and decline of GFR.Citation17 Despite Tozawa et al.Citation13 indicated that high TG levels in women predict a decline in renal function, it is noteworthy that the relation in the multivariate analysis between TG and decreased GFR disappeared than that in the univariate analysis, so it did even if in different levels. Therefore, it is possible that there are as-yet unidentified confounders that may influence the relation between TG levels and decreased GFR.
It was well established that hypertension was an independent risk factor for CKD progression.Citation22 As previously described, the link between elevated SBP and decreased GFR stands out starkly. Unfortunately, the relationship between DBP and decreased GFR remains obscure. In the univariate analysis, both SBP and DBP had a strong, graded, and continuous association with the prevalence of decreased GFR. However, relationship between DBP and decreased GFR was attenuated and there was no statistically significant difference compared with SBP in multivariable logistic regression. Multivariable logistic regression revealed that the performance of DBP is very unstable after SBP controlled, which may due to the high correlation between SBP and DBP. Furthermore, the data from the multivariable logistic regression suggested that there has a weak U-shaped association for decreased GFR (with DBP 90–110 mmHg having strong protective effect). Thus, we considered its impact in the decreased eGFR is bidirectional. That means some renal protection by taking the control of DBP to an appropriate level (90 ≤ DBP < 110) can be provided. It was conceivable that the apparent concerted results among the published studiesCitation23,Citation24 and our analysis may disclose the possibility that SBP was a better predictor of CKD progression than DBP to some extent. Obesity is well recognized as a determinant of cardiovascular and many other chronic diseases.Citation14,Citation25 More recently, obesity, as an emerging threat, has also played a major role in the progression of CKD.Citation5,Citation26 Though in multivariable analysis, association of BMI with CKD turned positively on a certain level, as the case in DBP, the deep going research showed male and female have thus opposite effects on the links between BMI and decreased eGFR, which can especially be seen from the chart (). Though we have found obesity is a noncritical factor previously,Citation5 the U-shaped association between BMI and decreased eGFR is also presented in multivariable analysis. This finding is in agreement with the results of Lu et al. that an appropriate BMI is associated with the best clinical outcomes.Citation27
A number of previous studies have addressed the association between the number of MetS components and CKD,Citation3,Citation13 but analysis stratified by the type of components of MetS is seldom reported. An intriguing finding was presented after dividing the components of MetS into noncritical arm (including elevated TG, elevated FPG, and obesity) and critical arm (including elevated BP and reduced HDL-C). There was no statistical difference between noncritical arm and the group that patients without MetS (χ2 = 1.349, p = 0.246), while a significant difference existed between critical arm and normal participants (χ2 = 43.789, p < 0.000). This indicated that patients with BMI, TG, and BPG would not have decreased GFR. These findings warrant further investigation, and the effect on the association of decreased GFR with different levels of individual MetS components should therefore be interpreted judiciously.
The strengths of our study include the use of a large sample of healthy participants, addressing potential ascertainment bias. Second, we provided new insights to explore the relationships between different levels of individual MetS components and disparate effects on the prevalence of CKD. Studies in literatures focus primarily on the association between MetS and the numbers of its components with CKD. Therefore, in some way, our study was rare in this area.
The current study is not devoid of potential limitations inherent to its retrospective study. In the first place, its cross-sectional design makes it difficult to presume causality between individual MetS components and the risk of incurring CKD. In addition, it was not nationally representative or geographically diverse, primarily because the samples were comprised mostly of urban workers who underwent annual health check-up with low prevalence of CKD in Xuzhou. What’s more, CKD was defined by estimated GFR with only one measurement, which was impossible to determine whether participants who fulfilled outcome criteria for at least a three-month period. Despite these limitations, we still believe that those limitations should be consistently attenuated by the large sample size of the study.
Conclusions
In conclusion, MetS does not always play a critical role in decreased GFR with different levels of individual components of MetS exerting idiosyncratic effects in decreased eGFR. Elevated SBP, low HDL-C, and aging were definitely associated factors. There were no statistically significant differences between gender, FPG, and decreased GFR. Additionally, there might be unidentified confounders that influence the relation between TG levels and decreased eGFR. Elevated FPG, high TG, and abnormal BMI in MetS patients would not do harm to renal function. On the whole, our new perspective may greatly help to find potential implications for CKD in Public Health Practice and contributes to the knowledge base on MetS for future CKD prevention studies.
Declaration of interest
The authors report no conflicts of interest. The authors alone are responsible for the content and writing of the paper.
References
- Li Y, Zhao L, Chen Y, et al. Association between metabolic syndrome and chronic kidney disease in perimenopausal women. Int J Environ Res Public Health. 2013;10:3987–3997.
- Anavekar NS, Pfeffer MA. Cardiovascular risk in chronic kidney disease. Kidney Int. 2004;66:11–15.
- Mendy VL, Azevedo MJ, Sarpong DF, et al. The association between individual and combined components of metabolic syndrome and chronic kidney disease among African Americans: The Jackson Heart Study. PLoS One. 2014;9:e101610.
- Zhang L, Wang F, Wang L, et al. Prevalence of chronic kidney disease in China: A cross-sectional survey. Lancet. 2012;379:815–822.
- Song H, Wang X, Cai Q, Ding W, Huang S, Zhuo L. Association of metabolic syndrome with decreased glomerular filtration rate among 75,468 Chinese adults: A cross-sectional study. PLoS One. 2014;9:e113450.
- Lin B, Shao L, Luo Q, et al. Prevalence of chronic kidney disease and its association with metabolic diseases: A cross-sectional survey in Zhejiang province, Eastern China. BMC Nephrol. 2014;15:36.
- Chen J, Muntner P, Hamm LL, et al. The metabolic syndrome and chronic kidney disease in U.S. adults. Ann Intern Med. 2004;140:167–174.
- Singh AK, Kari JA. Metabolic syndrome and chronic kidney disease. Curr Opin Nephrol Hypertens. 2013;22:198–203.
- Nashar K, Egan BM. Relationship between chronic kidney disease and metabolic syndrome: Current perspectives. Diab Metab Syndr Obes. 2014;7:421–435.
- Yang T, Chu CH, Hsu CH, et al. Impact of metabolic syndrome on the incidence of chronic kidney disease: A Chinese cohort study. Nephrology. 2012;17:532–538.
- Lin JH, Wu HC, Huang WH, et al. Association between management of metabolic syndrome and progression of early-stage chronic kidney disease: An observational cohort study. Renal Fail. 2015;37:29–36.
- Yang T, Chou YC, Chu CH, et al. Metabolic syndrome and C-reactive protein concentration as independent correlates of chronic kidney disease. Endocrine Res. 2014;39:94–98.
- Tozawa M, Iseki C, Tokashiki K, et al. Metabolic syndrome and risk of developing chronic kidney disease in Japanese adults. Hypertens Res. 2007;30:937–943.
- Wahba IM, Mak RH. Obesity and obesity-initiated metabolic syndrome: Mechanistic links to chronic kidney disease. Clin J Am Soc Nephrol. 2007;2:550–562.
- Chen S, Liu H, Liu X, et al. Central obesity, C-reactive protein and chronic kidney disease: A community-based cross-sectional study in southern China. Kidney Blood Press Res. 2013;37:392–401.
- Ryu S, Chang Y, Woo HY, et al. Changes in body weight predict CKD in healthy men. J Am Soc Nephrol. 2008;19:1798–1805.
- Expert Panel on Detection, Evaluation, and Treatment of High Blood Cholesterol in Adults. Executive summary of the third report of the National Cholesterol Education Program (NCEP) Expert Panel on detection, evaluation, and treatment of high blood cholesterol in adults (Adult Treatment Panel III). JAMA. 2001;285:2486–2497.
- Ma YC, Zuo L, Chen JH, et al. Modified glomerular filtration rate estimating equation for Chinese patients with chronic kidney disease. J Am Soc Nephrol. 2006;17:2937–2944.
- Tanaka H, Shiohira Y, Uezu Y, Higa A, Iseki K. Metabolic syndrome and chronic kidney disease in Okinawa, Japan. Kidney Int. 2006;69:369–374.
- Kaysen GA. Disorders in high-density metabolism with insulin resistance and chronic kidney disease. J Ren Nutr. 2007;17:4–8.
- Rifkin DE, Katz R, Chonchol M, et al. Blood pressure components and decline in kidney function in community-living older adults: The Cardiovascular Health Study. Am J Hypertens. 2013;26:1037–1044.
- Utsumi K, Katsura K, Iino Y, Katayama Y. Blood pressure control in patients with chronic kidney disease. J Nippon Med Sch. 2012;79:111–114.
- Mentari E, Rahman M. Blood pressure and progression of chronic kidney disease: Importance of systolic, diastolic, or diurnal variation. Curr Hypertens Rep. 2004;6:400–404.
- Bell EK, Gao L, Judd S, et al. Blood pressure indexes and end-stage renal disease risk in adults with chronic kidney disease. Am J Hypertens. 2012;25:789–796.
- Chertow GM. The enlarging body of evidence: Obesity and chronic kidney disease. J Am Soc Nephrol. 2006;17:1501–1502.
- Bandgar TR, Kalra S, Sahay M. Metabolic syndrome leading to chronic kidney disease: An emerging threat. Indian J Endocrinol Metab. 2012;16:151–153.
- Lu JL, Molnar MZ, Naseer A, Mikkelsen MK, Kalantar-Zadeh K, Kovesdy CP. Association of age and BMI with kidney function and mortality: A cohort study. Lancet Diab Endocrinol. 2015;3:704–714.