
Abstract
Objective To analyze the relationship between serum high-sensitivity cardiac troponin T (hs-cTnT) and cardiovascular disease (CVD) among non-dialysis chronic kidney disease (CKD) patients, and to further explore its value of evaluating and predicting CVD in this population. Methods Five hundred and fifty-seven non-dialysis CKD patients were involved in this cross-sectional study. The relationship between serum hs-cTnT and CVD was analyzed using comparison between groups and regression analysis, and its value on assessing cardiac structure and function was evaluated by ROC curves. Results Median level of hs-cTnT was 13 (7–29) ng/L, with 1.7% undetectable, 46.4% greater than 99th percentile of the general population. Multivariate analysis suggested that compared with the lowest quartile of hs-cTnT, the highest quartile was approximately six times as likely to develop into LVH (OR, 6.515; 95% CI, 3.478–12.206, p < 0.05) and 18 times as likely to progress to left ventricular diastolic dysfunction(OR, 18.741; 95% CI, 2.422–145.017, p < 0.05). And Ln cTnT level had a more modest association with LVEF (OR, −1.117; 95% CI, −5.839 to −0.594; p < 0.05). When evaluated as a screening test, the area under the curve of ROC curves for hs-cTnT was 0.718, 0.788 and 0.736, respectively (p < 0.05). With a specificity of 90% as a diagnostic criterion, the value of hs-cTnT to evaluate LVH, LVEF < 50%, left ventricular diastolic dysfunction increased across CKD stages, from CKD 1 stage to CKD 5 stage. Conclusions In CKD non-dialysis population, hs-cTnT and NT-proBNP were valuable for evaluating LVH, left ventricular systolic dysfunction and left ventricular diastolic dysfunction.
Introduction
Chronic kidney disease (CKD) is considered as a major public health concern worldwide. CKD substantially increases the risk of cardiovascular disease (CVD),Citation1 which leads to a worse prognosis. CVD, with high prevalence and unobvious early symptoms, remains the leading cause of morbidity and mortality in patients with end-stage renal disease.Citation2,Citation3 It is of great importance to explore serum biomarkers for early assessment of cardiac structure and function among CKD non-dialysis patients, providing evidences to perform early intervention.
cTnT is released into circulation when myocardial cell injury and cell membrane integrity damages occur. Detected by highly sensitive assays, hs-cTnT, with high sensitivity and specificity for myocardial injury diagnosis, has been recommended as the primary basis of the diagnosis and risk stratification for acute coronary syndrome (ACS).Citation4 In the general population, cTnT was considered to be associated with LVH and left ventricular dysfunction, as well as an independent predictor of all-cause mortality and cardiovascular mortality.Citation5–12
The level of serum cTnT was reported higher in CKD patients compared with non-CKD ones,Citation13 which aroused dispute in its application of CVD assessment in CKD patients. Some studies suggested that serum hs-cTnTCitation13–17 was capable of evaluating cardiac structure and function abnormalities in CKD patients. However, there was no unified conclusion. Therefore, we carried out the following research aiming to evaluate the association of circulating hs-cTnT with LV structural and functional abnormalities among non-dialysis CKD patients.
Materials and methods
Participants
We recruited 577 non-dialysis CKD patients who were hospitalized in the nephrology department of Zhongshan Hospital, Fudan University from October 2012 to December 2013. Those with a self-reported heart failure history, cardiovascular/infection events in 3 months or renal replacement therapy (dialysis or kidney transplant) were excluded. Cardiovascular events include arrhythmia, angina pectoris and myocardial infarction. The study protocol was approved by the Ethics Committee of the Zhongshan Hospital Affiliated to Fudan University.
Clinical and laboratory data collection
Patient vital signs (body mass index and blood pressure) were recorded. Demographic characteristics (age and sex) and clinical history (cause of kidney disease, hypertension, diabetes, coronary artery disease [prior myocardial infarction or revascularization], smoking and medication history) were collected by interview on admission.
Blood and urine samples from each study participant were collected the day after admission for laboratory tests. Estimated glomerular filtration rate (eGFR) was calculated by the Modification of Diet in Renal Disease (MDRD) Study equation.Citation18 cTnT was measured using the high sensitivity assay (Roche Elecsys Cobas e411 or Cobas e602, Basel, Switzerland), with a detection limit of 3 ng/L.
Echocardiography
Two-dimensional transthoracic echocardiography was performed in all participants during hospitalization. The left ventricular mass (LVM) and left ventricular mass index (LVMI) were calculated according to the formula of Devereux and Reichek.Citation19 LVH was defined as LVMI ≥47 g/m2.7 in women and ≥50 g/m2.7 in men. Relative wall thickness (RWT) was calculated as (left ventricular septal thickness + posterior wall thickness)/left ventricular end-diastolic diameter. RWT was considered to be increased if ≥0.45. LV mass and RWT were used to categorize LV geometry: normal (normal LV mass and normal RWT), concentric remodeling (normal LV mass and increased RWT), eccentric hypertrophy(increased LV mass and normal RWT) and concentric hypertrophy (increased LV mass and increased RWT). Left ejection fraction was calculated as: (LV end-diastolic volume − LV end-systolic volume)/LV end-diastolic volume. LV systolic dysfunction was defined as ejection fraction < 0.45. Left ventricular diastolic dysfunction was defined as E-wave/A-wave < 1 and left atrial diameter > 40 mm.
Statistical analysis
Continuous data were expressed as mean (SD) for normally distributed continuous variables or median [interquartile range (IQR)] for non-normally distributed continuous variables, and number (percentage) for categorical data. The distribution of cTnT levels was depicted with frequency histogram. We assigned 1.5 ng/L to those whose cTnT was undetectable and categorized cTnT by quartiles. Demographic, laboratory and echocardiographic values were compared across quartiles of hs-cTnT by one-way ANOVA or rank-sum test for continuous variables, and chi-square test for categorical variables. Scatter plot and linear regression analysis were applied for assessing the relationship between hs-cTnT concentrations (cTnT level was log-transformed because of its skewed distribution) with kidney injury biomarkers (eGFR and UACR – urine albumin–creatinine ratio) or echocardiographic indicators (LVMI and LVEF). Univariate and multivariate linear regression (variables with univariate associations with the assessed LV-abnormalities were used as covariates for the multivariable analyses) or binary logistic regression (adjusting for related factors, respectively) was conducted to estimate the association between cardiac abnormalities and hs-cTnT (as a categorical variable). Receiver operating characteristic (ROC) curve was used to further explore the value of cTnT to predict cardiac abnormalities. SPSS17.0 statistical software (Chicago, IL) was applied for this analysis. A two-sided p < 0.05 was considered statistical significance.
Results
Baseline characteristics for participants
Five hundred and seventy-seven patients were recruited (male 58.9%, age: 51.7 ± 16.1). The primary causes for renal disease were glomerulonephritis 61.5%, diabetic nephropathy 12.0%, hypertensive renal injury 5.2%, and so on. The proportions of CKD 1–5 stages were 20.5%, 20.8%, 22.9%, 13.9% and 22.0% respectively.
Distribution of cardiac troponin values
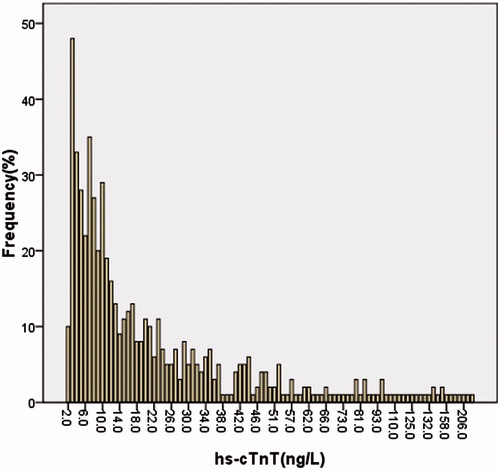
The median (IQR) concentration of cTnT was 13 (7–29) ng/L, with 98.3% detectable, 46.4% greater than the 99th percentile of the general population (14 ng/L) ().
Figure 1. Distribution of hs-cTnT values of CKD non-dialysis patients. Hs-TnT was detectable in 98.3% of subjects; median (IQR) of hs-TnT was 13.0 (7.0–29.0) ng/L.
Clinical and laboratory characteristics
hs-cTnT level was positively associated with age, systolic or diastolic blood pressure, hs-CPR and prevalence of male, hypertension, diabetes, smoking, diabetic nephropathy and hypertensive renal injury. hs-cTnT level was negatively associated with hemoglobin, eGFR and prevalence of glomerulonephritis (p <0.05) ().
Table 1. Clinical characteristics and echocardiographic indicators by hs-cTnT levels.
Kidney injury indicators
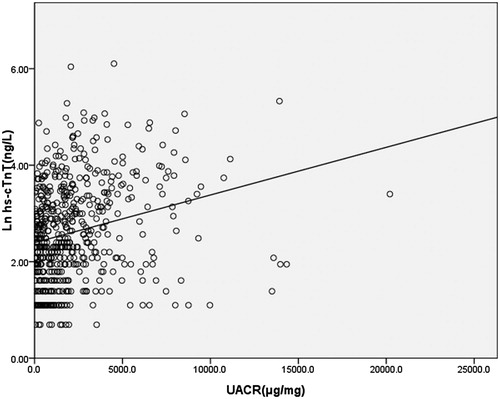
shows increased urine albumin–creatinine ratio and decreased eGFR trends across progressive quartiles of hs-cTnT. hs-cTnT was demonstrated to be negatively associated with eGFR (regression coefficients −0.019; 95%CI, −0.021 to −0.017; p <0.001), and positively associated with UACR (regression coefficients 0.00010; 95%CI, 0.00007–0.00013; p <0.001) ( and ).
Figure 2. Scatter plot of Ln hs-cTnT versus eGFRMDRD, line indicated best-fit regression lines derived from the least mean square method. The regression equation was Ln(hs-cTnT) (ng/L) = 3.625 + (−0.019)×eGFRMDRD (mL/min/1.73 m2), with p < 0.001.
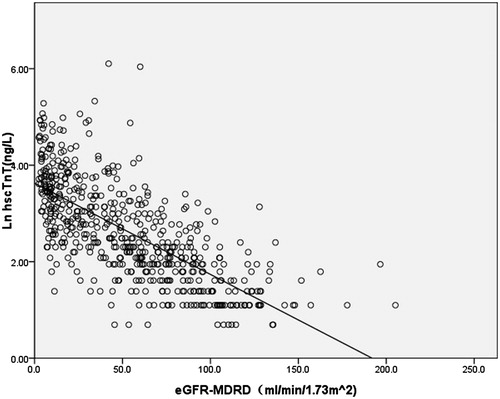
Figure 3. Scatter plot of Ln hs-cTnT versus UACR, line indicated best-fit regression lines derived from the least mean square method. The regression equation was Ln(hs-cTnT) (ng/L) = 2.394 + 0.0001 × UACR (μg/mg), p < 0.001.
Cardiac structure and function
There was a high prevalence of LVH, left ventricular diastolic dysfunction with the proportion 43.7% and 9.4%, respectively, in CKD patients. Decrease of LVEF, with an average of (65.68 ± 5.40)%, is also observed in CKD patients.
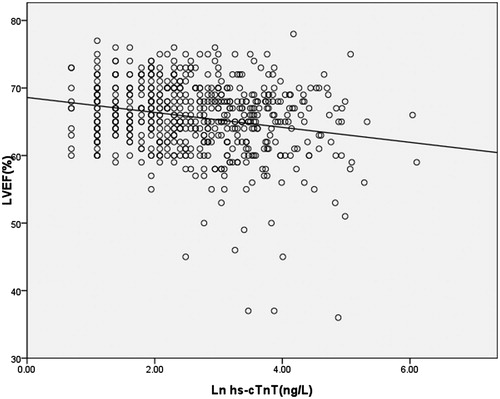
Progressively higher hs-cTnT quartiles were associated with greater LVMI, lower LVEF; higher prevalence of LVH, LVEF < 50% and LV diastolic dysfunction (p <0.001) (). The prevalence of LVH and LV diastolic dysfunction were ranging from 17.7% and 0.7% of the lowest quartile to 67.8% and 17.5% of the highest quartile, respectively. Univariate lineal regression analysis suggested that hs-cTnT correlated positively with LVMI and negatively with LVEF ( and ).
Figure 4. Scatter plot of Ln hs-cTnT versus LVMI, line indicated best-fit regression lines derived from the least mean square method. The regression equation was LVMI (g/mCitation2,7) = 30.377 + 7.046 × Ln(hs-cTnT) (ng/L), with p < 0.001.
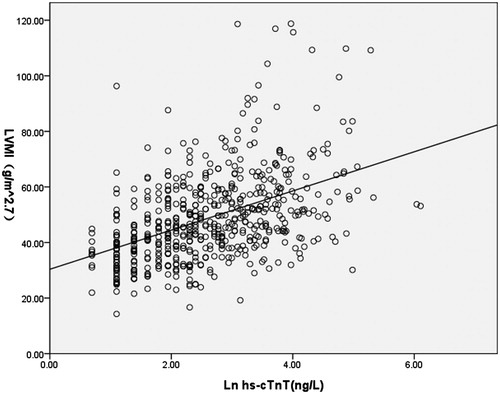
Figure 5. Scatter plot of Ln hs-cTnT versus LVEF, line indicated best-fit regression lines derived from the least mean square method. The regression equation was LVEF (g/m2.Citation7) = 68.593 + (−1.107)×Ln(hs-cTnT) (ng/L), with p < 0.001.
In the binary logistic analysis, compared with the lowest quartile of hs-cTnT, the highest three quartiles was significantly associated with LVH, which still held statistical significance adjusted for eGFR. And in the fully adjusted mode, the highest two quartiles were approximately three and six times as likely to have LVH (OR, 2.735; 95%CI, 1.475–5.071, p = 0.016 < 0.05 and OR, 6.515; 95%CI, 3.478–12.206, p < 0.001). In the univariate binary logistic analysis, the highest three quartiles were correlated with LV diastolic dysfunction, which was attenuated when adjusted for eGFR. The highest two quartiles were approximately 14 and 18 times as likely to have LV diastolic dysfunction (OR, 14.672; 95% CI, 1.905–112.995, p = 0.034 < 0.05 and OR, 18.741; 95% CI, 2.422–145.017, p = 0.02 < 0.05) compared with the lowest quartile. As the proportion of LVEF < 50% was low, we took linear regression to estimate the relationship between LVEF and hs-cTnT as a categorical variable, demonstrating that hs-cTnT was negatively associated with LVEF (OR, −0.877; 95% CI, −1.269 to −0.484; p = 0.002 < 0.05), adjusted for other relevant factors ().
Table 2. Association between hs-cTnT with LVH, systolic dysfunction, and diastolic dysfunction.
Evaluating value of hs-cTnT for cardiac structure or function abnormalities
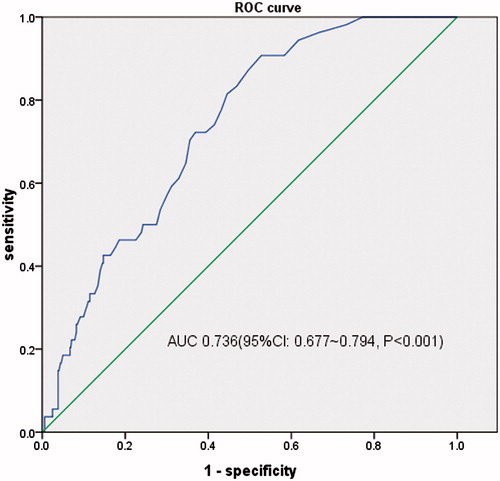
When evaluated as a screening test, the area under the curve (AUC) of ROC curves for hs-cTnT evaluating LVH, LVEF < 50%, LV diastolic dysfunction were 0.718 (95%CI, 0.676–0.759, p < 0.001), 0.788 (95%CI, 0.676–0.901, p < 0.001) and 0.736 (95%CI, 0.677–0.794, p < 0.001), respectively. And the best critical value of hs-cTnT was 18 ng/L (sensitivity 59.1%, specificity 74.5%) for LVH, 12 ng/L (sensitivity 100.0%, specificity 47.5%) for LVEF < 50% and 18 ng/L (sensitivity 72.2%, specificity 63.1%) for LV diastolic dysfunction ().
Figure 6. ROC curve of hs-cTnT evaluating LVH among CKD non-dialysis patients.
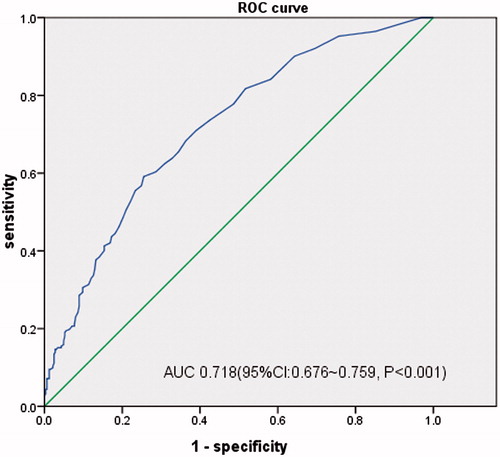
Figure 7. ROC curve of hs-cTnT evaluating LVEF < 50% among CKD non-dialysis patients.
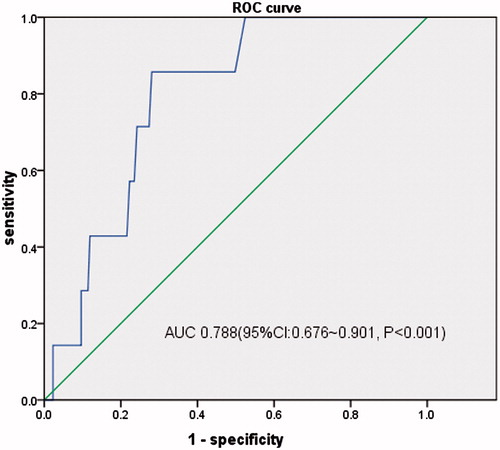
Figure 8. ROC curve of hs-cTnT evaluating LV diastolic dysfunction among CKD non-dialysis patients.
With a specificity of 90% as a diagnostic criteria, the value of hs-cTnT to evaluate cardiac structure or function abnormalities increased from CKD 1 to CKD 5 stages, suggesting that renal function should be taken into consideration when using hs-cTnT to assess cardiac structure and function ().
Table 3. With a specificity of 90%, value of hs-cTnT to evaluate cardiac structure or function abnormalities in CKD 1–5.
Discussion
CVD is common in CKD patients, which has become the primary cause of death. Cardiac structure and function abnormality, with high prevalence and unobvious early symptoms, raised cardiovascular and all-cause mortality of CKD. Therefore, it is of great importance to explore serum biomarkers of cardiac structure and function abnormalities among CKD non-dialysis patients as to screen out the ones with high risk of cardiovascular events and to start early intervention.
cTnT, a spherical single-stranded molecule, with molecular weight of 37 kDa, is an integral part of the myocardium and a regulatory protein involved in cardiac contraction. Normally, 95% of cTnT is combined with other cardiac proteins, and only 5% of it exists as free type in the cytosol of myocardial cells. When myocardial cell membrane integrity damages, cTnT is released into the circulation, inducing a rapid and transient elevation of serum cTnT, which will last along with aggravated myocardial injury and continuous degradation of cardiac muscle fibers.Citation20 Detected by highly sensitive assays, and with high sensitivity and specificity for myocardial injury, the level of hs-cTnT has been recommended as the primary basis of the diagnosis and risk stratification for ACS.Citation4 In the general population, cTnT was considered to be associated with LVH and left ventricular dysfunction, and to be an independent predictor of all-cause mortality and cardiovascular mortality.Citation5–7,Citation9,Citation11,Citation21
Our study included CKD non-dialysis patients, and the ones with heart failure history were excluded. The prevalence of LVH in our study was 43.7%, which was similar to the one reported (47.6%) by Mishra et al.Citation14 in patients with eGFR 30–60 mL/min/1.73 m2 and no heart failure. The proportion of patients with LVEF exceeded 50% and with normal left ventricular diastolic function were 98.8% and 90.6%, respectively. We considered that it is because of high proportion of patients in early CKD stages and the exclusion of the ones with heart failure history.
In our study, the average of hs-cTnT and the proportion of patients with detectable hs-cTnT was 98.3%, higher than Dublin’s report,Citation13 which was thought to be attributed to not ruling out CAD patients. There were 46.4% of patients with hs-cTnT level above the 99th percentile of population, which was lower than some published researches.Citation13,Citation15 We supposed that it may be associated with the greater proportion of patients at CKD early stages in our participants compared with other researches. Further analysis showed that Ln hs-cTnT had negative association with eGFR (regression coefficients −0.019; 95%CI, −0.021 to −0.017; p <0.05), and positive association with UACR (regression coefficients 0.00010; 95%CI, 0.00007–0.00013; p <0.05), which was consistent with the literature reports.Citation20 Urine albumin, representing systemic microvascular functional status, was considered one of cardiovascular risk factors in CKD patients,Citation21 which could partly explain its relevance with hs-cTnT.
Our study suggested that hs-cTnT level was influenced both by cardiac and renal factors. In our study, hs-cTnT showed a significant upward trend as eGFR declined, and hs-cTnT was significantly associated with LVH adjusted for eGFR. The increase of cTnT is not completely attributed to decreased renal clearance capacity.Citation13 Myocardial micro-necrosis,Citation22 increase of left ventricular end-diastolic pressure and wall tension, subendocardial hypoperfusion, and cell membrane permeability changes, may play important roles in cTnT leakage,Citation23 and induces increase of cTnT.
In our research, progressively higher hs-cTnT quartiles were associated with greater LVMI, lower LVEF and higher prevalence of LV diastolic dysfunction. Our univariate and multivariate analyses both suggested that hs-cTnT was in negative correlation with LVEF. The AUC of ROC curves for hs-cTnT evaluating LVH, LVEF < 50%, LV diastolic dysfunction were 0.718, 0.788 and 0.736, which were higher than reported (0.64, 0.59 and 0.56, respectivelyCitation14), suggesting that there is certain efficacy of hs-cTnT to assess cardiac structure or function. Thus, it could be considered as a marker of poor prognosis for cardiovascular events.
Our research also found that with a specificity of 90%, the value of hs-cTnT to evaluate cardiac structure or function abnormalities increased across CKD stages, implying that we should take renal function into account when using hs-cTnT to assess cardiac structure and function.
However, there came the controversy in the assessing value of cTnT of CVDs in CKD population owing to its general serum concentration increase in CKD patients. Past reportsCitation24,Citation25 with traditional detection method had different opinions in the relationship between cTnT and LVH. Recent studies applied high sensitive detection method in CKD patients, indicating that hs-cTnT was associated with LVH and LV dysfunction and was an independent predictor of cardiovascular events, cardiovascular mortality and all-cause mortality. Our research suggested that serum hs-cTnT, which was correlated with LVH, LV systolic and diastolic dysfunction, had certain capability to evaluate cardiovascular conditions in CKD population, indicating that, in non-dialysis CKD patients, periodic monitoring of serum hs-cTnT level may be important for early screen for population with high risk of cardiovascular events, and for taking preventive intervention as soon as possible.
Disclosure statement
The authors report no conflicts of interest. The authors alone are responsible for the content and writing of the paper. Key Projects in the National Science & Technology Pillar Program in the Twelfth Five-year Plan Period (2011BAI10B07).
Funding information
This work was supported by three funds: Program for Outstanding Medical Academic Leader, grant from Project of Technology Committee in Shanghai (14DZ2260200, Shanghai Key Laboratory of Kidney and Blood Purification), Projects in Ministry of Science and Technology Pillar Program (2011BAI10B03).
References
- K/DOQI clinical practice guidelines for chronic kidney disease: Evaluation, classification, and stratification. Am J Kidney Dis. 2002;39:S1–S266.
- Foley RN. Clinical epidemiology of cardiovascular disease in chronic kidney disease. J Renal Care. 2010;36:4–8.
- Cioffi G, Tarantini L, Frizzi R, et al. Chronic kidney disease elicits excessive increase in left ventricular mass growth in patients at increased risk for cardiovascular events. J Hypertens. 2011;29:565–573.
- Hamm CW, Bassand JP, Agewall S, et al. ESC Guidelines for the management of acute coronary syndromes in patients presenting without persistent ST-segment elevation: The task force for the management of acute coronary syndromes (ACS) in patients presenting without persistent ST-segment elevation of the European Society of Cardiology (ESC). Eur Heart J. 2011;32:2999–3054.
- De Lemos JA, Drazner MH, Omland T, et al. Association of troponin T detected with a highly sensitive assay and cardiac structure and mortality risk in the general population. JAMA. 2010;304:2503–2512.
- Neeland IJ, Drazner MH, Berry JD, et al. Biomarkers of chronic cardiac injury and hemodynamic stress identify a malignant phenotype of left ventricular hypertrophy in the general population. J Am Coll Cardiol. 2013;61:187–195.
- Lowbeer C, Gustafsson SA, Seeberger A, et al. Serum cardiac troponin T in patients hospitalized with heart failure is associated with left ventricular hypertrophy and systolic dysfunction. Scand J Clin Lab Invest. 2004;64:667–676.
- Missov E, Mair J. A novel biochemical approach to congestive heart failure: Cardiac troponin T. Am Heart J. 1999;138:95–99.
- Ishii J, Nomura M, Nakamura Y, et al. Risk stratification using a combination of cardiac troponin T and brain natriuretic peptide in patients hospitalized for worsening chronic heart failure. Am J Cardiol. 2002;89:691–695.
- Sato Y, Yamada T, Taniguchi R, et al. Persistently increased serum concentrations of cardiac troponin T in patients with idiopathic dilated cardiomyopathy are predictive of adverse outcomes. Circulation. 2001;103:369–374.
- Shah RV, Chen-Tournoux AA, Picard MH, et al. Association between troponin T and impaired left ventricular relaxation in patients with acute decompensated heart failure with preserved systolic function. Eur J Echocardiogr. 2009;10:765–768.
- Okura H, Suzuki R, Sugibayashi S, et al. [Performance and clinical utility of a high-sensitivity troponin T assay]. Rinsho Byori. 2012;60:407–413.
- Dubin RF, Li Y, He J, et al. Predictors of high sensitivity cardiac troponin T in chronic kidney disease patients: A cross-sectional study in the chronic renal insufficiency cohort (CRIC). BMC Nephrol. 2013;14:229.
- Mishra RK, Li Y, Defilippi C, et al. Association of cardiac troponin T with left ventricular structure and function in CKD. Am J Kidney Dis. 2013;61:701–709.
- Hasegawa M, Ishii J, Kitagawa F, et al. Prognostic value of highly sensitive troponin T on cardiac events in patients with chronic kidney disease not on dialysis. Heart Vessels. 2013;28:473–479.
- Sezer S, Karakan S, Ozdemir N. Increased cardiac troponin T levels are related to inflammatory markers and various indices of renal function in chronic renal disease patients. Ren Fail. 2012;34:454–459.
- Satyan S, Light RP, Agarwal R. Relationships of N-terminal pro-B-natriuretic peptide and cardiac troponin T to left ventricular mass and function and mortality in asymptomatic hemodialysis patients. Am J Kidney Dis. 2007;50:1009–1019.
- Levey AS, Bosch JP, Lewis JB, et al. A more accurate method to estimate glomerular filtration rate from serum creatinine: A new prediction equation. Modification of Diet in Renal Disease Study Group. Ann Intern Med. 1999;130:461–470.
- Devereux RB, Reichek N. Echocardiographic determination of left ventricular mass in man. Anatomic validation of the method. Circulation. 1977;55:613–618.
- Defilippi C, Seliger SL, Kelley W, et al. Interpreting cardiac troponin results from high-sensitivity assays in chronic kidney disease without acute coronary syndrome. Clin Chem. 2012;58:1342–1351.
- Peralta CA, Shlipak MG, Judd S, et al. Detection of chronic kidney disease with creatinine, cystatin C, and urine albumin-to-creatinine ratio and association with progression to end-stage renal disease and mortality. JAMA. 2011;305:1545–1552.
- Fredericks S, Murray JF, Bewick M, et al. Cardiac troponin T and creatine kinase MB are not increased in exterior oblique muscle of patients with renal failure. Clin Chem. 2001;47:1023–1030.
- Hittinger L, Mirsky I, Shen YT, et al. Hemodynamic mechanisms responsible for reduced subendocardial coronary reserve in dogs with severe left ventricular hypertrophy. Circulation. 1995;92:978–986.
- Goicoechea M, Garca De Vinuesa S, Gomez-Campdera F, et al. Clinical significance of cardiac troponin T levels in chronic kidney disease patients: Predictive value for cardiovascular risk. Am J Kidney Dis. 2004;43:846–853.
- Abbas NA, John RI, Webb MC, et al. Cardiac troponins and renal function in nondialysis patients with chronic kidney disease. Clin Chem. 2005;51:2059–2066.