
Abstract
Background: Recent evidence suggests that increased visceral adiposity is a strong independent risk factor for cardiovascular death and all-cause mortality in hemodialysis (HD) patients. Irisin, which is a novel myokine, can play critical roles in diabetes and adiposity. The purpose of our study was to investigate whether serum irisin levels are associated with body mass index, waist circumference (WC), and total fat mass in non-diabetic patients undergoing maintenance HD.
Methods: This cross-sectional study included 108 non-diabetic HD patients and 40 age- and sex-matched apparently healthy subjects. Serum irisin concentrations were determined using an enzyme-linked immunosorbent assay. Body fat composition (TBF-410 Tanita Body Composition Analyzer) was measured and calculated.
Results: Serum irisin levels did not differ between HD patients and the healthy controls (523.50 ± 229.32 vs. 511.28 ± 259.74, p = 0.782). Serum irisin levels were associated with age (r = 0.314; p =0.006), HOMA-IR (r = 0.472; p = 0.003), WC (r = 0.862; p < 0.001), and total fat mass (r = 0.614; p < 0.001). In multivariate regression analysis, WC (β = 1.240, p < 0.001) and total fat mass (β = 0.792, p = 0.015) were the variables that were significantly associated with irisin concentrations (R2 = 0.684, p < 0.001) after adjusting for confounding factors (age and HOMA-IR). Conclusions: These results suggest that serum irisin levels are related to visceral adiposity in non-diabetic HD patients.
Introduction
Obesity is currently considered to be a worldwide public health concern because it has been closely associated with a greater risk for cardiovascular disease (CVD) and mortality.Citation1–4 However, excess weight is associated with improved survival, better CVD outcomes and mortality in end-stage renal disease (ESRD) patients treated with hemodialysis (HD).Citation5–10 Body mass index (BMI) is not a predictor of all-cause and CV death, while waist circumference (WC) and the waist/hip ratio are surrogate measurements for abdominal obesity, which underlies a high risk of all-cause and CV mortality in patients with ESRD.Citation11,Citation12 Some studies showed that higher muscle mass appears to be associated with better clinical and survival outcomes in the HD population.Citation13,Citation14 It is well known that BMI cannot differentiate skeletal muscle mass and fat mass and that BMI is affected not only by fat and muscle mass but also by fluid status.Citation5,Citation15 BMI is not accepted to be a strong indicator of fat mass in body composition.
Irisin is a recently discovered myokine that is the cleavage product of the membrane protein fibronectin type III domain containing (FNDC5). Irisin is directly activated by peroxisome proliferator-activated receptor-γ coactivator-1α, which is a transcriptional coactivator in the muscle that was upregulated during 10 weeks of exercise training in rodent models.Citation16 Interestingly, this myokine has been proposed to participate in white fat browning and has been reported to be expressed in skeletal muscle.Citation17 High irisin levels have been associated with improved insulin sensitivity, increased energy expenditure and decreased liver fat content.Citation18,Citation19 Circulating irisin levels were observed to correlate with fat mass, BMI, and metabolic syndrome.Citation20–24
The aims of the present work were to evaluate circulating human irisin levels in a group of normal-weight and obese chronic HD patients and to investigate whether circulating human irisin levels correlate with direct and indirect markers of adiposity and with hormones that control energy homeostasis.
Materials and methods
The inclusion criteria included patients aged 18 years and older who were undergoing maintenance HD therapy for more than 3 months and who were delivered an adequate dose of dialysis (single-pool Kt/V > 1.2) on a thrice-weekly dialysis program using biocompatible HD membranes. Patients with diabetes mellitus, diabetic nephropathy, cancer, overt infection, vasculitis and liver disease were excluded from this study. Two hundred and sixty-seven consecutive HD patients were evaluated from Hemodialysis unit of Ankara Oncology Training and Research Hospital and Turgut Ozal University Hospital. One hundred and forty-five HD patients met all the inclusion and exclusion criteria. Seventy-five gram oral glucose tolerance test was performed in 145 HD patients. Diabetes was defined as fasting glucose ≥126 mg/dL and/or 2-h post-load glucose ≥200 mg/dL according to the 2006 World Health Organization (WHO) criteria. Thirty-seven established type 2 diabetes. So, the studied subjects included 108 patients (54 males and 54 females, mean age 54.5 ± 3.8 years, mean dialysis history 7.2 ± 0.8 years) who were undergoing HD 3 times per week from December 2012 to February 2015. In addition, 40 age- and sex-matched apparently healthy subjects were included. The study was approved by the Local Ethics Committee (IRB Number: 99950669/343). Written informed consent was obtained from each participant.
Systolic blood pressure and diastolic blood pressure were assessed using a digital monitor (Medisana AG, MTC, Neuss, Germany) according to the WHO criteria. Venous blood was sampled in the morning before dialysis after an overnight fast of more than 8 h. Serum total cholesterol (TC), high-density lipoprotein-cholesterol (HDL-c), triglycerides (TG) C-reactive protein (CRP), creatinine and glucose concentrations were measured using an autoanalyzer (Cobas Integra 800, Roche Diagnostics GmbH, Manheim, Germany) with specific kits. Low-density lipoprotein-cholesterol (LDL-c) levels were calculated using the Friedewald formula, as follows: LDL-c = TC − HDL-c − TG/5. Plasma glucose was measured using the glucose oxidase method. Serum insulin was measured using an enzyme immunoassay kit (SRL, Inc., Tokyo, Japan). Insulin resistance was calculated using the homeostasis model assessment (HOMA-IR) method.Citation12
Body weight measurements were performed using a digital balance accurate to 0.1 kg (Tanita bioelectrical impedance (BIA); TBF-410, Tanita, Tokyo, Japan), and height was measured using a wall-mounted stadiometer (Seca 220; Vogel and Halke, Hamburg, Germany). BMI was calculated as the body weight divided by the height squared (kg/m2). WC was measured at the site of the smallest circumference between the rib cage and the iliac crest. Body fat was quantified using the TBF-410 Tanita Body Composition Analyzer (Tokyo, Japan). All measurements were collected with the subjects in underwear and after an overnight fast. Anthropometric and body composition measurements were performed after the completion of dialysis on the last day of the week.
Serum irisin concentrations were analyzed using enzyme-linked immunosorbent assay (ELISA) kits (catalog no. EK-067–52, Aviscera Biosciences, Santa Clara, CA), according to the manufacturer’s protocol. The assay was proven to be highly sensitive for detecting human irisin. All samples were analyzed in duplicate. The sensitivity of the assay was 4.15 ng/mL, and the detectable range of the kit was 0.066–1024 ng/mL.Citation24,Citation25 The intra- and inter-assay variations were both less than 10%.
All analyses were performed using the SPSS statistical package (version 17; SPSS, Inc., Chicago, IL). Continuous data were presented as the mean ± SD or the median (interquartile range). Categorical variables were summarized as percentages and comparison of categorical variables was evaluated by the chi-square test. The distribution of variables was assessed for normality using the Kolmogorov–Smirnov test. The Spearman correlation was used to examine the association of irisin with other variables for univariate analysis. Multivariate regression analysis was performed with irisin as the dependent variable and the variables of interest as independent variables that were found to approach significance (p < 0.1) in the univariate analysis.
Results
The clinical, laboratory, and demographic characteristics of the study participants are presented in . Serum irisin levels were similar in HD patients and the healthy controls (523.5 ± 229.3 ng/mL vs. 511.2 ± 259.7 ng/mL, p = 0.782). No significant differences in age and gender were observed between the HD patients and the control group. Serum irisin levels were significantly and positively correlated with age (r = 0.314; p =0.006), HOMA-IR (r = 0.472; p = 0.003), WC (r = 0.862; p < 0.001) (), and total fat mass (r = 0.614; p < 0.001) (), but not other metabolic parameters (). Conversely, irisin serum levels were not correlated with two parameters of adiposity: body weight and BMI.
Figure 1. There was a strong association between serum irisin levels and WC.
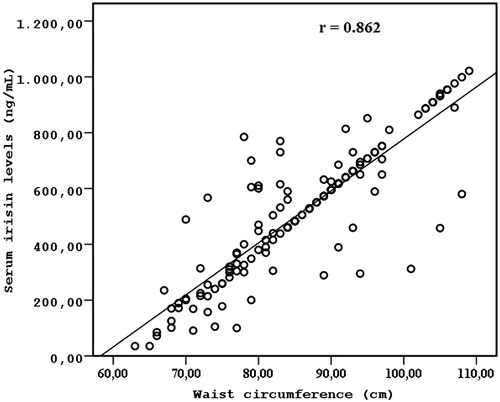
Figure 2. Total body fat mass was related to serum irisin levels.
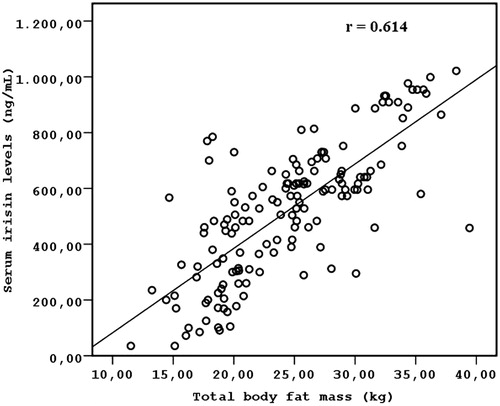
Table 1. Baseline characteristics of HD patients and healthy controls.
Table 2. Univariate and multivariate regression analyses demonstrating factors showing correlation with serum irisin levels.
Multivariate regression analysis showed that WC (β = 1.240, p < 0.001) and total fat mass (β = 0.792, p = 0.015) were the variables that were significantly associated with irisin concentrations (R2 = 0.684, p < 0.001), whereas age and HOMA-IR did not correlate significantly with irisin concentrations ().
Discussion
This study is the first study to evaluate the association between circulating irisin levels and adiposity in non-diabetic patients undergoing maintenance HD. In this study, we demonstrated that circulating irisin levels are related to adiposity in non-diabetic patients undergoing maintenance HD.
According to our results, circulating irisin levels correlate with WC and total fat mass in non-diabetic patients undergoing maintenance HD. Some evidence showed that circulating irisin levels are elevated in obese individuals.Citation20–22,Citation26 Likewise, a correlation was observed between circulating irisin levels and BMI.Citation20–22,Citation27 Furthermore, clinical and experimental studies revealed that irisin correlates with fat mass.Citation20,Citation22,Citation26,Citation28 However, there were some reports of negative correlations,Citation23,Citation29 despite those reports of positive correlations.Citation20,Citation22,Citation26,Citation28 Thus, contradictory data concerning the relationship between irisin and adiposity have been reported in the literature. In contrast to these studies, we observed no correlation of BMI with circulating irisin levels. We explained this unexpected result as follows: WC may be an optimal surrogate of visceral obesity in comparison to BMI, which poorly reflects intra-abdominal (truncal) fat. Indeed, Postorino et al. showed that WC was a stronger predictor of all-cause and CV death than BMI among 537 patients with ESRD. Although current guidelines and most large epidemiologic studies use BMI to define obesity, BMI has a limited ability to differentiate between muscle mass and fat mass.Citation5,Citation15 In non-diabetic patients undergoing maintenance HD, we suggest that circulating irisin levels reflect net body adiposity and visceral adiposity due to the strong association between serum irisin levels and both WC and total fat mass. Our explanation for this finding is outlined below. First, irisin was initially identified as a myokine that is secreted by muscles after aerobic exercise training; it might be feasible that the overexpression and increased release of muscle irisin is stimulated by signals that originate in adipose tissue, contributing to the increased levels of circulating irisin that were observed in obese individuals.Citation30 Second, an adaptive mechanism for responding to decreased insulin sensitivity and other metabolic disturbances that are associated with obesity can lead to increased circulating irisin levels. Third, FNDC5/irisin is also an adipokine that is expressed and secreted mainly by adipose tissue.Citation28,Citation30 Thus, this report led us to speculate that increased adipose tissue can play a role in determining circulating FNDC5/irisin levels.
In our study, we observed a significant positive correlation between circulating irisin levels and insulin resistance, as indicated by HOMA-IR; this finding is similar to the findings reported in the study of Park et al.Citation24 However, we found no association between circulating irisin levels and HOMA-IR after multivariate analysis. Irisin was identified as a potential factor associated with the progression of insulin resistance during the weight maintenance period after a dietary weight-lowering program in obese patients.Citation31 Previous reports demonstrated the existence of positive associations between circulating irisin levels or FNDC5 expression in human myotubes and both fasting insulin concentrations and HOMA-IR.Citation27,Citation32 Irisin is likely to be involved in glucose metabolism and may thus prevent the development of insulin resistance.Citation30,Citation33,Citation34 Some evidence has addressed the relationship between decreased serum irisin levels and insulin resistance or diabetes.Citation30,Citation33,Citation34 This effect could be explained by the fact that central obesity correlates strongly with insulin resistance.Citation35 Thus, the association of irisin with HOMA-IR may be subsequently reflected in central obesity.
Some limitations of our study should be noted. First, the cross-sectional design provides associative rather than causal evidence. Second, anthropometric measures and bioelectrical impedance analysis (BIA) are accessible, safe, and cost-efficient methods that avoid exposure to radiation and have been widely used to measure body composition in clinical populations; however, visceral adipose tissue (VAT) is only an indirect measure when using these approaches. Only CT and MRI can provide direct volumetric measures of VAT. Third, the physical activity status of the participants is unknown, although numerous approaches have been used to assess physical activity and demonstrate that irisin is augmented with activity or exercise training. Fourth, irisin has a positive effect on glucose homeostasis. HD patients with diabetes mellitus were not included to eliminate to this interaction. Fourth, the measurement of plasma or serum irisin levels by ELISA is easily available and may provide remarkable information for a wide range of pathological conditions, therapeutics and clinical practice, but the heterogeneous and often discrepant results were reported. In addition, a normal range of circulating irisin levels has not yet been determined.Citation36 The inconsistency in circulating irisin levels observed only reflect inter-population or methodological variations, assay discrepancies and/or preanalytical variability (i.e., blood collection, handling, storage, repeated melting, etc.).Citation36
In summary, our results suggest that serum irisin levels correlate positively with total fat mass and WC and represent a surrogate method for measuring visceral adiposity in non-diabetic HD patients. Prospective studies with larger sample sizes are needed to clarify the physiological role of irisin in obesity in the general population and in HD patients.
Disclosure statement
All authors declare that they have no conflict of interest. Ethical approval: All procedures performed in studies involving human participants were in accordance with the ethical standards of the institutional and/or national research committee and with the 1964 Helsinki declaration and its later amendments or comparable ethical standards (IRB Number: 99950669/343). Informed consent: Informed consent was obtained from all individual participants included in the study.
References
- Flegal KM, Carroll MD, Ogden CL, Curtin LR. Prevalence and trends in obesity among US adults, 1999–2008. JAMA. 2010;303:235–241.
- Jiang J, Ahn J, Huang WY, Hayes RB. Association of obesity with cardiovascular disease mortality in the PLCO trial. Prev Med. 2013;57:60–64.
- Romero-Corral A, Montori VM, Somers VK, et al. Association of bodyweight with total mortality and with cardiovascular events in coronary artery disease: A systematic review of cohort studies. Lancet. 2006;368:666–678.
- Flegal KM, Kit BK, Orpana H, Graubard BI. Association of all-cause mortality with overweight and obesity using standard body mass index categories: A systematic review and meta-analysis. JAMA. 2013;309:71–82.
- Beddhu S, Pappas LM, Ramkumar N, Samore M. Effects of body size and body composition on survival in hemodialysis patients. J Am Soc Nephrol. 2003;14:2366–2372.
- Johansen KL, Young B, Kaysen GA, Chertow GM. Association of body size with outcomes among patients beginning dialysis. Am J Clin Nutr. 2004;80:324–332.
- Kalantar-Zadeh K, Kopple JD, Kilpatrick RD, et al. Association of morbid obesity and weight change over time with cardiovascular survival in hemodialysis population. Am J Kidney Dis. 2005;46:489–500.
- Kalantar-Zadeh K, Abbott KC, Salahudeen AK, Kilpatrick RD, Horwich TB. Survival advantages of obesity in dialysis patients. Am J Clin Nutr. 2005;81:543–554.
- Port FK, Ashby VB, Dhingra RK, Roys EC, Wolfe RA. Dialysis dose and body mass index are strongly associated with survival in hemodialysis patients. J Am Soc Nephrol. 2002;13:1061–1066.
- Kakiya R, Shoji T, Tsujimoto Y, et al. Body fat mass and lean mass as predictors of survival in hemodialysis patients. Kidney Int. 2006;70:549–556.
- Postorino M, Marino C, Tripepi G, Zoccali C; CREDIT (Calabria Registry of Dialysis and Transplantation) Working Group. Abdominal obesity and all-cause and cardiovascular mortality in end-stage renal disease. J Am Coll Cardiol. 2009;53:1265–1272.
- Zhang C, Rexrode KM, van Dam RM, Li TY, Hu FB. Abdominal obesity and the risk of all-cause, cardiovascular, and cancer mortality: Sixteen years of follow-up in US women. Circulation. 2008;117:1658–1667.
- Kalantar-Zadeh K, Streja E, Kovesdy CP, et al. The obesity paradox and mortality associated with surrogates of body size and muscle mass in patients receiving hemodialysis. Mayo Clin Proc. 2010;85:991–1001.
- Jialin W, Yi Z, Weijie Y. Relationship between body mass index and mortality in hemodialysis patients: A meta-analysis. Nephron Clin Pract. 2012;121:c102–c111.
- Sarkar SR, Kuhlmann MK, Kotanko P, et al. Metabolic consequences of body size and body composition in hemodialysis patients. Kidney Int. 2006;70:1832–1839.
- Boström P, Wu J, Jedrychowski MP, et al. A PGC1-alphadependent myokine that drives brown-fat-like development of white fat and thermogenesis. Nature. 2012;481:463–468.
- Spiegelman BM. Regulation of adipogenesis: Toward new therapeutics for metabolic disease. Diabetes. 2013;62:1774–1782.
- Hojlund K, Bostrom P. Irisin in obesity and type 2 diabetes. J Diabetes Complications. 2013;27:303–304.
- Zhang HJ, Zhang XF, Ma ZM, et al. Irisin is inversely associated with intrahepatic triglyceride contents in obese adults. J Hepatol. 2013;59:557–562.
- Huh JY, Panagiotou G, Mougios V, et al. FNDC5 and irisin in humans: I. Predictors of circulating concentrations in serum and plasma and II. mRNA expression and circulating concentrations in response to weight loss and exercise. Metab: Clin Exp. 2012;61:1725–1738.
- Crujeiras AB, Pardo M, Arturo RR, et al. Longitudinal variation of circulating irisin after an energy restriction induced weight loss and following weight regain in obese men and women. Am J Human Biol. 2014;26:198–207.
- Pardo M, Crujeiras AB, Amil M, et al. Association of irisin with fat mass, resting energy expenditure, and daily activity in conditions of extreme body mass index. Int J Endocrinol. 2014;2014:857270.
- Moreno-Navarrete JM, Ortega F, Serrano M, et al. Irisin is expressed and produced by human muscle and adipose tissue in association with obesity and insulin resistance. J Clin Endocrinol Metab. 2013;98:E769–E778.
- Park KH, Zaichenko L, Brinkoetter M, et al. Circulating irisin in relation to insulin resistance and the metabolic syndrome. J Clin Endocrinol Metab. 2013;98:4899–4907.
- Daskalopoulou SS, Cooke AB, Gomez YH, et al. Plasma irisin levels progressively increase in response to increasing exercise workloads in young, healthy, active subjects. Eur J Endocrinol. 2014;171:343–352.
- Stengel A, Hofmann T, Goebel-Stengel M, Elbelt U, Kobelt P, Klapp BF. Circulating levels of irisin in patients with anorexia nervosa and different stages of obesity – correlation with body mass index. Peptides. 2013;39:125–130.
- Timmons JA, Baar K, Davidsen PK, Atherton PJ. Is irisin a human exercise gene? Nature. 2012;488:E9–10.
- Roca-Rivada A, Castelao C, Senin LL, et al. FNDC5/irisin is not only a myokine but also an adipokine. PLoS One. 2013;8:e60563. doi: 10.1371/journal.pone.0060563.
- Sanchis-Gomar F, Alis R, Pareja-Galeano H, et al. Circulating irisin levels are not correlated with BMI, age, and other biological parameters in obese and diabetic patients. Endocrine. 2014;46:674–677.
- Crujeiras AB, Pardo M, Casanueva FF. Irisin: 'Fat' or artefact. Clin Endocrinol (Oxf). 2015;82:467–474.
- Crujeiras AB, Zulet MA, Lopez-Legarrea P, et al. Association between circulating irisin levels and the promotion of insulin resistance during the weight maintenance period after a dietary weight-lowering program in obese patients. Metabolism. 2014;63:520–531.
- Staiger H, Böhm A, Scheler M, et al. Common genetic variation in the human FNDC5 locus, encoding the novel muscle-derived 'browning' factor irisin, determines insulin sensitivity. PLoS One. 2013;8:e61903. doi: 10.1371/journal.pone.0061903.
- Lopez-Legarrea P, de la Iglesia R, Crujeiras AB, et al. Higher baseline irisin concentrations are associated with greater reductions in glycemia and insulinemia after weight loss in obese subjects. Nutr Diabetes. 2014;4:e110. doi: 10.1038/nutd.2014.7.
- Gamas L, Matafome P, Seiça R. Irisin and myonectin regulation in the insulin resistant muscle: Implications to adipose tissue: muscle crosstalk. J Diabetes Res. 2015;2015:359159.
- Cnop M, Landchild MJ, Vidal J, et al. The concurrent accumulation of intra-abdominal and subcutaneous fat explains the association between insulin resistance and plasma leptin concentrations: Distinct metabolic effects of two fat compartments. Diabetes. 2002;51:1005–1015.
- Sanchis-Gomar F, Alis R, Pareja-Galeano H, Romagnoli M, Perez-Quilis C. Inconsistency in circulating irisin levels: What is really happening? Horm Metab Res. 2014;46:591–596.